CANADIAN JOURNAL OF APPLIED SCIENCE AND TECHNOLOGY © 2017 OPEN ARCHIVES INITIATIVE | Volume 5| Issue 2 | ISSN: 2356-6173
An Econometric Analysis of FDI and Economic Growth in
Ghana
Stephany Abokzele Adongo1
, Lizhen Chen
1, Hu Xuhua
11
School of Finance and Economics, Jiangsu University, 301 Xuefu Road, Zhenjiang, Jiangsu, P.R. China
Corresponding author:
Lizhen Chen
(adongostephany@gmail.com)ABSTRACT
Underpinning trends in investment flows has been a strong tendency towards liberalization in trade, investment and finance related policies. Currently, FDI has been used more as a market entry strategy for investors, rather than an investment strategy. FDI is expected to spur growth in GDP and provide the benefits of reduced cost through the realization of scale economies, and coordination advantages, especially for integrated supply chains. A fifteen year period of FDI inflow data to Ghana was collated from the Ministry of Trade and Industry, Ghana Statistical Service and the Ghana Investment Promotion Council. This study explored the impact of country risk on foreign direct investment (FDI) inflows into Ghana. The processes of this paper show that a positive long-run relationship exists between the variables. The ADF unit root test suggests that the variables are non-stationary at levels, but become stationary in the first differences. The Johansen co-integration test indicates that there is long-run relationship between FDI and GDPGR, and the effect is significant. Also, finding of Granger causality states that there is a bi-directional causality between FDI and GDPGR.
Keywords: Foreign, Direct, Investment, Economic Growth, Cointegration, Ghana
INTRODUCTION
One major feature of the present day world has been the circulation of private capital flow in the form of Foreign Direct Investment (FDI) in developing countries, especially since the 1980s. Most of these foreign investments include the establishment of an acquisition of overseas raw material and component operations, production plants and sales subsidiaries (Shok, et al, 2015). The International Monetary Fund (IMF) defines Foreign Direct Investment (FDI) as a category of international investment where a resident in one economy (the direct investor) obtains a lasting interest in an enterprise resident in another economy (IMF, 2016).
The implementation of market oriented economic and financial reforms has resulted in an enormous amount of external capital flowing into the emerging markets across the world. These reforms have opened up such economies to significant improvements in Gross Domestic Product (GDP) and other economic
fundamentals. FDI is seen as a source of economic development and modernization, income growth and employment. It allows technology transfer mainly in the form of new varieties of capital inputs which may not be achieved through trade in goods and services (AsafuAdjaye, 2005). It also contributes to human capital development which ultimately leads to growth in the host country. Multinational companies invest in foreign lands because of potentially greater cost effectiveness and profitability in sourcing inputs and servicing markets through a direct presence in a number of locations rather than relying on imports and exports to support their operations (Sakyi, et al, 2015).
According to Okafor (2015) immediately after independence in the 1960s, most African countries in a bid to protect local industries imposed trade restrictions and controls on capital. In recent years however, attention has been given to attraction of
foreign direct investment (FDI) with policies that will whet the appetite of foreign firms. The liberal FDI policy by successive governments of Ghana as well as the deregulation and privatization of the telecommunication sector, for example, has triggered a wave of international investments in the sector. The UNCTAD (2015) report indicates that the BRICS countries (Brazil, the Russian Federation, India, China and South Africa) continued to be the leading sources of FDI among emerging investor countries. Flows from these five economies rose from $7 billion in 2015 to $145 billion in 2015, accounting for 10 per cent of the world total. Their
Transnational Corporations are becoming
increasingly active, including Africa. In the ranks of top investors, China moved up from the sixth to the third largest investor in 2012, after the United States and Japan, the report states. China moved sharply to second world best economy in 2015, led by United States, while United Kingdom taking third position (Anyanwu & Yameogo, 2015).
The growth of emerging markets has been attributed, in large part, to incoming foreign direct investments. Companies investing abroad can realise higher growth rates and diversify their income, which creates opportunities for investors. FDI is thus constituted as equity capital, reinvested earnings and other capital (UNCTAD, 2015). The most distinctive features of FDI are transfer of resources, capital formation abroad and acquisition of control (Kindleberger, 2015; Krugman and Obstfeld, 2015). FDI flows are made up of capital provided by foreign investors to enterprises in another economy with an expectation of obtaining profits derived from the capital participation in the management of the enterprise in which they invest. In this research, FDI refers to the monetary resources foreigners invest in companies or their subsidiaries in Ghana and China.
There is however a certain level of awareness among international investors to the fact that the capital inflows to developing countries have an element of economic growth as well as risk that may have rippling effects on the international financial sector (Kariuki, 2015). This risk reflects the potentially adverse effects of a country’s environment on the future cash inflows of the investment. Multinationals often look at the current and potential state of the economy of the host country since a recession can drastically reduce demand (Dah & Sulemana, 2010). Among the critical factors that affect FDI inflows especially in many developing countries is country risk. Country risk has become an issue of major concern in international trade and investment over the last three decades. Bryan (2015) defines country
risk as the economic, political and business risks that are unique to a specific country, and that might result in unexpected investment losses. In other words, it refers to the type of risk that an investor faces arising from adverse political, economic or financial developments in a country. Although this risk affects all investors assessing investment opportunities in a foreign country, the most affected are the ones that invest in the transition economies (Petrovic and Stankovic, 2015). This has led to the development of country specific assessment techniques that are aimed at monitoring the risks to international business.
Given the surge in international trade and investments across many parts of the world, the need for the analyses of country risk on foreign direct investments is crucial. It is for this reason that the importance of country rating agencies cannot be downplayed. Almost every investable country receives ratings from these agencies. Risk rating agencies provide qualitative and quantitative country risk ratings, combining information about alternative measures of economic, financial and political risk ratings, to obtain a composite country risk rating (Hoti, 2014).
In the view of Cosset and Roy (2015), following the rapid growth in the international debt of less developed countries in the 1970s and the increasing incidence of debt rescheduling in the 1980s, country risk which reflects the ability and willingness of a country to service its financial obligation has become a topic of major concern for the international financial community.
Perceptions of the determinants of country risk are important because they affect both the supply and the cost of international capital flows (Brewer and Rovoli, 2014). Thus, supply and the cost of capital increase as the country risk increases. It is for this reason that the Price Waterhouse Opacity index tracks elements of risk in a country in order to assess the adverse impact of the opacity of capital (cost of borrowing funds). The index is based on corruption in government bureaucracy, laws governing contracts or property rights and accounting standards.
The other indicators are issues related to the economy such as the fiscal and monetary factors and lastly the business regulations in a country. In essence, a high degree of opacity in any of these elements will raise the cost of doing business and curtail the availability of investment capital (Iddrisu, et al, 2015).
Financial risk as a component of country risk has been defined by Ali et al (2013) as the risk that a country may not be able to repay its foreign liabilities. Financial risk in a country that is burdened with a
high debt overhang is likely to lead to a financial crisis. As the amount of foreign debt increases relative to the borrowing country’s GDP, the country’s ability to repay its debt will decline and the financial risk of the country will increase. Usually, investors find those countries with too much foreign debt relative to GDP to be less attractive for investment (Iddrisu, et al, 2015). The burden is even more if a country experiences persistent current account deficits for many years. The flow of FDI is consequently affected in the long run. Lower
corporate profitability, falling stock market
valuations, slow economic growth or recovery have been noted as factors that impede FDI inflows (Asongu, Set al, 2015).
Political risk also refers to the risk that the returns on an investment could suffer as a result of political changes or instability in a country. Instability affecting returns on investment could stem from a change in government, legislative bodies, other foreign policy makers, or military control (Görg & Seric, 2015). This type of country risk is hard to quantify because there are limited sample sizes or case studies when discussing an individual nation. Ali et al (2013) find that institutions are a robust predictor of FDI and that property rights security is the most important aspect of institutions in determining FDI flows. On the other hand, there are some papers finding an insignificant effect of country risk on inward FDI. For instance, Asiedu (2014) conclude that political risk does not have any significant impact on FDI.
Economic risk refers to the risks associated with a fall in a country’s economic strengths. Where the economic weaknesses outweigh the strengths, the economic risk will be high. Economic risk components are based on accepted ratios between measured data within the national economic structure. Risk points are assessed for each of the component factors of GDP per head of population, real annual GDP growth, annual inflation rate, budget balance as a percentage of GDP, and current account balance as a percentage of GDP (ICRG, 2013). As weak economic conditions persist, FDI flows and notably cross border mergers and acquisitions to developed countries decline. A high inflation rate in a host country has been blamed for dwindling FDI inflows. Cash inflows are adversely affected due to reduction in the real value of capital invested and future returns (Adams, et al, 2015).
It has been a major drive for successive governments in Ghana to attract more foreign direct investments as a means of generating growth in the economy. Foreign investments in the country have been in the areas of mining, petroleum, telecommunications and
other infrastructural developments. It has been the recognition of the various governments that attracting FDI requires an enabling legal environment (Salim, et al, 2015). There are also sector specific laws that further regulate banking, nonbanking financial
institutions, insurance, fishing, securities,
telecommunications, energy, and real estate.
Foreigners who are interested in investing in Ghana are required to satisfy the provisions of the investment bill as well as the provisions of sector specific laws. In general, the GIPC has streamlined procedures and reduced delays.
The new Ghana Investment Promotion Council (GIPC) Bill 2013 which replaces the GIPC Act, 1994 (Act 478), governs investment in all sectors of the economy and it ropes in all enterprises, including mining and petroleum, areas that were not previously covered by the GIPC Act 478. The repealed Act 1994 (Act 478) excluded minerals and mining, oil and gas, and the free zones. The new Bill is a revision of the country’s investment laws to reflect changing economic dynamics to guarantee optimum business opportunities for both foreign and domestic businesses (Essel, 2015). The Bill seeks to establish the Ghana Investment Promotion Centre as a
government agency responsible for the
encouragement and promotion of investments. The drive for the new Bill has been to ensure increased efficiency in the coordination of investments, improved investment promotion strategies and a comprehensive dissemination of information on investment in Ghana.
According to the GIPC, the bill seeks to provide specialised incentives to attract and retain strategic investors to make Ghana a competitive investment destination, and to provide Ghanaians with opportunities to take advantage of the improved economic situation prevailing in the country. It however addresses the gross abuse of huge foreign exchange resources being repatriated without tangible transfer of technology (Shen, 2015).
Many benefits for investors under Act 478, such as guarantees against expropriation, dispute incentives for special investments and transferability of earnings, have been retained in the new bill. Constitution however sets out some exceptions and a clear procedure for the payment of compensation in allowable cases of expropriation or nationalization (Alagoa, 2015).
The government may compulsorily take possession or acquire property only where the acquisition is in the interest of national defense, public safety, public order, public morality, public health, town and country planning, or the development or utilization of property in a manner to promote public benefit. It
must, however, make provision for the prompt payment of fair and adequate compensation. The Government of Ghana also allows access to the high court by any person who has an interest or right over the property (US Embassy, 2015).
The laws of Ghana recognize the right of foreign and domestic private entities to own and operate business enterprises. The laws however restrict investors in certain areas of the economy. For instance under the new GIPC bill 2013, only citizens of the country can operate the following enterprises: the printing of recharge scratchcards for the use of subscribers of mobile communication services; retailing of Internet bandwidth and mobile telephony valueadded services; production of exercise books and other basic stationery; and importation and internal distribution of finished pharmaceutical products (Johnston & Ramirez, 2015). Other areas also require at least 30% participation by a citizen, or an enterprise which is wholly owned by citizens (Alagoa, 2015).
These areas are: (a) the production of packaging materials; (b) manufacture of furniture and wood products; (c) manufacture of sanitary paper products; (d) provision of all services; including mining, oil
and gas; and (e) manufacture of generic
pharmaceutical products. As a way of protecting foreign investments, Ghana has signed up as a member of the Multilateral Investment Guarantee Agency (MIGA) of the World Bank, which provides investment guarantees against non-commercial risk for investments in developing countries. Moreover, the Government has entered into bilateral Investment Promotion and Protection Agreements (IPPAs), as well as double taxation treaties with a number of countries to further enhance the protection and security of the investment climate (Adams et al, 2014).
According to the United Nations World Investment report for June 2015, the country’s recent performance in attracting FDIs was mainly due to the developments in the upstream petroleum sector, following the discovery of oil in commercial quantities in the country (Work Bank, 2015). According to the 2015 World Investment Report, Ghana was the fifth largest recipient of FDI inflows into Africa for the year 2015 after Nigeria,
Mozambique, South Africa and DR Congo. Ghana’s record in attracting FDI inflows has been impressive over the years. The country received 3.3 billion dollars in 2015 while in 2014 it raked in 3.2 billion dollars up from the $2.5 billion and $2 billion it received in 2013 and 2015 respectively (Work Bank, 2015).
The Ghana Investment Promotion Center 2015 report states that, the total number of projects registered for
2015 was 399, with a total estimated value of US$5.63 billion against 514 project registered for the corresponding period of 2014 with a total estimated value of US$7.68 billion. Out of the 399 registered projects, 239 were wholly owned foreign enterprises and 160 were joint ventures between Ghanaians and foreign partners (Baccini & Dür, 2015).
The joint venture projects were valued at US$1.97 billion, and the wholly owned foreign enterprises were valued at US$3.66 billion. FDI inflows have been increasing over the years in line with improvements in political risk and macroeconomic stability. It is likely that the discoveries of crude oil off the western coastline of the country will significantly enhance FDI flows into the country in
the years ahead (Otiso & Owusu, 2008).
Underpinning trends in investment flows has been a strong tendency towards liberalization in trade, investment and finance related policies. Currently, FDI has been used more as a market entry strategy for investors, rather than an investment strategy. FDI is expected to spur growth in GDP and provide the benefits of reduced cost through the realization of scale economies, and coordination advantages, especially for integrated supply chains. This study intends to focus on the impact of country risk on foreign direct investment (FDI) inflows into Ghana.
MATERIALS AND METHODS
This study employed a panel data analysis using time series information due to the transversal nature of the information that needed to be analysed. A fifteen year period of FDI inflow data to Ghana was collated form the Ministry of Trade and Industry, Ghana Statistical Service and the Ghana Investment Promotion Council. The period under consideration spans 2000 to 2015 as these were the publicly available information at the time of the research. The economic database of the Institute of Statistical and Economic Research of the University of Ghana and the World Bank WDI database were used as benchmark study to validate the FDI inflows into Ghana. For the sake of clarity FDI is defined in the research as the total inflow of investments to acquire long term management interest in a domestic firm. The ownership threshold must be more than 10% in an organisation of which the investor does not have prior interest. It includes the sum of equity capital, reinvestment of earnings, other long term capital, and short-term capital as shown in the balance of payments. This series shows net inflows in the reporting economy and data are in current U.S. dollars. Table 1 shows the descriptive statistics of the
heterogeneous FDI factors on economic growth, we split factors into log (CFDIit) – the logarithm of the
construction FDI Inflows as a percentage of GDP, log
(SFDIit) the logarithm of the service FDI Inflowsas a
percentage of GDP, log (EFDIit) the logarithm of the
extractive FDI Inflows as a percentage of GDP, log (MFDIit) and the logarithm of the manufacturingFDI Inflows as a percentage of GDP. The four industries were chosen because they constitute the largest proportion of foreign direct investment in Ghana for the last two decades (GIPC, 2016). Heterogeneity was
also noted in terms of Ln (FDI Age) the natural
logarithm of the age of the FDIs, Ln (EP Size) the
natural logarithm of the size of the FDIs, and Ln
(Board Comp) the natural logarithm of the board composition of the FDIs. Finally heterogeneity is also
envisioned in terms of country of origin (Dummy
COO) and differences in ownership size
(LnOWNsize). For the dependent variable of interest, economic growth was proxied by Per Capita Income which includes approximate the average worth of each individual in the country. This can be a useful way to measure social welfare effect of FDI and economic growth. Again all data were recorded in United States Dollars:
FDIt = π0+π1GDPGRt + ζt
and,
GDPGRt = Ϯ0+Ϯ1FDIt +η t
where the parameters ζ and η are normally distributed error terms.
Co-integration Test
Co-integration explains that one or more linear combinations of time-series variables are stationary even though they are individually non-stationary according to Dickey et al. (1991). In other words, if two or more series are individually integrated in the same order but some linear combination of them have lower order of integration, then the series are said to be co-integrated. Granger & Newbold (1974) report that a possible presence of co-integration has to be taken into account when one select a method to make a hypothesis on the relationship between two non-stationary variables. Before moving to co-integration test, there was the need to determine the optimal lag-length using the criteria such as AIC, BIC, and SIC. The following output in table 1 was used to pin down the optimal lag-length. Indeed, the stars show that the lag-length is one. Please note that information criteria have to be minimized, and that's the reason why the stars are shown at certain values.
Granger Causality
Granger (1988) reports that the Granger causality test is a statistical hypothesis test for determining whether one time series is useful in forecasting another. It can be relevant only when the variables are either stationary or nonstationary but cointegrated, can be written as:
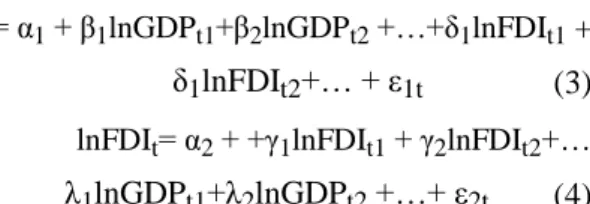
lnGDPt= α1 + β1lnGDPt1+β2lnGDPt2 +…+δ1lnFDIt1 +
δ1lnFDIt2+… + ε1t (3)
lnFDIt= α2 + +γ1lnFDIt1 + γ2lnFDIt2+…
λ1lnGDPt1+λ2lnGDPt2 +…+ ε2t (4)
where ε1t and ε2t are white noise error terms , and β, δ,
γ ,λ are the parameters which tell how much the past
values of the variables can explain the current value of either series. The null hypothesis in general is variable X does not Granger cause variable Y. In our example there are two null hypotheses: Foreign direct investment does not Granger cause economic growth (GDPGR), and economic growth does not Granger cause FDI. The null hypothesis of no Granger causality cannot be rejected if and only if no lagged value of an explanatory variable is retained in the regression (3) and or in the regression (4).
Table 1: The Result of the Granger Causality Test
The result in the table 4 indicates that I reject the null hypotheses. Hence, GDPGR Granger Causes FDI just as FDI Granger Causes GDPGR at 5% significance level, meaning that there is a two-way (mutual) causality effect between foreign direct investment and economic growth.
Table 2: Descriptive Statistics of Independent and Dependent Variables
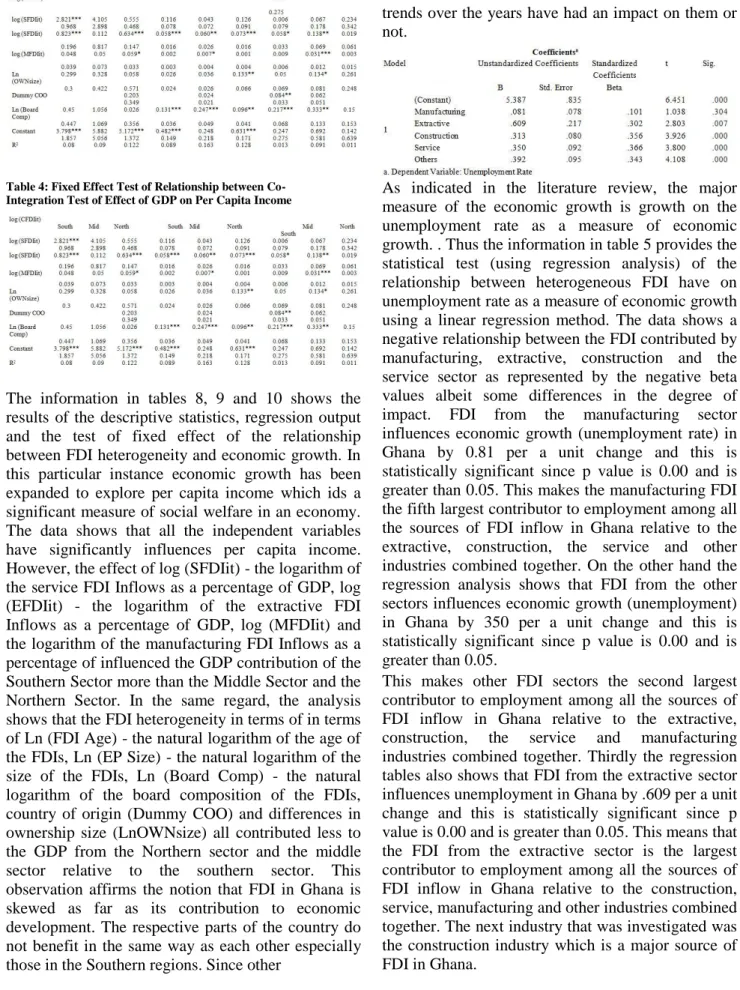
Table 3: Regression Results of Co-Integration Test of Effect of GDP on Per Capita Income
Table 4: Fixed Effect Test of Relationship between Co-Integration Test of Effect of GDP on Per Capita Income
The information in tables 8, 9 and 10 shows the results of the descriptive statistics, regression output and the test of fixed effect of the relationship between FDI heterogeneity and economic growth. In this particular instance economic growth has been expanded to explore per capita income which ids a significant measure of social welfare in an economy. The data shows that all the independent variables have significantly influences per capita income. However, the effect of log (SFDIit) - the logarithm of the service FDI Inflows as a percentage of GDP, log (EFDIit) - the logarithm of the extractive FDI Inflows as a percentage of GDP, log (MFDIit) and the logarithm of the manufacturing FDI Inflows as a percentage of influenced the GDP contribution of the Southern Sector more than the Middle Sector and the Northern Sector. In the same regard, the analysis shows that the FDI heterogeneity in terms of in terms of Ln (FDI Age) - the natural logarithm of the age of the FDIs, Ln (EP Size) - the natural logarithm of the size of the FDIs, Ln (Board Comp) - the natural logarithm of the board composition of the FDIs, country of origin (Dummy COO) and differences in ownership size (LnOWNsize) all contributed less to the GDP from the Northern sector and the middle sector relative to the southern sector. This observation affirms the notion that FDI in Ghana is skewed as far as its contribution to economic development. The respective parts of the country do not benefit in the same way as each other especially those in the Southern regions. Since other
measures of economic growth can help understand the specific effect of FDI, the study also empanelled some of them and tested the extent to which FDI trends over the years have had an impact on them or not.
As indicated in the literature review, the major measure of the economic growth is growth on the unemployment rate as a measure of economic growth. . Thus the information in table 5 provides the statistical test (using regression analysis) of the relationship between heterogeneous FDI have on unemployment rate as a measure of economic growth using a linear regression method. The data shows a negative relationship between the FDI contributed by manufacturing, extractive, construction and the service sector as represented by the negative beta values albeit some differences in the degree of impact. FDI from the manufacturing sector influences economic growth (unemployment rate) in Ghana by 0.81 per a unit change and this is statistically significant since p value is 0.00 and is greater than 0.05. This makes the manufacturing FDI the fifth largest contributor to employment among all the sources of FDI inflow in Ghana relative to the extractive, construction, the service and other industries combined together. On the other hand the regression analysis shows that FDI from the other sectors influences economic growth (unemployment) in Ghana by 350 per a unit change and this is statistically significant since p value is 0.00 and is greater than 0.05.
This makes other FDI sectors the second largest contributor to employment among all the sources of FDI inflow in Ghana relative to the extractive,
construction, the service and manufacturing
industries combined together. Thirdly the regression tables also shows that FDI from the extractive sector influences unemployment in Ghana by .609 per a unit change and this is statistically significant since p value is 0.00 and is greater than 0.05. This means that the FDI from the extractive sector is the largest contributor to employment among all the sources of FDI inflow in Ghana relative to the construction, service, manufacturing and other industries combined together. The next industry that was investigated was the construction industry which is a major source of FDI in Ghana.
The analysis as shown in the regression output indicates that FDI from the construction sectors influences unemployment in Ghana by .313 per a unit change and this is also statistically significant. This is because the p value is 0.00 and is greater than 0.05. This means that the FDI from the construction industry is the second largest contributor to employment among all the sources of FDI inflow in Ghana relative to the extractive, construction, the service and manufacturing industries combined together.
Table 5: Regression of the Effect of FDI Heterogeneity on Current Account Balance (Economic Growth)
As indicated in the literature review, the major measure of the economic growth is growth on the current account balance. Thus the information in table 6 provides the statistical test (using regression analysis) of the relationship between heterogeneous FDI have on the current account balance as a measure of economic growth using a linear regression method. The data shows a positive association between the FDI contributed by manufacturing, extractive, construction and the service sector as represented by the positive beta values albeit some differences in the degree of impact. FDI from the manufacturing sector influences current account balance in Ghana by .303 per a unit change and this is statistically significant since p value is 0.00 and is greater than 0.05. This makes the manufacturing FDI the third largest contributor to current account balance among all the sources of FDI inflow in Ghana relative to the extractive, construction, the service and other industries combined together. On the other hand the regression analysis shows that FDI from the other sectors influences current account balance in Ghana by .040 per a unit change and this is statistically significant since p value is 0.00 and is greater than 0.05. This makes other FDI sectors the least contributor to current account balance among all the sources of FDI inflow in Ghana relative to the
extractive, construction, the service and
manufacturing industries combined together. Thirdly the regression tables also shows that FDI from the extractive sector influences current account balance in Ghana by .825 per a unit change and this is
statistically significant since p value is 0.00 and is greater than 0.05. This means that the FDI from the extractive sector is the largest contributor to current account balance among all the sources of FDI inflow in Ghana relative to the construction, service, manufacturing and other industries combined together. The next industry that was investigated was the construction industry which is a major source of FDI in Ghana. The analysis as shown in the regression output indicates that FDI from the construction sectors influences current account balance in Ghana by .005 per a unit change and this is also statistically significant. This is because the p value is 0.00 and is greater than 0.05. This means that the FDI from the construction industry is the least contributor to current account balance among all the sources of FDI inflow in Ghana relative to the
extractive, construction, the service and
manufacturing industries combined together.
Table 1: Regression of the Effect of FDI Heterogeneity on Technology and Innovation Index (Economic) Growth
As indicated in the literature review, the major measure of the economic growth is growth on the technology and innovation. Thus the information in table 7 provides the statistical test (using regression analysis) of the relationship between heterogeneous FDI and technology and innovation as a measure of economic growth using a linear regression method. The data shows a positive association between the FDI contributed by manufacturing, extractive, construction and the service sector as represented by the positive beta values albeit some differences in the degree of impact. FDI from the manufacturing sector influences technology and innovation in Ghana by .424 per a unit change and this is statistically significant since p value is 0.00 and is greater than 0.05. This makes the manufacturing FDI the third largest contributor to technology and innovation among all the sources of FDI inflow in Ghana relative to the extractive, construction, the service and other industries combined together.
On the other hand the regression analysis shows that FDI from the other sectors influences technology and innovation in Ghana by .732 per a unit change and this is statistically significant since p value is 0.00
and is greater than 0.05. This makes other FDI sectors the second largest contributor to technology and innovation among all the sources of FDI inflow in Ghana relative to the extractive, construction, the service and manufacturing industries combined together. Thirdly the regression tables also show that FDI from the extractive sector influences technology and innovation in Ghana by .917 per a unit change and this is statistically significant since p value is 0.00 and is greater than 0.05. This means that the FDI from the extractive sector is the largest contributor to technology and innovation among all the sources of FDI inflow in Ghana relative to the construction, service, manufacturing and other industries combined together. The next industry that was investigated was the construction industry which is a major source of FDI in Ghana. The analysis as shown in the regression output indicates that FDI from the construction sectors influences technology and innovation in Ghana by .209 per a unit change and this is also statistically significant. This is because the p value is 0.00 and is greater than 0.05. This means that the FDI from the construction industry is the fifth largest contributor to technology and innovation among all the sources of FDI inflow in Ghana relative to the extractive, construction, the service and manufacturing industries combined together.
Table 7: Regression of the Effect of FDI Heterogeneity on Gender Equality Index
As indicated in the literature review, the major measure of the economic growth is growth on the gender income equality. Thus the information in table 8 provides the statistical test (using regression analysis) of the relationship between heterogeneous FDI have on GDP as a measure of economic growth using a linear regression method. The data shows a positive association between the FDI contributed by manufacturing, extractive, construction and the service sector as represented by the positive beta values albeit some differences in the degree of impact. FDI from the manufacturing sector influences gender income equality in Ghana by .065 per a unit change and this is statistically significant since p value is 0.00 and is greater than 0.05. This makes the manufacturing FDI the largest contributor to gender income equality among all the sources of
FDI inflow in Ghana relative to the extractive, construction, the service and other industries combined together. On the other hand the regression analysis shows that FDI from the other sectors influences gender income equality in Ghana by .085 per a unit change and this is statistically significant since p value is 0.00 and is greater than 0.05. This makes other FDI sectors the second largest contributor to gender income equality among all the sources of FDI inflow in Ghana relative to the
extractive, construction, the service and
manufacturing industries combined together. Thirdly the regression tables also shows that FDI from the extractive sector influences gender income equality in Ghana by .919 per a unit change and this is statistically significant since p value is 0.00 and is greater than 0.05.
This means that the FDI from the extractive sector is the third largest contributor to gender income equality among all the sources of FDI inflow in Ghana relative to the construction, service, manufacturing and other industries combined together. The next industry that was investigated was the construction industry which is a major source of FDI in Ghana. The analysis as shown in the regression output indicates that FDI from the construction sectors influences gender income equality in Ghana by .087 per a unit change and this is also statistically significant. This is because the p value is 0.00 and is greater than 0.05. This means that the FDI from the construction industry is the fourth largest contributor to gender income equality among all the sources of FDI inflow in Ghana relative to the
extractive, construction, the service and
manufacturing industries combined together.
Table 8: Regression of the Effect of FDI Heterogeneity on Rate of Urbanization
As indicated in the literature review, the major measure of the economic growth is growth on the rate of urbanization. . Thus the information in table 9 provides the statistical test (using regression analysis) of the relationship between heterogeneous FDI have on rate of urbanization as a measure of economic growth using a linear regression method. The data shows a positive association between the FDI
contributed by manufacturing, extractive, construction and the service sector as represented by the positive beta values albeit some differences in the degree of impact. FDI from the manufacturing sector influences rate of urbanization in Ghana by .030per a unit change and this is statistically significant since p value is 0.00 and is greater than 0.05. This makes the manufacturing FDI the largest contributor to rate of urbanization among all the sources of FDI inflow in Ghana relative to the extractive, construction, the service and other industries combined together. On the other hand the regression analysis shows that FDI from the other sectors influences rate of urbanization in Ghana by .039 per a unit change and this is statistically significant since p value is 0.00 and is greater than 0.05.
This makes other FDI sectors the second largest contributor to rate of urbanization among all the sources of FDI inflow in Ghana relative to the
extractive, construction, the service and
manufacturing industries combined together. Thirdly the regression tables also shows that FDI from the extractive sector influences rate of urbanization in Ghana by .469 per a unit change and this is statistically significant since p value is 0.00 and is greater than 0.05.
This means that the FDI from the extractive sector is the third largest contributor to rate of urbanization among all the sources of FDI inflow in Ghana relative to the construction, service, manufacturing and other industries combined together. The next industry that was investigated was the construction industry which is a major source of FDI in Ghana. The analysis as shown in the regression output indicates that FDI from the construction sectors influences rate of urbanization in Ghana by .013 per a unit change and this is also statistically significant. This is because the p value is 0.00 and is greater than 0.05. This means that the FDI from the construction industry is the fourth largest contributor to rate of urbanization among all the sources of FDI inflow in Ghana relative to the extractive, construction, the service and manufacturing industries combined together.
Conclusions and Policy Implication
This study attempts to investigate the relationship between foreign direct investment (FDI) and economic growth (GDPGR) using the annual data over the period of 1979-2011. The processes of this paper show that a positive long-run relationship exists between the variables. The ADF unit root test suggests that the variables are non-stationary at
levels, but become stationary in the first differences. The Johansen co-integration test indicates that there is long-run relationship between FDI and GDPGR, and the effect is significant. Also, finding of Granger causality states that there is a bi-directional causality between FDI and GDPGR. As Kahramanoglu (2009) suggests, the results of this study imply that a positive change in the level of production of goods and services is likely to increase the FDI in Ghana. In the extant literature, it was explained by Alfaro, et al (2013) that FDI should increase economic growth in the host economy and even more effective in boosting economic growth than domestic investment (Borensztein, De Gregorio, & Lee 2014). The literature further revealed that the ways foreign direct investment should have positive effects on economic growth in the host economy are five, given the “appropriate host-country policies and a basic level of development” (OECD 2014, 5), FDI facilitates the transfer of technological advances and know-how; it increases competition; human capital improves; it integrates the economy towards the world economy; and it pushes for more positive development of firms. However, FDI can also negatively affect economic growth. Moura and Forte (2015) point out that although, as OECD (2014) states, there are five channels through which FDI can have positive effects on economic growth there are five channels through which FDI can have negative effects on economic growth. While the regression analyses show the impact of foreign direct investment on GDP as the major indicator of economic growth in Ghana, the subsequent analysis also shows that it FDI also has significant effect on other major indicators of economic growth such as Current Account Balance, Unemployment Rate, Technology and Innovation Index, Gini Co-Efficient (Inequality), Gender Inequality Index (GII), Urbanisation, Human Development Index, Per Capita Income, Openness to Trade, Carbon Footprint. For example the analysis shows that a unit change of FDI no matter the source has negative effect on Current Account Balance. This is because it reduces the potential imports that the country would have made for those products and services while boosting some level of exports. In the
same regard, Unemployment Rate is also
significantly reduced by a change in FDI and similar trends are also observed for the remaining indicators. A major issue that evokes critical analysis is the knowledge that FDI influences gender income equality which was previously not mentioned in most research. Besides, politics and economists in Ghana should give more attention on attracting higher levels of foreign direct investment into Ghana in order to promote economic growth.
[1] Shok, I. A., Kamyshanchenko, E. N., & Isaan, J. (2015). Problems of Enhancement of Foreign Direct Investment to Ghana. In
Modern Problems of Socio-Economic
Systems in the Context of Globalization: a Collection of Scientific Papers prepared on the Basis of Materials of the VIII Intern. Scientific and Practical. Conf.(Belgorod (pp. 17-19).
[2] Asafu-Adjaye, J. (2005). What has been the impact of foreign direct investment in Ghana? (No. 9). Institute of Economic Affairs.
[3] Sakyi, D., Commodore, R., & Opoku, E. E. O. (2015). Foreign direct investment, trade openness and economic growth in Ghana: An empirical investigation. Journal of African Business, 16(1-2), 1-15.
[4] Okafor, G. (2015). Locational determinants of us outward fdi into sub-saharan
Africa. The Journal of Developing Areas, 49(1), 187-205.
[5] Anyanwu, J. C., & Yameogo, N. D. (2015). What Drives Foreign Direct Investments into
West Africa? An Empirical
Investigation. African Development
Review, 27(3), 199-215.
[6] Kariuki, C. (2015). The determinants of foreign direct investment in the African Union. Journal of Economics, Business and Management, 3(3), 346-351.
[7] Dah, F. K., & Sulemana, M. (2010). The contribution of oil to the economic development of Ghana: The role of foreign direct investments (FDI) and government policies.
[8] Iddrisu, A. A., Immurana, M., & Halidu, B. O. (2015). The Impact of Foreign Direct Investment (FDI) on the performance of the Agricultural Sector in Ghana. International Journal of Academic Research in Business and Social Sciences, 5(7), 240-259.
[9] Iddrisu, A. A., Immurana, M., & Halidu, B. O. (2015). The Impact of Foreign Direct Investment (FDI) on the performance of the Agricultural Sector in Ghana. International Journal of Academic Research in Business and Social Sciences, 5(7), 240-259.
[10] Asongu, S. A., De Moor, L., & Tchamyou, V. S. (2015). Pre-and post-crisis dynamics of financial globalisation for financial development in Africa. African Governance and Development Institute WP/15/045. [11] Görg, H., & Seric, A. (2015). Linkages with
multinationalsanddomesticfirm
performance: The role of assistance for local firms. European Journal of Development Research.
[12] Adams, K., Debrah, Y. A., Williams, K., & Mmieh, F. (2015). Why on earth should foreign banks invest in Africa's financial services sector? Evidence from financial multinationals in Ghana. Thunderbird International Business Review, 57(6), 445-462.
[13] Salim, N. J., Mustaffa, R., & Hanafiah, N. J. A. (2015). FDI and Economic Growth Linkages in Malaysia. Mediterranean Journal of Social Sciences,6(4), 652.
[14] Essel, S. A. (2015). Maximizing the benefits of technology in emerging economies: the prospects and challenges of technology transfer to local firms in Ghana. Journal of Advances in Science and Technology Research (JASTER), 2(1).
[15] Shen, X. (2015). Private Chinese investment in Africa: myths and realities.Development Policy Review, 33(1), 83-106.
[16] Alagoa, H. E. (2015). Multinational Enterprise, Foreign Direct Investment (FDI), and Trade Flows; Africa (2008-2014). Foreign Direct Investment (FDI), and Trade Flows, 2008-2014.
[17] Johnston, K. A., & Ramirez, M. D. (2015). Foreign Direct Investment and Economic
Growth in Cote D’Ivoire: A Time Series
Analysis. Business and Economic
Research, 5(2), 35-47.
[18] Adams, K., Debrah, Y. A., Williams, K., & Mmieh, F. (2014). Causes of Financial FDI Inflows into Sub‐Saharan Africa (SSA):
Evidence from Ghana.Thunderbird
International Business Review, 56(5), 439-459.
[19] Baccini, L., & Dür, A. (2015). Investment discrimination and the proliferation of preferential trade agreements. Journal of Conflict Resolution, 59(4), 617-644.
[20] Otiso, K. M., & Owusu, G. (2008). Comparative urbanization in Ghana and Kenya in time and space. GeoJournal, 71(2-3), 143-157.