A COMPARISON OF SYSTEMS AND TOOLS FOR 3D SCANNING
F.B. ter Haara, P. Cignonib, P. Mina, R.C. Veltkampa
aInstitute of Information and Computing Sciences, Utrecht University, the Netherlands bIstituto di Scienza e Tecnologie dell’Informazione - Consiglio Nazionale delle Ricerche, Pisa, Italy
KEY WORDS: Range scanning, Registration, Range scan alignment, Surface Matching
ABSTRACT:
Many 3D scanning systems and software tools are currently available, but a comparative study of their actual precision and robustness still lacks. To this end, this paper presents a comparison of such systems, taking into consideration three alignment tools and two merging tools for the management of scanned data. The comparison will be based on the scanning and reconstruction of two relatively complex artistic sculptures and a number of “ground truth” objects. The quality of the reconstructed 3D models is evaluated using both qualitative and quantitative measures. Quantitative evaluation is performed using Metro, a tool for computing differences between 3D meshes.
1. INTRODUCTION
The process of reconstructing a 3D computer model out of a set of range scans has been a well studied field of research for several decades. During these years various techniques and software tools were developed to aid with the reconstruction of a 3D model, based on two different trends in reconstruction sequences. The first type is to turn the range scans directly into meshes, which is often done automatically by the scan-ning software, and then to perform the alignment and merging of these meshes to obtain the 3D model. The second type is to align the range scans first and then to reconstruct the surface from the unorganized set of 3D points, which results in the final 3D model. This paper presents a comparison of software tools based on the first type of reconstruction sequence, which may restrict the user to use meshes only. For the alignment of meshes the following tools are compared:
MeshAlign (VCLab, 2005),RapidForm (INUS Tech., 2005) andScanalyze (Stanford, 2005). The tools that are compared with respect to the merging of meshes areMeshMerge(VCLab, 2005) andRapidForm(INUS Tech., 2005). At this moment, the merging using the VRIP algorithm provided by Stanford has not been included yet.
The Iterative Closest Point (ICP) algorithm has be-come the dominant method for the alignment of pairs of meshes based purely on the geometry. This pairwise ICP algorithm starts with an initial guess for the rel-ative rigid-body transformation of two meshes. Then the algorithm iteratively refines this transformation by repeatedly selecting pairs of corresponding points on the meshes while minimizing an error metric. Many
∗ Contact email: [email protected]
variants of the pairwise ICP algorithm have been in-troduced, which are compared based on their conver-gence speed using three test scenes (Rusinkiewicz and Levoy, 2001).
The reconstruction of a 3D model involves the align-ment of multiple meshes. The pairwise ICP algorithm will sequentially align all pairs of range scans, which may result in the accumulation of alignment errors. To avoid this, a global alignment step is often applied to spread the alignment error evenly across the avail-able mesh pairs (Pulli, 1999; Neugebauer, 1997). The pairwise ICP algorithm followed by the global align-ment step will be referred to as thefine alignment of the meshes. In this paper the accuracy of the tools will be compared regarding the fine alignment.
Before the fine alignment can be applied the meshes should be roughly aligned first. There are several op-tions for performing the rough alignment:
Manually by using an input method able to rotate and translate each mesh.
Semi-automatically by manually selecting a few corresponding points for each pair of (partially) overlapping meshes. The selected points are used to automatically rotate and translate one mesh to the other.
Automatically by using techniques based on, for example, principal axes computation (Chung et al., 1998), exhaustive search for corresponding points (Chen et al., 1999; Cheng and Don, 1991) or match-ing surfaces signatures. Examples of such signatures are spin-images (Johnson, 1997), point-signatures (Chua and Jarvis, 1997), bitangent curves (Wyn-gaerd et al., 1999) or spherical attribute images (Higuchi et al., 1995).
alignment are not taken into account. The rough align-ment will be obtained using just the semi-automatic technique.
After the alignment, a merging step has to be applied to obtain a single 3D mesh out of a set of aligned meshes. Two possible techniques to merge meshes are a surface zippering technique (Turk and Levoy, 1994) or a volumetric approach based on a discrete distance field (Curless and Levoy, 1996). Many variants of the volumetric approach were developed (summarized in (Rocchini et al., 2004)).
In this paper, we use five objects to reconstruct a model from, two physical and three “synthetic” ob-jects (i.e. created using a 3D modeller). Range scans of the physical objects were acquired using theRoland LPX-250 laser range scanner. The quality of the re-sulting models will be evaluated using several quan-titative measures like the Hausdorff distance and the mean distance. The results of the alignment and merg-ing of synthetic range scans are compared with their originalreferencemodels, which will provide informa-tion about the performance of the applied tools. For the physical objects we have created plausible refer-ence models using a different scanner, the Minolta Vivid 910.
The rest of this paper is organized as follows. We first present the methodology used for comparing the alignment and merging tools using a model recon-struction pipeline. Next, a more descriptive overview of the pipeline is given together with the contribution of each evaluated tools to this pipeline. Followed by results and conclusions.
2. METHOD
First, we give a high-level overview of the acquisition and reconstruction pipeline that is used to create a 3D model out of an object using the various tools. Then, the evaluation of the results, during and after the reconstruction phase, is described.
2.1. Acquisition and reconstruction
This paragraph describes the acquisition and recon-struction pipeline shown in figure 1.
Objects
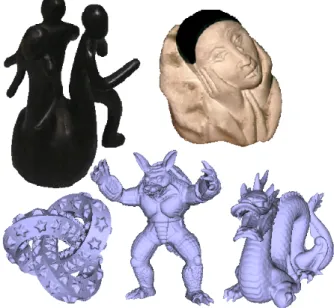
We have used two physical objects and three synthetic objects. The physical objects are the UU-memento
and thepierrot. The three synthetic objects are the
knot,armadillo anddragon (see figure 2).
View selection
During the view selecting the object is placed with a view of interest towards the scan device. This may include the manually placement of an object in front
Fig. 1. The pipeline of the model reconstruction. The boxes shown in gray show the models used during the evaluation.
Fig. 2. The objects used in the comparison. From left to right. Top: The physical objectsUU-memento andpierrot. Bottom: The synthetic objectsknot,armadilloanddragon.
of the range scanner, the selection of a rotation angle in case of a rotation table, or the selection of a different viewing direction of the synthetic object. The view selection is performed several times to obtain a set of range scans from which a 3D computer model can be constructed.
Scanning
The scanning includes scanning using a laser range scanner in case of the physical objects as well as syn-thetic scanning. Synsyn-thetic scans are generated for the synthetic objects by storing the nearest Z-axis values of the object’s surface for a grid with a predetermined resolution. This grid will be called the Z-buffer. The range scans at this stage are clouds of points scanned by the scanning device.
Meshing
The meshing includes two tasks: The triangulation of the point clouds which results in a surface mesh and
the cleanup of these meshes by removing noise, incor-rect faces and small patches. The obtained meshes are aligned and merged using the tools mentioned in the introduction.
Rough alignment
When all range scans are converted into triangular meshes. Then the meshes are placed into an initial rough alignment. The result is a set of meshes in a single coordinate system.
Fine alignment
The roughly aligned meshes are fine aligned using the global ICP algorithms of the alignment tools.
Merging
The aligned meshes are merged into a single mesh using several merging tools based on either the surface zippering technique or a volumetric based approach.
2.2. Evaluation
To evaluate the tools, we will compare the results of the alignment and the results of the merging. For all objects these results are compared with their refer-ence model using Metro (Cignoni et al., 1998). For the physical objects, this means we have to construct reference models first. We will also have a closer look at some particular features of the meshes before and after the merging process.
3. METHOD IMPLEMENTATION 3.1. Objects
The objects used in this paper are selected for their different properties in shape, appearance and manu-facturing.
– TheUU-memento is a dark, reflective object with many protrusions and is approximately 111 mm high.
– Thepierrotis the combination of a white body and a black hat and has a height of 60 mm.
– Theknotis a model we constructed our self using 3D Studio MAX and has many occlusions that would be physically hard to scan with a range scanner if it were a physical object. This model has of 478,704 vertices and 957,408 faces.
– The armadillo is a reconstructed models of ≈ 70 range images using techniques described in (Cur-less and Levoy, 1996). It has 172,974 vertices and 345,944 faces.
– The dragon is reconstructed in the same way as thearmadilloand has 437,645 vertices and 871,414 faces.
Fig. 3. The view selection for the synthetic objects. Different views are obtained by looking from different locations to the origin.
3.2. View selection
The physical objects were scanned using a laser range scanner which performs plane scanning. Each object was scanned from twenty different directions. Eight range scans were obtained by scanning every 45◦ de-grees when placed upwards with its characteristic side to the scan device. Then the object is also scanned for every 45◦degrees when placed on its side, also with its characteristic side directed to scan device if possible. Finally the object is scanned every 90◦ degrees for a different pose to scan parts of the object that were not well covered during the previous two series. Scanning the object in this way will cover most of its surface. For the synthetic objects this view selection method-ology is simulated using the same three series of views following a pre-defined sequence using locations on a unit sphere (see figure 3). The first two series of views, which are highlighted using two gray planes in figure 3, have two common view locations (location number 1 and 5). For the second series we skip these two lo-cations, thus for the synthetic objects we have eigh-teen views instead of the twenty views we have for the physical objects.
3.3. Scanning
TheUU-mementoand thepierrotwere scanned using theRoland LPX-250. TheRoland LPX-250 is a laser range scanner with a rotation table, which sequen-tially samples points on the surface of the object from left to right and from bottom to top. By rotating the laser clockwise and its table counter clockwise both for a small scope, this scanner creates an orthogonal surface scan. The highest possible resolution of this scanner is 0.2×0.2 mm and can be increased in steps of 0.2 mm both horizontally and vertically. The objects were scanned using a scan resolution of 0.4×0.4 mm, because the highest resolution resulted in too noisy range scans for the selected objects. These range scans will be available in the AIM@SHAPE shape reposi-tory (AIM@SHAPE Reposireposi-tory, 2005).
Fig. 4. The Z-buffers of the first four selected views in case of synthetic scanning.
Parameter description Parameter Value Scan resolution res 0.4×0.4 mm Synthetic object heightheight 100 mm Threshold angle tα 80◦
Threshold edge length te 4×res
Threshold patch size tp 100 faces
Table 1
Parameter settings used during the experiments.
Because the synthetic objects are normalized, they are scaled to a size comparable to the physical objects. Then we will obtain a mesh with the same resolution as the physical objects, by selecting the A synthetic range scan equals the depth of the Z-buffer of the scene with the required resolution. The Z-buffers of the first four views are shown in figure 4.
3.4. Meshing
The Roland LPX-250 applies a simple mesh recon-struction technique, which connects the adjacent sample points using quadrilaterals and triangles. The quadrilaterals are then triangulated by connecting the two closest corners. During this meshing no dis-tance criteria for edges or other filtering is applied. Before the meshing, the range scans may suffer from outliers and noise. These outliers cause incorrect faces in the reconstructed mesh. Other incorrect faces are due to occlusion.
The Z-buffers of the synthetic range scans are con-verted to triangular surface meshes by connecting ad-jacent foreground pixels and projecting these pixels to their 3D coordinates using their depth values from the Z-buffer. These meshes also suffer from incorrect faces due to occlusion.
The meshes were cleaned in a similar way as de-scribed by (Johnson, 1997). The cleaning of the meshes includes thresholding the angle between the viewing direction and the surface normal (tα). Values
for this threshold often vary between 76◦ and 81◦. Other cleaning operation applied on the meshes are the removal of long edges compared with the scan resolution (te), the removal of small patches (tp) and
the removal of disconnected vertices. Table 1 shows reasonable values for these parameters which were empirically determined. Afterwards, the final meshes will still contain some noise despite the filtering of many incorrect faces.
3.5. Rough alignment
The alignment tools considered in this paper are all semi-automatic techniques that require an initial rough alignment of the meshes. The rough alignment is performed using four manually selected correspon-dence points on overlapping meshes. All meshes are transformed to the coordinate system of the mesh of the frontal view of the object (the first range scan). This set of transformation matrices are determined only once for each object, and used to create a set of transformed meshes. The set of transformed meshes is used throughout the rest of the paper to ensure the comparison is performed correctly.
3.6. Fine alignment
The roughly aligned meshes are fine aligned using the tools described in the following paragraphs. For each tool some parameters must be set. The parameters can be classified into two groups: parameters that re-strict neighbouring meshes to form a pair, like a min-imal amount of grid overlap, and parameters that de-termine the stopping criteria of the pairwise ICP al-gorithm, like a target alignment error or the number of applied iterations.
MeshAlign
MeshAlign v.2 is a system developed by ISTI-CNR (VCLab, 2005) that allows the registration of multiple meshes using a global ICP algorithm based on the multi-view registration for large datasets described in (Pulli, 1999). This system is especially designed to support the management of a large number of meshes (Callieri et al., 2003). This tool has a large number of ICP parameters that can be adjusted.
RapidForm
RapidForm 2004 (INUS Tech., 2005) is a commer-cial system able to perform every step of the 3D re-construction pipeline as well as many other 3D mod-elling operations. The fine alignment performed by this system can be influenced by changing the num-ber of iterations, changing the target alignment error and whether outliers should be included during the alignment or not.
Scanalyze
Scanalyze is a software distribution developed by Stanford’s Computer Graphics Laboratory (Stanford, 2005) that can use one of the variants of the pair-wise ICP algorithms described in (Rusinkiewicz and Levoy, 2001). This systems automatically fine aligns all meshes by changing the parameters of the global ICP algorithm while it iteratively aligns neighbouring meshes. Another way of using this system is by ap-plying pairwise ICP on manually selected overlapping
meshes and storing the corresponding samples for the global alignment, which allows the user to adjust more ICP settings. In this paper only the automatic fine alignment is considered.
The ICP settings predominate whether the rough aligned meshes are “correctly” fine aligned or not. During the fine alignment, convergence of the iter-ative process should be reached, so other stopping criteria are set to unreachable values.
To improve the results of the fine alignment it is best to perform the fine alignment twice using different settings. The first time, the fine alignment should have little restrictions on the mesh pair selection. This way we ensure that the pairwise ICP algorithm is applied even on poorly aligned meshes and their neighbouring meshes. The second run should have more restrictions on the mesh pair selection, because mesh pairs that barely overlap (less than 30%) can have a negative influence on the total alignment error of the model.
3.7. Merging
The aligned meshes are merged using the tools de-scribed below. When the original meshes contain no noise (which is the case for the synthetic meshes) the merged model will consist of a single mesh. But, most of the noise in the meshes from the physical objects will become separated from the object’s surface dur-ing the mergdur-ing of the meshes, which results in small patches “floating” around this surface. These patches are removed and only the final merged model is re-tained.
MeshMerge
MeshMerge (VCLab, 2005) is a tool that merges the meshes based on the volumetric approach.MeshMerge
stores the locations of intersection between the meshes and the reference voxel grid. The distances between these intersections are used during the merging pro-cess instead of the distances of meshes within the voxel grid. This wayMeshMergereduces the computational costs during merging (Rocchini et al., 2004). This tool has many parameters that can be set concerning its voxel grid, distance field and smoothing steps, that all effect the final result. In this paper, we only adjust the resolution of the voxel grid.
RapidForm
RapidForm provides two kinds of merge tools, one is surface zippering based and the other is based on the volumetric approach.
The volumetric approach is applied using two differ-ent resolutions for its voxel grid. One resolution ap-proximates the scan resolution (0.37×0.37 mm) and the other has a resolution which is two times higher (0.185×0.185 mm).
Fig. 5. The reference models of the UU-memento and the pierrot.
4. EVALUATION
The evaluation is performed using reference models. For the physical objects this means we have to cre-ate these reference models first. Those models should have a high level of accuracy and may not introduce a bias in the evaluation process. Therefore, the UU-memento and the pierrot were covered with a very thin layer of mat white paint first, to improve the ac-curacy of the range scans. A mat white surface is gen-erally believed to be the most suited surface for scan-ning using a laser range scanner. Then, the objects were scanned using a different laser range scanner, theMinolta Vivid 910. This way the bias of the refer-ence model towards a particular tool is reduced. The reconstruction of the 3D models was performed us-ingMeshAlignand MeshMerge. Finally, we used two post-processing toolsEasy3DEdit(VCLab, 2005) and
RapidFormto turn each merged model into one clean manifold surface mesh without holes or degeneracies. The final reference models of theUU-mementoand the
pierrotare shown in figure 5 and will also be available in the AIM@SHAPE shape repository (AIM@SHAPE Repository, 2005).
For the evaluation a tool calledMetro(VCLab, 2005) is used.Metrois a mesh comparison tool that is able to compare two 3D models of not necessarily connected meshes by the use of vertex, edge and/or face samples. For the sample points (p) from the first model (M1),
Metrodetermines the minimal Euclidean distance (d) to the second model (M2) and computes:
e(p, M) =minp0∈Md(p, p0) Ehd(M1, M2) =maxp∈M1e(p, M2) Emean(M1, M2) = 1 |M1| Z M1 e(p, M2)dM
in which Ehd represents the directed Hausdorff
dis-tance, which equals the maximum distance value for all samples. These distance measures are also deter-mined for samples from the second model to the first.
(a) MeshAlign (b) RapidForm (c) Scanalyze Fig. 6. The accurate alignment results of thearmadillousing a different colour for each mesh. The colour distribution of the face shows a small difference in performance.
During the alignment and merging of the meshes the model can slightly rotate and translate. To compen-sate this, two compared models are fine aligned before comparison. Then the performance of the tools with respect to the range scans are measured by comparing the aligned model and the merged model with their reference model.
The aligned model is a set of meshes with intersecting and overlapping faces while the vertices still represent all data obtained during the scan process. Therefore, we measure the distance of the aligned model with respect to the reference model using vertex sampling and one direction only to determine the alignment accuracy.
For the merged models we use the default settings ofMetro, which will haveMetro select an amount of samples equal to ten times the number of faces of the model. The selected samples include all vertices, but also samples from edge and samples from the face us-ing the similar triangles samplus-ing technique.
5. RESULTS 5.1. Alignment
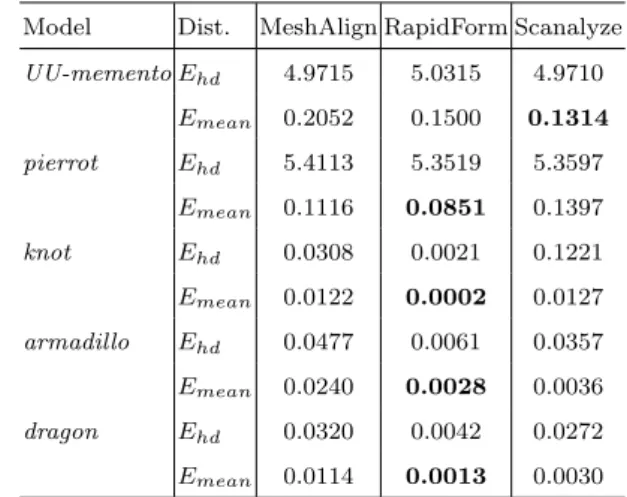
Results of the alignment of the range scans made from the objects are shown in table 2. The values in this table are the alignment error of each tool based on the minimal distances from the samples of thealigned model to itsreference model. For the real objects the directed Hausdorff distance is dominated by noise. Therefore, we will perform the comparison based on the mean errors only. The minimal mean distance ob-tained for a particular object is shown in bold. These results show thatRapidFormperforms best in case of the synthetic objects and thepierrot, but that Scana-lyzeobtains a better alignment for theUU-memento. Note that, although the mean errors of the alignments may differ a factor ten for the mean error, all tools perform a good alignment.
Snapshots of the accurate alignments of thearmadillo
are shown in figure 6. In this figure, each aligned mesh in shown using a different colour. Because these meshes contain no noise, an even distribution of colours is representative for a better alignment.
Model Dist. MeshAlign RapidForm Scanalyze UU-mementoEhd 4.9715 5.0315 4.9710 Emean 0.2052 0.1500 0.1314 pierrot Ehd 5.4113 5.3519 5.3597 Emean 0.1116 0.0851 0.1397 knot Ehd 0.0308 0.0021 0.1221 Emean 0.0122 0.0002 0.0127 armadillo Ehd 0.0477 0.0061 0.0357 Emean 0.0240 0.0028 0.0036 dragon Ehd 0.0320 0.0042 0.0272 Emean 0.0114 0.0013 0.0030 Table 2
Error (in mm) of samples from thealigned model to its refer-ence model.
5.2. Merging
The mean of the minimal distances from the from the samples of the merged model to its reference model
are shown in table 3. For each object, the merging is performed for all available alignments. In Italic the best merging technique for a particular alignment are highlighted. The best combination of alignment and merging for a particular object are marked in bold. Results from this table show that:
(i) the mean error of themerged model decreases, when the mean error of the alignment is lower. In other words, a more accurate alignment im-proves the final model.
(ii) a voxel grid with a higher resolution performs better in case of our synthetic objects.
(iii) a voxel grid with a lower resolution performs better in case of our physical objects.
(iv) In case of RapidForm, the volumetric merge shows often a better performance than surface zippering.
Now, we will look at two particular features of the fi-nal merged models: the ear of the armadilloand the emblem of theUU-memento. The ear is selected for its high curvature features and the emblem for its high level of detail and relief. For the input of the merging tools we only use the alignment created with Rapid-Form.
The results for the ear are shown in figure 7. Notice that MeshMerge creates a thick brim along the ear, which becomes smaller if a higher resolution voxel grid is used. Different parameter settings for this tool might improve these results. The results for the sur-face zippering ofRapidFormwas not able to construct the entire surface of the era and shows a large hole in-stead. The results ofRapidForm’svolumetric merges show high similarity with thereferenceear, except for some small holes.
In case of the noisy emblem, the results of Mesh-Mergetogether with the result for the lowest resolu-tion voxel grid ofRapidFormshow the most accurate
Model MeshMerge RapidForm alignment Volume Volume Volume Volume Surface
low res. high res. low res. high res. -UU-memento -MeshAlign 0.237 0.325 0.287 0.288 0.270 -RapidForm 0.138 0.136 0.124 0.134 0.135 -Scanalyze 0.105 0.104 0.089 0.101 0.113 pierrot -MeshAlign 0.083 0.083 0.089 0.099 0.088 -RapidForm 0.049 0.050 0.055 0.067 0.061 -Scanalyze 0.112 0.112 0.118 0.127 0.118 knot -MeshAlign 0.051 0.022 0.021 0.017 0.022 -RapidForm 0.045 0.016 0.015 0.011 0.015 -Scanalyze 0.048 0.022 0.020 0.017 0.022 armadillo -MeshAlign 0.040 0.030 0.030 0.028 0.036 -RapidForm 0.026 0.013 0.016 0.012 0.015 -Scanalyze 0.027 0.015 0.017 0.014 0.018 dragon -MeshAlign 0.023 0.016 0.016 0.015 0.019 -RapidForm 0.017 0.008 0.009 0.007 0.010 -Scanalyze 0.018 0.010 0.011 0.009 0.012 Table 3
Mean error (in mm) of samples from themerged model to its reference model. For the volumetric merge a low resolution voxel grid (0.37×0.37 mm) and a high resolution voxel grid (0.185×0.185 mm) were used.
reconstructions of the emblem. TheRapidForm’s vol-umetric reconstruction using a higher resolution grid shows many small holes and especially surface zipper-ing is not capable of dealzipper-ing with this amount of noise.
6. CONCLUSIONS AND FUTURE WORK
Most alignment and merging methods are based on heuristics, like the ICP algorithm for the alignment. Such methods are generally believed to work well, but it makes sense to quantify the relative performance of several systems and tools.
The alignment results based on synthetic range scans shows a high accuracy for all alignment tools, with
RapidForm as the system with the most accurate alignments. This is a good indication for that fact that an ICP based algorithm requires a comprehen-sive search for the optimal parameter settings with respect to its accuracy. The results obtained using
RapidForm may be useful as a lower bound of the alignment error for finding parameter settings that optimize the performance of MeshAlign and
Scana-(a) reference (b) RF aligned
(c) MM 0.37 (d) MM 0.185
(e) RF 0.37 (f) RF 0.185 (g) RF surf Fig. 7. Snapshots from the ear of thearmadillousing Rapid-Form (RF) and MeshMerge (MM).
(a) reference (b) RF aligned
(c) MM 0.37 (d) MM 0.185
(e) RF 0.37 (f) RF 0.185 (g) RF surf Fig. 8. Snapshots of the emblem of the UU-memento using RapidForm (RF) and MeshMerge (MM).
lyze. For the alignments based on laser range scans, the results show no favorite tool.
The evaluation of the merged models, show that even a very small improvement of the alignment results in an improvement of the merged model. This evaluation also shows that increasing the resolution of the voxel grid that is used by the volumetric merge technique will not always result in an improved accuracy of the final reconstructed model. Apparently, this improve-ment is bounded by the precision of the scanning de-vice.
differ-ent variants of the volumetric merge approach based on a distance field can have a very different output for slanted edges, even if the merged meshes do not con-tain noise. For a high detailed surface with much noise, volumetric approaches show better performance with respect to the noise reduction and hole filling than the surface zippering approach ofRapidForm.
As future work, we will perform a more comprehen-sive research in each of the processes of the scanning pipeline. Increasing the number of object, laser range scanners and reconstruction tools will give a better overview of the current state of the 3D model recon-struction tools. Even though the heuristics seem to work well within this entire process, there is no guar-antee on their performance. A promising research di-rection is to develop techniques that are guaranteed to have a performance depending on input parameters such as scanning resolution and surface curvature.
ACKNOWLEDGEMENTS
This research was supported by the FW6 IST Net-work of Excellence 506766 AIM@SHAPE. The UU-memento statue is copyrighted by Artihove Art Centre, Bergschenhoek (www.artihove.nl) and artist Maarten Benschop.
REFERENCES
AIM@SHAPE Repository, April 2005. FW6 IST Network of Excellence 506766. More info on http://www.aim-at-shape.net:10080/.
Callieri, M., Cignoni, P., Ganovelli, F., Montani, C., Pingi, P., R., S., 2003. VCLab’s tools for 3D range data processing. In: 4th Int. Symposium on Virtual Reality, Archaeology and Intelligent Cultural Her-itage (VAST2003). pp. 9–18.
Chen, C.-S., Hung, Y.-P., Cheng, J.-B., 1999. RANSAC-based DARCES: a new approach to fast automatic registration of partially overlapping range images. IEEE Trans. Pattern Analysis and Machine Intelligence (PAMI) 21 (11), 1229–1234. Cheng, J., Don, H., 1991. A graph matching approach
to 3-D point correspondences. Int. Journal of Pat-tern Recognition and Artificial Intelligence 5 (3), 399–412.
Chua, C., Jarvis, R., 1997. Point signatures: A new representation for 3D object recognition. Int. Jour-nal of Computer Vision 25 (1), 63–85.
Chung, D., Yun, I., Lee, S., 1998. Registration of multiple-range views using the reverse-calibration technique. Pattern Recognition 31 (4), 457–464. Cignoni, P., Rocchini, C., Scopigno, R., 1998. Metro:
measuring error on simplified surfaces. Computer Graphics Forum 17 (2), 167–174.
Curless, B., Levoy, M., 1996. A volumetric method for building complex models from range images. In: Proc. Computer Graphics (SIGGRAPH 96). pp. 303–312.
Higuchi, K., Hebert, M., Ikeuchi, K., 1995. Building 3-D models from unregistered range images. CVGIP-GMIP 57 (4), 315–333.
INUS Tech., April 2005. RapidForm 2004 PP2, the standard software for 3D scanners. More info on http://www.rapidform.com.
Johnson, A., 1997. Spin images: A representation for 3-D surface matching. Ph.D. thesis, Carnegie Mel-lon University, Pittsburgh.
Neugebauer, P., 1997. Reconstruction of real-world objects via simultaneous registration and robust combination of multiple range images. Int. Journal of Shape Modeling 3 (1-2), 71–90.
Pulli, K., 1999. Multiview registration for large data sets. In: Proc. 2nd Int. Conf. on 3D Digital Imaging and Modeling (3DIM). pp. 160–168.
Rocchini, C., Cignoni, P., Ganovelli, F., Montani, C., Pingi, P., Scopigno, R., 2004. The marching inter-sections algorithm for merging range images. The Visual Computer 20 (2-3), 149–164.
Rusinkiewicz, S., Levoy, M., 2001. Efficient variants of the ICP algorithm. In: Proc. 3rd Int. Conf. on 3-D 3-Digital Imaging and Modeling (33-DIM). pp. 145– 152.
Stanford, April 2005. Stanford Computer
Graphics Laboratory. More info on
http://graphics.stanford/.
Turk, G., Levoy, M., 1994. Zippered polygon meshes from range images. In: Proc. Computer Graphics (SIGGRAPH 94). pp. 311–318.
VCLab, April 2005. ISTI-CNR Visual Computing Laboratory. Meshalign v.2 and Meshmerge. More info on http://vcg.isti.cnr.it/.
Wyngaerd, J., Gool, L., Proesmans, M., 1999. Invariant-based registration of surface patches. In: IEEE Int. Conf. on Computer Vision. pp. 301–306.