A Comparison of Syslog and IS-IS
for Network Failure Analysis
Daniel Turner, Kirill Levchenko, Stefan Savage, and Alex C. Snoeren
{djturner, klevchen, savage, snoeren}@cs.ucsd.edu
Department of Computer Science and Engineering University of California, San Diego
ABSTRACT
Accurate reporting and analysis of network failures has historically required instrumentation (e.g., dedicated tracing of routing proto-col state) that is rarely available in practice. In previous work, our group has proposed that a combination of common data sources could be substituted instead. In particular, by opportunistically stitching together data from router configuration logs and syslog messages, we demonstrated that a granular picture of network fail-ures could be resolved and verified with human trouble tickets. In this paper, we more fully evaluate the fidelity of this approach, by comparing with high-quality “ground truth” data derived from an analysis of contemporaneous IS-IS routing protocol messages. We identify areas of agreement and disparity between these data sources, as well as potential ways to correct disparities when pos-sible.
Categories and Subject Descriptors
C.2.3 [Computer-Communication Networks]: Network Opera-tions
Keywords
Measurement; Reliability; Syslog; IS-IS
1.
INTRODUCTION
Reliability and availability are among the most important quali-ties of a network and must be ensured both through careful design (e.g., deploying physically redundant devices and logically toler-ant protocols to mask failures) and diligent operational practices (e.g., responding to failures that cannot be masked). To inform such efforts, there is broad interest in tracking network failures, their durations and their causes. Unfortunately, the Internet archi-tecture does not include comprehensive failure measurement as a first-class capability and thus failure analysis inevitably involves pressing a range of other tools into this service: syslog, routing protocol monitoring, SNMP, human trouble tickets, active probes and so on. However, it is not well understood how these different
Permission to make digital or hard copies of all or part of this work for personal or classroom use is granted without fee provided that copies are not made or distributed for profit or commercial advantage and that copies bear this notice and the full cita-tion on the first page. Copyrights for components of this work owned by others than ACM must be honored. Abstracting with credit is permitted. To copy otherwise, or re-publish, to post on servers or to redistribute to lists, requires prior specific permission and/or a fee. Request permissions from [email protected].
IMC’13,October 23–25, 2013, Barcelona, Spain. Copyright 2013 ACM 978-1-4503-1953-9/13/10 ...$15.00. http://dx.doi.org/10.1145/2504730.2504766.
techniques differ in their ability to capture and characterize avail-ability failures.
In previous work we developed a methodology to analyze net-work failures based upon readily available router log messages (i.e., syslog) and used it to analyze over five years of failure events in the CENIC regional network [17]. Our original study used oper-ator e-mails and active probing as sources of ground truth to val-idate the results of our method. However, both data sources pro-vide only sparse coverage of the failures identified in our study and their own fidelity is known to be imperfect as well (e.g., op-erators do not record short-lived failures in trouble tickets). The “gold standard” for identifying downtime is via high-fidelity logs of link-state router messages. Configuring and deploying an IGP listener to record such logs is neither technologically difficult nor novel [9]. However, an active listener carries the risk of disrupting network operations in the event of a catastrophic malfunction or compromise. As a result such datasets are rarely available in oper-ational networks and were not available when we first analyzed the CENIC network. Thus, in many cases, including our own previous work, network analysis is conducted using syslog data [4, 10, 14, 15, 21]. Worryingly, it remains unknown what sacrifices a syslog-based approach makes in terms of accuracy when compared to the ground truth revealed via routing protocol messages.
In this paper, we provide the first analysis of this trade-off by comparing the results of analyzing contemporaneous network-wide router syslog data and real-time ISIS routing protocol updates over a 13-month period in the CENIC network. We find significant dis-parities between the failure traces computed from the syslog and IS-IS data sources: the former does not capture 20% of the failures identified by the latter. Nevertheless, the statistical distribution of the failure traces is consistent for some metrics (e.g., failures per link and link downtime) but clearly distinct for others (e.g., failure duration). At a qualitative level, the importance of these differences depends greatly upon the use of the data: if an operator is merely attempting to identify aggregate link availability, syslog-based ap-proaches seem adequate. If, on the other hand, the analysis is being conducted in order to determine more involved metrics, like iden-tifying periods of complete isolation for portions of the network, higher fidelity data sources may be required.
In general, we find that syslog-based analyses provide reasonable approximations of those based upon routing protocol data, but with three important caveats:
1. Syslog frequently fails to accurately reflect link state during periods of flapping (i.e., rapid state transitions).
2. Long-lasting failures (e.g., over 24 hours) should be manu-ally verified as they are frequently false positives due to lost syslog messages.
3. Attempting to model link state over time through syslog oc-casionally results in nonsensical state changes (e.g., syslog reports that a currently operational link just came up). We find the best approach is to assume that the offending state change message is a spurious retransmission and leave the link state unmodified.
2.
RELATED WORK
A large number of efforts have attempted to quantify the amount, types, and causes of failure in wide-area networks. The vast major-ity of these studies follow a tomographic approach, where measure-ments collected at the edges of networks are used to infer the causes of disruptions in end-to-end traffic flow [1, 2, 3, 5, 6, 11, 18, 22]. It is well known, however, that such approaches are not as accurate as measurement from within the network itself [5].
Direct measurements are much more complicated and costly to obtain, resulting in a dearth of such studies. One general ap-proach taps into the interior gateway protocol (IGP) messages em-ployed by the network under consideration to monitor how the rout-ing protocol behaves, as route updates typically indicate connec-tivity changes. Two previous studies monitored OSPF networks: Shaikhet al.[16] studied OSPF behavior in a large enterprise net-work, and Watson, Jahanian and Labovitz [19] studied a network of fifty routers, including internal and customer links, over the course of one year. Markopoulouet al.[12], on the other hand, studied six months of IS-IS routing protocol messages collected from hundreds of nodes in the Sprint backbone. All of these studies, while valu-able in providing insight into the behavior of real networks, use methodologies and hardware that is often not practical for many network operators.
In contrast, in our own previous work, we considered whether lower-quality data sources, namely syslog and operator emails, could be used instead [17]. Others have used similar approaches: Gill et al. used syslog to analyze failures in a data center net-work [4]; Labovitz et al. combine SNMP queries with opera-tional logs to analyze failures in the backbone of a regional ser-vice provider [7], and Xuet al.parse syslog records to identify anomalies in data center operations [20]. While each of these ef-forts provided some form of validation against various forms of “ground truth,” none directly compare their results to a contempo-raneous study based upon IGP data. To the best of our knowledge, our study represents the first head-to-head comparison of the re-sults of high-fidelity IS-IS monitoring to “lower quality” methods that employ only syslog or data sources.
3.
BACKGROUND
Network failures can be categorized by many attributes including duration, cause, impact, and frequency. While no attribute is most important, some attributes are more relevant for particular purposes than others: a network engineer trying to improve reliability is likely to be concerned with cause and impact while a researcher developing a new routing protocol is likely to more interested in frequency and duration.
On the other hand, different actors have different resources avail-able to them, and some may not be avail-able to obtain the same quality of information with which to conduct their analyses. Ideally, anal-yses conducted with the most easily available data would be suffi-ciently accurate to be suitable for all purposes. Clearly such data sources are unlikely to provide exact failure-for-failure account-ing; we seek to understand which—if any—statistical properties are similar, and to what degree.
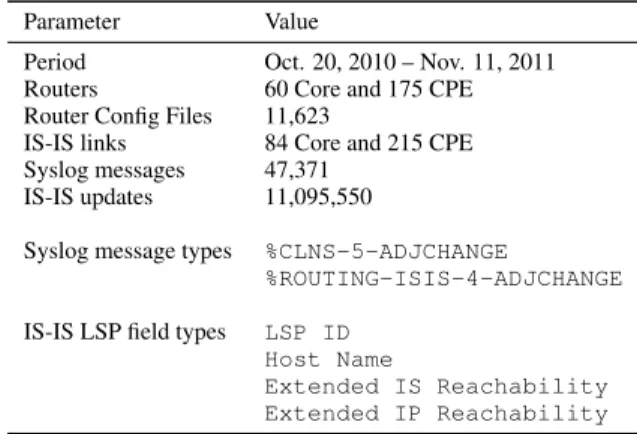
Table 1: Summary of data used in the study.
Parameter Value
Period Oct. 20, 2010 – Nov. 11, 2011 Routers 60 Core and 175 CPE Router Config Files 11,623
IS-IS links 84 Core and 215 CPE Syslog messages 47,371
IS-IS updates 11,095,550
Syslog message types %CLNS-5-ADJCHANGE
%ROUTING-ISIS-4-ADJCHANGE
IS-IS LSP field types LSP ID Host Name
Extended IS Reachability Extended IP Reachability
Before delving into the details of our findings, this section pro-vides basic information about CENIC, the network that forms the basis of our study, as well as the various data sources and methods used in our analysis.
3.1
CENIC
CENIC is a regional ISP in California that provides network connectivity to over 120 non-profit educational institutions. The CENIC network consists of 60 backbone routers connected by 10 GBit/s links as well as 175 routers on customer premises. We re-fer to the former asCorerouters and the latter asCPE(customer premises equipment) routers. The network uses the IS-IS routing protocol on the Core and CPE devices, organized as a single IS-IS network, described next. (A more detailed description of CENIC’s topology and structure is available elsewhere [17].)
3.2
IS-IS
The routing state of a network is commonly regarded as ground truth because if the routing protocol (IS-IS in the case of CENIC) declares a link is down, then for all practical intents and purposes it is down since no traffic will be directed to it. Similarly, if IS-IS de-clares a link to be up, then the link is at least capable of hearing and answering IS-IS “hello” packets, which is in most cases evidence enough that a link is functioning.
We capture CENIC routing state using a server running a lightly-modified version of Richard Mortier’s Python Routing Toolkit [13] to act as a router participating in the IS-IS network. Since IS-IS is a link-state routing protocol each router periodically floods its current adjacencies to the rest of the network in a link state packet (LSP). Adjacencies correspond to physical links between routers; it is possible for neighboring routers to have more than one adjacency. Each LSP advertisement is encoded as a series of type/length/value (TLV) fields. Table 1 lists the TLV fields we use. The first field,LSP ID, is the unique OSI identifier for each router. The second field,Host Name, is a human readable hostname. TheExtended IS Reachabilityfield contains a list of tuples. Each tuple contains the OSI identifier for a device directly connected to the router as well as the link weight (routing metric); larger weights are less preferred paths. These weights are configured by operators.
In addition to router adjacencies, LSPs also contain information about which IP networks are directly reachable from the router. IP Reachabilityis derived from interfaces that are config-ured with IP addresses and from statically configconfig-ured information. The set of IP ranges known to IS-IS does not include customer
ad-dresses, which are handled by BGP. Therefore, almost all of the subnets advertised are those of the point-to-point links that make up the CENIC backbone and links to CPE devices.
For every LSP we receive we first extract the sender’s OSI ID. If this is the first LSP from the sender we record its host name in our mapping of OSI IDs to hostnames and record its IS-IS neigh-bors and IP reachability. Subsequently, for each new LSP received from the node, we compare the advertised IS-IS adjacencies and IP reachability to adjacencies and IP reachability advertised previ-ously. If any new adjacencies or IP space has been formed or lost we attempt to determine, with the help of the mined configuration files, to which link(s) this adjacency or IP space corresponds.
3.3
Syslog
Network operators often use syslog [8] to obtain diagnostic in-formation. Its popularity is likely do to its ability to expose a wealth of diagnostic in human-readable text strings and ease of configura-tion. Syslog messages are nothing more than plain text strings that are transmitted via UDP to a central logging server. The convention followed by the Cisco routers in our study ensures that each syslog message has a similar format: timestamp, name of router and pro-cess generating the message, and specific diagnostic message.
Every router in the CENIC network is configured to send syslog messages to a central logging facility. We were provided access to the subset of these messages that pertain to the link, link protocol, and IS-IS routing protocol of the router. (Table 1 lists statistics about the syslog data.) Because syslog messages are transmitted via UDP and the syslog process runs with low priority, message generation and delivery is far from certain.
3.4
Matching
Our goal is to determine the relative accuracy of historical rout-ing state, i.e., periods of link up and downtime, extracted from sys-log messages. In particular, we seek to compare the failures ex-tracted from syslog messages to those exex-tracted from IS-IS LSPs. Making such a comparison requires the ability to extract failures from both data sources, find a common naming convention, and have a precise definition of when two failures are a match.
Determining a link’s state via syslog is straightforward. A link transitions states whenever a syslog packet says such a transition has occurred. However, we do observe cases where we receive two down state transitions without an intervening up transition and vice versa. We consider the state of the link between two down/up state transitions to be ambiguous. (In contrast, in our previous work we removed such events from the data set [17].)
Determining a link’s state according to IS-IS is similar. A link is in the “up” state as long as the adjacency or IP space is listed in the appropriate LSP packets, e.g. “down” transitions occur when a previously listed adjacency or IP space is no longer advertised and “up” transition occurs when it is re-advertised.
Syslog and IS-IS LSPs use different naming conventions (host-names vs. OSI IDs). To overcome the inability to directly compare router names in LSPs and syslog messages we de-velop a simple method to map both to a common naming con-vention, alink: (host name 1:port on host 1, host name 2:port on host 2). In order to perform this mapping we determine all of the links in the network by mining an archive of configuration files.
We consider an IS-IS failure event (i.e., a down transition fol-lowed by an up transition) and a syslog failure event to be matched if both are on the same link, their start times are within ten seconds, and their end times are within ten seconds. We choose a window size of ten seconds because there is a clear knee at ten seconds
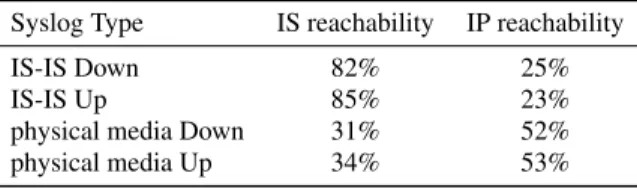
Table 2: Percentage of state transitions matching syslog messages by IS or IP reachability of IS-IS LSP messages
Syslog Type IS reachability IP reachability
IS-IS Down 82% 25%
IS-IS Up 85% 23%
physical media Down 31% 52%
physical media Up 34% 53%
when examining the graph of window size to percent of downtime matched (omitted for space). We also find it useful to compare transitions individually; state transitions are similarly considered to match if they occur with ten seconds of each other on the same link.
IS reachability vs. IP reachability IS-IS LSPs contain two fields that can be used to infer link state: IS reachability and IP reachabil-ity. We therefore have to choose which of the two fields two use. If we choose to use the IS reachability field there is a limitation that it is not always possible to differentiate between one or multiple physical links between two routers1. In the CENIC network, 26 device pairs have such multi-link adjacencies. We omit multi-link adjacencies from our analysis because, unlike all other links in the network, their state is actually function ofn-physical links.
Router interfaces that form links in the CENIC network are given IP addresses in unique /31 subnets. This means that the IP reacha-bility field can uniquely identify every link. As a result it initially appears that using IP reachability to determine link state would be superior since it does not ignore 20% of all links.
Table 2 shows what percentage of all state changes, as observed by either IS or IP reachability, match syslog state state changes that refer to IS-IS connectivity or the status of the underlying physical media. The IS reachability matches three times more syslog state transitions than IP reachability and we expect syslog to reasonably reflect ground truth. Therefore, even though IS reachability is blind to 20% of physical links it is still preferable to using IP reachability field to detect link state changes.
At the same time, IP reachability matches 20% more physical media state changes than IS reachability. Hence, we conclude that IP reachability reflects physical media state. Therefore, IP reacha-bility must be formed in order for IS reachareacha-bility to be established, but it is not sufficient to establish IS reachability. Hence, we con-sider state changes only from IS reachability for the remainder of this paper.
4.
COMPARATIVE ANALYSIS
Our comparison of syslog to IS-IS is intended to be both de-scriptive and prede-scriptive. Ideally, syslog would provide failure-for-failure accounting and thus be usable for any purpose. How-ever, in Section 4.1 we show that there is significant disagreement in state transitions. As a result, there is a bias in metrics having to do with link failures. Section 4.2 shows that some statistical proper-ties are preserved, however. Section 4.3 shows how to filter the data to remove false positives and short failure bias in order to maximize the utility of syslog-based analyses. Finally, in Section 4.4 we look at a high-level metric, customer availability, as one real-world use case.
1
RFC 5305 provides an extension to the IS-IS protocol to enable differentiation in IP networks, but it is not running on most devices in the CENIC network.
Table 3: Number of IS-IS state transitions by type (UPorDOWN) and number of Sylog messages matching.
IS-IS Router Syslog messages
transition
None One Both
DOWN 2,022 18% 4,512 39% 4,962 43%
UP 1,696 15% 5,432 48% 4,168 37%
4.1
Analyzing Link State Changes
We begin by examining the accuracy of state transitions since it is simple and straightforward. Moreover, if such a fine-grained measure were accurate, all higher-level metrics would also be ac-curate.
During the 13-month measurement period, our IS-IS listener recorded 22,792 adjacency state transitions: 11,496 withdrawing a previously advertised adjacency, and 11,296 introducing a new adjacency. We refer to the former as aDOWNevent, and the latter as anUPevent, the two events together constituting afailure.
Under ideal conditions, each link failure would manifest itself in syslog as a pair of messages—one from each router on either end of the link—reporting the adjacency status change (DOWN) at the start of a failure, and another pair of messages at the end of the failure (UP). Under less than ideal conditions, some or all of these four messages may be lost.
Using the procedure described in Section 3.4, we attempt to match each syslog message (generated by the router’s IS-IS pro-cess) to an IS-IS listener-reported event. Syslog-reported IS-IS adjacency “Down” messages are matched toDOWNevents, “Up” messages toUPevents.
Table 3 shows the results of the matching. The DOWN and
UProws show the number of IS-IS listener-reported transitions with the number of Syslog-reported “Down” and “Up” messages matched to each. In theNonecolumn are transitions with no match-ing Syslog messages, in theOnecolumn are transitions where only one router sent a matching message, and in theBothcolumn are transitions where both routers sent matching Syslog messages.
The majority ofUPtransitions are captured by syslog: only 15% do not have a matching syslog message from either router. The ma-jority of DOWN transitions are also matched, but a slightly larger fraction—18%—are missed. The majority of unmatched transi-tions, 67% for DOWN and 61% for UP, occur during periods of link flapping. Further investigation shows that than less than half of all syslog state transitions are matched during periods of link flapping. In keeping with previous work we consider two or more consecu-tive failures on the same link separated by less than 10 minutes part of a flapping episode [17]. We therefore conclude that syslog does not accurately describe link state during flapping.
4.2
Analyzing Link Failures
Network operators are typically concerned with metrics like link downtime that are calculated from individual link failure events. This is concerning because our failure reconstruction methodology relies on a DOWN and UP state transition to make a failure. Thus if more than 15% of DOWN as well as UP transitions do not match IS-IS, it is possible that a syslog-based analysis might miss more than 30% of all failures. We find, however, that the unmatched state transitions predominately impact syslog’s ability to capture short failures and have limited impact on most statistical properties.
The results of performing failure reconstruction and sanitation are presented in Table 4. Sanitization consists of removing
fail-Table 4: Number and hours of downtime as reported by IS-IS and syslog after basic data cleaning was performed.
IS-IS Syslog Overlap Failure Count 11,213 11,738 9,298 Downtime (Hours) 3,648 2,714 2,331
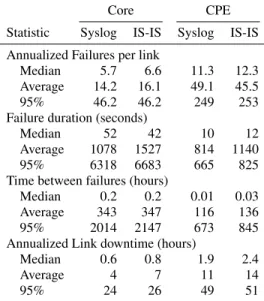
Table 5: Statistics for syslog-inferred failures and IS-IS listener-reported failures.
Core CPE
Statistic Syslog IS-IS Syslog IS-IS Annualized Failures per link
Median 5.7 6.6 11.3 12.3
Average 14.2 16.1 49.1 45.5
95% 46.2 46.2 249 253
Failure duration (seconds)
Median 52 42 10 12
Average 1078 1527 814 1140
95% 6318 6683 665 825
Time between failures (hours)
Median 0.2 0.2 0.01 0.03
Average 343 347 116 136
95% 2014 2147 673 845
Annualized Link downtime (hours)
Median 0.6 0.8 1.9 2.4
Average 4 7 11 14
95% 24 26 49 51
ures that span periods when the IS-IS listener was offline as well as manually verifying the 25 syslog failures that lasted more than 24 hours. Manual verification primarily consists of cross-checking failures with network trouble tickets. Since one of the primary pur-poses of network trouble tickets is to document network events, we can reasonably expect (very) long lasting failures to be chronicled. While manual verification of long failures is time consuming, it is also critical since doing so removes 6,000 hours of spurious down-time which is almost twice the number of actual downdown-time hours.
At first glance, concern about lost syslog messages appears un-founded since syslog reports 500 (5%) more failures than IS-IS. However, syslog reports 934 fewer hours of downtime, 25% less than IS-IS. Moreover, 20% of all individual failure instances (not shown) are false positives, i.e., they do not appear in IS-IS.
Table 5 shows key statistics for the syslog failure reconstruction technique and for IS-IS listener-reported failures. The numbers are given in annualized form by normalizing the number of failures to link lifetime. Here we break down the data according to whether the link in question belongs to the network backbone (Core) or is connected to an edge router on the customer premises (CPE). We present results for Core and CPE links separately since their differ-ent use, equipmdiffer-ent types, and importance, suggests that they will have different statistics. The median number of failures per link is lower by about one per year in syslog-inferred data than in IS-IS listener data in both cases.
Core failure durations are higher using syslog data—52 seconds versus 42 seconds. With CPE links, it is the opposite. Median fail-ure duration is 10 seconds for syslog-reconstructed failfail-ures, and 12 seconds for IS-IS listener-reported failures. This unusual reversal of syslog-inferred and IS-IS-reported data is most evident in the annualized link downtime. The median Core link downtime is 36
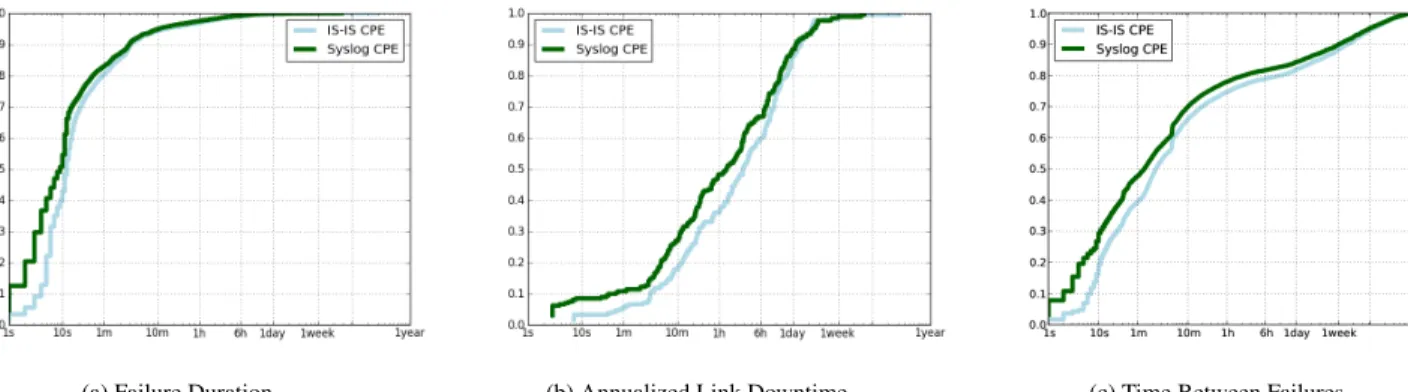
(a) Failure Duration (b) Annualized Link Downtime (c) Time Between Failures
Figure 1: Syslog-inferred and IS-IS listener-reported cumulative distributions for CPE links.
minutes per year using syslog data, and 48 minutes per year using IS-IS listener data. On the other hand, for CPE links, IS-IS data gives a median link downtime of 2.4 hours, compared to 1.9 hours with syslog data.
To better illustrate these differences, Figure 1 shows the cumu-lative failure duration distribution, the cumucumu-lative annualized link downtime distribution, and the cumulative distribution of time be-tween failures for CPE links.
The IS-IS and Syslog distributions of failure duration for Core links track each other closely, with most of the differences at-tributable to short failures (less than 10 seconds): 1-second failures are more common in the IS-IS data, while 3-5 seconds failures are slightly more common in syslog data.
Among CPE links, Figure 1a , the differences between the two distributions arise in the relative frequencies of short-duration fail-ures. Syslog-inferred failures are more frequent in the 1-4 sec-ond range, while IS-IS listener-inferred failures are more preva-lent in the 5-7 second range. Ultimately, syslog contains more 1-second failures, which cause the discrepancy observed. One ex-planation for this finding is that syslog is capturing sub-second pseudo-failures that signal a connection reset, as we explore in Sec-tion 4.3.
From examining descriptive statistics and graphical plots, both syslog-inferred and IS-IS listener-reported failures exhibit simi-lar characteristics. The differences stem from certain classes of failures—most notably short failures—which are poorly captured by syslog. Moreover, when we compare distributions for good-ness of fit (using the two-tailed Kolmogorov-Smirnov statistic, or KS test) we find that syslog and IS-IS produce consistent data for failures per link as well as link downtime, but not failure duration.
Given that Syslog misses 20% of all failures and 25% of all downtime, it is not suitable for those who require failure-for-failure accounting. At the same time, our results indicate that using sys-log to determine link state information may be sufficient for those whose applications only require the reconstructed link state to have the same gross statistical properties as those directly reported by the IS-IS listener.
4.3
Syslog’s False Positives
Most of the statistical properties about failures reported by sys-log closely track those reported by IS-IS, but a few—like individual failure duration—do not. In this section we examine the causes and enumerate which data filtering mechanisms can be successfully ap-plied in an effort to increase the number of statistics syslog can accurately convey.
Table 6: Absolute count of ambiguous state changes by cause and state change direction.
Cause Down Up
Lost Message 194 174
Spurious Retransmission 240 28
Unknown 27 0
Total 461 202
When comparing syslog failures to IS-IS listener-reported fail-ures, we find that syslog reports 2,440 failures (21% of all syslog-reported failures) and 17.5 hours that were not observed by the IS-IS listener2. These failures are actually false positives, i.e. failures that seemingly did not impact traffic.
Short failures, ten seconds or less, make up 83% of all false pos-itives. These failures, however, lead to less than an hour of down-time. On the other hand, 94% of the false positive downtime be-longs to the remaining 373 failures. Interestingly, all but 19 failures greater than ten seconds—a full 15.1 hours worth of downtime— occur during periods of flapping, when a link fails multiple times in rapid succession.
False positives occur for a number of reasons. One issue, which produces very short duration false positives, one second or less, is an aborted IS-IS three-way handshake. A second issue which also causes very short failure, one second or less, is an adjacency being reset which often occurs immediately after a longer failure without an LSP being generated and, thus, is not seen by the IS-IS listener. A reset adjacency failure is differentiated from a subsequent link failure by the type of syslog message being sent. Further compli-cating the issue is the fact that, as highlighted in Section 4.1, syslog message generation reliability is significantly impacted during pe-riods of link flapping.
While there are many different causes of very short failures, we are aware of only one cause of long false positives. These occur when both an “Up” and then a subsequent “Down” message are lost such that two short failures become one long failure.
Ambiguous state changes
A failure in syslog is defined by a “Down” message followed by an “Up” message. However we find that there are 461 down messages that are preceded by an other down message and 202 up messages
2
Table 4 implies that Syslog has 383 hours of false positive down-time, however, 365.5 hours belong to failures that only partially overlap with failures seen by the IS-IS listener.
preceded by an up message. The link state between repeated mes-sages is ambiguous because we cannot determine if a message was lost or if the message was a spurious reminder of link state. In aggregate, these ambiguous periods between double down and up messages account for 7.8% of the measurement period across all links.
Testing if a double up/down has occurred due to a missing syslog message is straightforward with IS-IS data. A message has been lost if both syslog state change messages correspond to the correct state change as seen by IS-IS. We find that 42% of all double down periods are caused by a lost syslog up message while 86% of all double up periods are caused by a lost down message, see Table 6 . In total, lost packets explain 56% of all double up and down periods.
Next, we test if the remaining unexplained nonsensical state changes are due to spurious retransmission. To do this we check the remaining double down and up messages to see if they occurred while the link was in the same state. In fact 52% of all double down message—91% of those not explained by a lost syslog up—occur during a failure according to IS-IS and 14% of all double ups—all of those not explained by a lost syslog down—during up time. In-terestingly 99% of spurious down messages are reporting the same failure as the previously received state change message; this is true for only 48% of the double ups.
We now turn from investigating the causes of the nonsensical state transitions to how to correct for them. Previous work ignored the time periods between these transitions, but with the help of IS-IS control data as ground truth, we can explore better strategies. We believe there are three potential options: assume the link is down, assume the link is up, or assume the link is in the previous state. After examining the three strategies we find that assuming the link remains in the previous state pushes link downtime as seen by syslog closest to matching link downtime as seen by IS-IS.
4.4
Isolating Failures
The statistical similarity of individual failure events according to syslog and IS-IS is one thing, but many real-world metrics are aggregates of multiple events. Hence, any error in reconstruction has the potential to be magnified when focusing on a high-level metric, such as customer availability.
We highlight the amplification issue with regards to customer availability since CENIC’s primary value as an ISP is in provid-ing connectivity to its customers. Therefore, reliability is best gauged not from statics about individual network failures, but in-stead through customer availability. Because most customers are multi-homed and CENIC has rings in its topology, detecting con-nectivity losses require accurate state information about multiple links simultaneously.
CENIC advertises a single /16 block into BGP for all of its cus-tomers, so we cannot use BGP monitors to give us insight or con-firmation when a customer has been isolated. To determine when customers become isolated, we use the network topology (recon-structed from router configuration files) to identify the set of links that would isolate a customer.
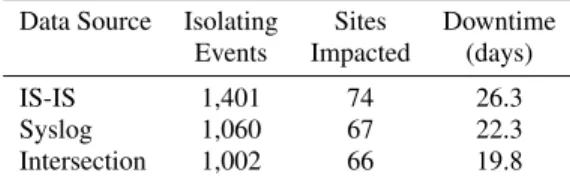
During our study period, there are 1,401 failure events observed by IS-IS that isolate a customer. Here an event is one or more overlapping link failures. These isolating events affect 74 distinct customers and result in a combined total of 26 days of isolation; see Table 7. In syslog-reconstructed failures, there are 1,060 distinct isolating events affecting 67 customer sites resulting in 22.4 days of downtime. Syslog-reconstructed failure events are not a perfect subset of IS-IS events, however: There are 58 events reported by syslog which are not observed in the IS-IS data.
Table 7: Number and duration of failures in which at least one CENIC customer was isolated from the backbone, as reconstructed from syslog and IS-IS.
Data Source Isolating Sites Downtime Events Impacted (days)
IS-IS 1,401 74 26.3
Syslog 1,060 67 22.3
Intersection 1,002 66 19.8
Of these 58 unmatched events, 12 have no IS-IS-reported failures on the affected links during the event, while the remaining 46 inter-sect (but do not match perfectly) some IS-IS failures on the affected links. There are also two particularly egregious “matches.” In one case a site is isolated for 7 hours; syslog, however, only detects the isolation nine seconds before the isolation ended. In a second case, syslog believes a site isolated for 17 hours; the site was actually isolated for less than one minute according to IS-IS.
There were 399 events—corresponding to 6.5 days of downtime—reported by IS-IS that did not match an event recon-structed from syslog. Of these, 82 were a result of syslog miss-ing a smiss-ingle state change message. These 82 events account for 2.1 days (32%) of downtime. Furthermore, 99 of the remaining missed isolating events partiallymatched a syslog-reconstructed event.3 These 99 events account for 0.7 days (11%) of downtime. The remaining 218 unmatched isolating events had no related (or potentially related) Syslog messages.
5.
CONCLUSION
This study represents the first attempt to compare the failure pat-terns reported by syslog-based analyses to those extracted through direct IGP monitoring. We find that there is significant disagree-ment between the two sources, with roughly one quarter of all events reported by one data source not appearing in the other. Clearly, IS-IS monitoring is more accurate, as traffic shares fate with the routing protocol. That said, our analysis indicates that sys-log’s omissions are heavily biased toward short failures, and that many of the larger statistical properties of the network obtained through analyzing syslog, e.g., annualized downtime, number of failures, and time to repair, are reasonably accurate. Still, one must be careful in drawing high-level conclusions; for example syslog has a significantly different view of customer isolation than that of IS-IS.
In sum, syslog-based analyses may be useful for capturing ag-gregate failure characteristics where IGP data is not available. It is less well suited to situations requiring more precise failure-for-failure accounting.
Acknowledgments
This work was supported in part by the UCSD Center for Net-worked Systems and the National Science Foundation through grant CNS-1116904. The authors would like to thank Brian Court, Darrell Newcomb, Jim Madden, Erick Sizelove, and our shepherd, Theophilus Benson, for their advice and suggestions.
6.
REFERENCES
[1] COATES, M., CASTRO, R.,ANDNOWAK, R. Maximum likelihood network topology identification from edge-based
3A partial event match occurs when an IS-IS and syslog failure
unicast measurements. InProceedings of ACM SIGMETRICS(June 2002).
[2] DHAMDHERE, A., TEIXEIRA, R., DOVROLIS, C.,AND
DIOT, C. NetDiagnoser: Troubleshooting network
unreachabilities using end-to-end probes and routing data. In
Proceedings of ACM CoNEXT(Dec. 2007).
[3] DUFFIELD, N. Network tomography of binary network performance characteristics.IEEE Transactions on Information Theory(Dec. 2006).
[4] GILL, P., JAIN, N.,ANDNAGAPPAN, N. Understanding network failures in data centers: Measurement, analysis, and implications. InProceedings of ACM SIGCOMM(Aug. 2011).
[5] HUANG, Y., FEAMSTER, N.,ANDTEIXEIRA, R. Practical issues with using network tomography for fault diagnosis.
Computer Communication Review(October 2008). [6] KOMPELLA, R. R., YATES, J., GREENBERG, A.,AND
SNOEREN, A. C. Detection and localization of network black holes. InProceedings of IEEE INFOCOM(May 2007). [7] LABOVITZ, C., AHUJA, A.,ANDJAHANIAN, F.
Experimental study of Internet stability and backbone failures. InProceedings of FTCS(June 1999).
[8] LONVICK, C. The BSD syslog protocol. RFC 3164, August 2001.
[9] MAHIMKAR, A., YATES, J., ZHANG, Y., SHAIKH, A., WANG, J., GE, Z.,ANDEE, C. T. Troubleshooting chronic conditions in large IP networks. InProceedings of ACM CoNEXT(Dec. 2008).
[10] MAHIMKAR, A. A., GE, Z., SHAIKH, A., WANG, J., YATES, J., ZHANG, Y.,ANDZHAO, Q. Towards automated performance diagnosis in a large iptv network. In
Proceedings of the ACM SIGCOMM(Aug. 2009). [11] MAO, Y., JAMJOOM, H., TAO, S.,ANDSMITH, J. M.
NetworkMD: Topology inference and failure diagnosis in the last mile. InProceedings of ACM IMC(Oct. 2007).
[12] MARKOPOULOU, A., IANNACCONE, G.,
BHATTACHARYYA, S., CHUAH, C.-N., GANJALI, Y.,AND
DIOT, C. Characterization of failures in an operational IP backbone network.Transactions on Networking(Aug. 2008). [13] MORTIER, R. PyRT: Python routeing toolkit.
https://github.com/mor1/pyrt.
[14] POTHARAJU, R.,ANDJAIN, N. An empirical analysis of intra- and inter-datacenter network failures for
geo-distributed services. InProceedings of ACM SIGMETRICS(June 2013).
[15] QIU, T., GE, Z., PEI, D., WANG, J.,ANDXU, J. What happened in my network: mining network events from router syslogs. InProceedings of ACM IMC(Nov. 2010).
[16] SHAIKH, A., ISETT, C., GREENBERG, A., ROUGHAN, M.,
ANDGOTTLIEB, J. A case study of OSPF behavior in a large enterprise network. InProceedings of ACM IMC(Nov. 2002).
[17] TURNER, D., LEVCHENKO, K., SNOEREN, A. C.,AND
SAVAGE, S. California fault lines: Understanding the causes and impact of network failures. InProceedings of ACM SIGCOMM(Aug. 2010).
[18] WANG, F., MAO, Z. M., WANG, J., GAO, L.,ANDBUSH, R. A measurement study on the impact of routing events on end-to-end Internet path performance. InProceedings of ACM SIGCOMM(Sept. 2006).
[19] WATSON, D., JAHANIAN, F.,ANDLABOVITZ, C. Experiences with monitoring OSPF on a regional service provider network. InProceedings IEEE ICDCS(2003). [20] XU, W., HUANG, L., FOX, A., PATERSON, D.,AND
JORDAN, M. Detecting large-scale system problems by mining console logs. InProceedings of ACM SOSP(Oct. 2009).
[21] YAMANISHI, K.,ANDMARUYAMA, Y. Dynamic syslog mining for network failure monitoring. InProceedings of ACM SIGKDD(Aug. 2005).
[22] ZHANG, M., ZHANG, C., PAI, V., PETERSON, L.,AND
WANG, R. PlanetSeer: Internet path failure monitoring and characterization in wide-area services. InProcedings of USENIX OSDI(Dec. 2004).