FOREIGN DIRECT INVESTMENT IN CHINA
By
XIAOBAO DANG
B.S., NORTH WESTERN UNIVERSITY (XI’AN CHINA), 2002
A REPORT
submitted in partial fulfillment of the requirements for the degree MASTER OF ARTS
Department of Economics College of Arts and Sciences
KANSAS STATE UNIVERSITY Manhattan, Kansas
2008
Approved by: Major Professor Yang-Ming Chang
Copyright
XIAOBAO DANG
ABSTRACT
China’s absorbing foreign direct investment (FDI) has contributed importantly to its economy growth. Based on the findings of some previous studies in the literature, this report presents a general review of FDI in China, which includes characteristic, history and regional distribution. In the report, I discuss various economic determinants of FDI (such as market size, labor cost, infrastructure, and government policies) and investigate the impact of FDI on China's economic growth. Furthermore, I discuss challenges, new trends and the future opportunities facing China.
iv
Table of Content
LIST OF TABLE ... VI
LIST OF CHART ... VII
CHAPTER 1 - INTRODUCTION ... 1
CHAPTER 2 - GENERAL BACKGROUND OF FDI INFLOWS IN CHINA ... 2
2.1OVERALL FDI TRENDS IN CHINA ... 2
2.2CHINA’S GOALS IN ATTRACTING AND UTILIZING FDI ... 7
2.3MAJOR FDI TYPES IN CHINA ... 8
2.3.1EQUITY JOINT VENTURE (EJV) ... 8
2.3.2CONTRACTUAL JOINT VENTURE (OR COOPERATIVE JOINT VENTURE,CJV) ... 9
2.3.3WHOLLY FOREIGN-OWNED ENTERPRISES (WFOE) ... 9
2.3.4SHARE COMPANY WITH FOREIGN INVESTMENT (SCFI)... 9
2.3.5JOINT EXPLORATION ... 10
2.4HISTORY OF FDI IN CHINA ... 11
2.4.1 Experiment Stage (1979 – 1983) ... 12
2.4.2 Growth Stage (1984 – 1991) ... 12
2.4.3 Peak Stage (1992 – 1993) ... 15
2.4.4 Adjustment Stage (1994 – 2000) ... 17
2.4.5 Post-WTO Stage (2001 – present) ... 17
2.5DISTRIBUTION OF FDI IN CHINA ... 19
CHAPTER 3 - SUMMARY OF THE ECONOMIC DETERMINANTS OF FDI IN CHINA ... 20
3.1CHINA’S MARKET SIZE AND ECONOMY GROWTH ... 20
3.2ABUNDANT LABOR SUPPLY AND LOWER LABOR COST ... 21
3.3INFRASTRUCTURE ... 22
3.4FAVORABLE POLICIES AND STABLE POLITICAL ENVIRONMENT ... 23
3.5OTHER DETERMINANTS ... 24
3.5.1. Scale effects ... 24
3.5.2 Shared culture environment ... 24
CHAPTER 4 - THE ROLE THAT FDI PLAYS IN AFFECTING CHINA'S TRADE AND ECONOMIC GROWTH ... 25
4.1THE IMPACT OF FDI INFLOWS ON DOMESTIC ECONOMY ... 25
4.2THE IMPACT OF FDI ON EMPLOYMENT OPPORTUNITIES ... 26
4.3THE IMPACT OF FDI ON TECHNOLOGY TRANSFORMATION ... 26
CHAPTER 5 - THE ROAD AHEAD: NEW TRENDS AND CHANGING SITUATION OF FDI IN CHINA ... 27
5.1SOME CURRENT ISSUES FOR EXPORT-ORIENTED INVESTMENT ... 27
5.1.1 The change of Exchange Rate ... 27
5.1.2 Increasing price of raw materials... 28
5.2FURTHER PROMOTE FOREIGN INVEST IN THE CENTRAL AND WESTERN REGIONS BY CHINESE GOVERNMENT. ... 29
5.3SOLVING ENVIRONMENTAL ISSUES WILL CREATE NEW OPPORTUNITIES FOR FDI ... 29
5.4CHINESE GOVERNMENT WILL FURTHER PERFECT THE ENVIRONMENT FOR INVESTMENT IN THE FUTURE ... 30
v
vi
LIST OF TABLE
Table 2.1: China FDI Inward from 1980 to 2006
Table 2.2: Industrial Outputs by Foreign Invested Enterprises (FIEs) as a Percentage of National Industrial Outputs
Table 2.3: FDI Inflows from the Ten Asian Countries as of 2006
Table 2.4: Top Eight FDI Investors in China as of 2006
Table 2.5: Cumulative FDI by different types Forms as of 2006
vii
LIST OF CHART
Chart 2.1: China’s total FDI inflows trends from 1980 to 2006
Chart 5.1: U.S. Dollar to Chinese Yuan Exchange Rate from Jan. 2005 to Aug. 2008
1
CHAPTER 1 - Introduction
China opened up the door to the world economy since 1979. China has experienced a dramatic change in its economy. Meanwhile, FDI inflows in China have been growing quite rapidly. By the end of 2006, total accumulated projects, contractual value and realized value of FDI in China had reached 594,445; 1497.9 billion USD and 703.9 billion USD, respectively (see Table 2.1). Now, China is the largest FDI host country among the developing world.
Obviously, FDI is one of the main factors to explain the growth of China’s economy in the past thirty years. But, who were the main investors? And how could China became so successful in attracting FDI? What roles did FDI play in the Chinese economy? Many studies have been focused on these topics. In this report, I seek to review and summarize major findings of several different studies in the literature.
The report is organized as follows: Section 2 provides a general review in terms of characteristic, history and distribution of FDI in China. The review includes (i) FDI trends, (ii) China’s goals in attracting and utilizing FDI, (iii) five major types of FDI, (iv) five development stages of FDI from 1979 to present, and (v) the regional distribution of FDI in China. Section 3 lays out various economic determinants of FDI in China: domestic market size, labor cost, quality of infrastructure, government policies and other factors, which could help to explain China’s success in attracting FDI from other countries. Section 4 discusses the role of FDI in affecting China's trade and economic growth.
2
Section 5 analyzes the current challenge, new trends and the future opportunities of FDI in China. Section 6 contains concluding remarks.
CHAPTER 2 - General background of FDI inflows in China
2.1 Overall FDI trends in China
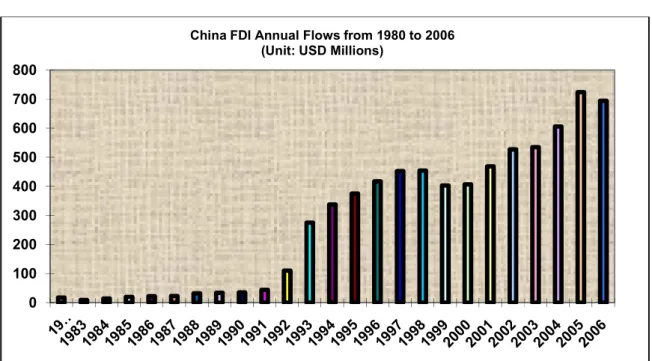
The trend of FDI flows to China could be separated into three distinct phases: From 1980 to 1992, the inflows increased relatively slowly. Then, FDI inflows started to grow quite rapidly. There must have been certain economic changes favorable for investments which we will cover later in this report. This upward trend has been interrupted since 1998. But, after 2000, it began to rise again until 2005. It reached its highest level in that year (see Chart 2.1).
3
Chart 2.1: China’s total FDI inflows trends from 1980 to 2006
Source: Foreign Investment Department of the Ministry of Commerce of China, 2007
In 2005, the number of FDI projects reached 44,019; the contractual value of FDI achieved $189 billion and the realized value of FDI increased to $72.4 billion. Details of these figures are shown in Table 2.1.
Table 2.1: China FDI Inward from 1980 to 2006
Unit: US $100 millions
year No. of projects Contractual value Realized Value
total 594,445 14,979.28 7,039.74 1979-1982 920 49.58 17.69 1983 638 19.17 9.16 1984 2,166 28.75 14.19 1985 3,073 63.33 19.56 1986 1,498 33.3 22.44 1987 2,233 37.09 23.14 1988 5,945 52.97 31.94 1989 5,779 56 33.93 1990 7,273 65.96 34.87 0 100 200 300 400 500 600 700 800
China FDI Annual Flows from 1980 to 2006 (Unit: USD Millions)
4 Table 2.1 Cont. 1991 12,978 119.77 43.66 1992 48,764 581.24 110.08 1993 83,437 1,114.36 275.15 1994 47,549 826.8 337.67 1995 37,011 912.82 375.21 1996 24,556 732.76 417.26 1997 21,001 510.03 452.57 1998 19,799 521.02 454.63 1999 16,918 412.23 403.19 2000 22,347 623.8 407.15 2001 26,140 691.95 468.78 2002 34,171 827.68 527.43 2003 41,081 1,150.70 535.05 2004 43,664 1,534.79 606.3 2005 44,019 1,890.65 724.06 2006 41,485 2,001.74 694.68
Source: Foreign Investment Department of the Ministry of Commerce of China, 2007
FDI has contributed to Chinese economy growth directly through the establishment of Foreign Invested Enterprises (FIEs). The industrial outputs by FIEs became major part of national industrial outputs. (Table. 2.2)
Table 2.2: Industrial Outputs by Foreign Invested Enterprises (FIEs) as a Percentage of National Industrial Outputs
Unit: RMB 100 million
Year National Industrial Outputs Industrial Outputs by FIEs Share (%)
1990 19,701.04 448.95 2.28
1991 23,135.56 1,223.32 5.29
5 Table 2.2 Cont. 1993 40,513.68 3,704.35 9.15 1994 76,867.25 8,649.39 11.26 1995 91,963.28 13,154.16 14.31 1996 99,595.55 15,077.53 15.14 1997 56,149.70 10,427.00 18.57 1998 58,195.23 14,162.00 24 1999 63,775.24 17,696.00 27.75 2000 73,964.94 23,145.59 22.51 2001 94,751.78 26,515.66 28.05 2002 1,011,198.73 33,771.09 33.37 2003 128,306.14 46,019.55 35.87 2004 187,220.66 58,847.08 31.43 2005 249,625.00 78,399.40 31.41 2006 315,630.14 99,420.83 31.5
Source: Foreign Investment Department of the Ministry of Commerce of China, 2007
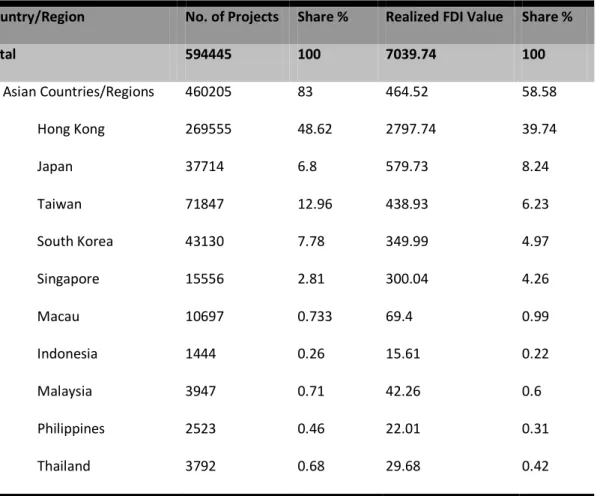
An interesting question is: who were the main investors? Apparently, the ten countries/regions in Asia, namely, Hong Kong, Macau, Taiwan, Japan, Philippines, Thailand, Malaysia, Singapore, Indonesia and South Korea, remained the main source of FDI inflows. (See Table 2.3)
By the end of 2006, the ten Asian countries/regions invested in a total of 460,205 projects, accounting for 83% total FDI projects, and reached a total realized value of US$46.45 billion in China, accounting for 58.58% of total FDI realized value in China.
6
Table 2.3: FDI Inflows from the Ten Asian Countries as of 2006
Unit: US$ 100 million
Country/Region No. of Projects Share % Realized FDI Value Share %
Total 594445 100 7039.74 100 10 Asian Countries/Regions 460205 83 464.52 58.58 Hong Kong 269555 48.62 2797.74 39.74 Japan 37714 6.8 579.73 8.24 Taiwan 71847 12.96 438.93 6.23 South Korea 43130 7.78 349.99 4.97 Singapore 15556 2.81 300.04 4.26 Macau 10697 0.733 69.4 0.99 Indonesia 1444 0.26 15.61 0.22 Malaysia 3947 0.71 42.26 0.6 Philippines 2523 0.46 22.01 0.31 Thailand 3792 0.68 29.68 0.42
Source: Foreign Investment Department of the Ministry of Commerce of China, 2007
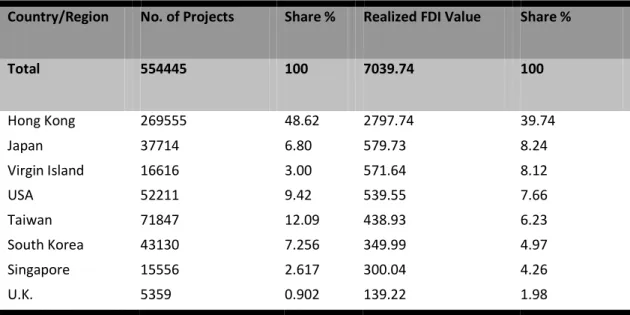
The top eight countries/ investing in China by the end of 2006, in order of realized investment, are: Hong Kong (US$279.77 billion), Japan (US$57.97 billion), the Virgin Islands (US$57.16 billion), USA (US$53.95 billion), Taiwan (US$43.89 billion). (See Table 2.4)
7
Table 2.4: Top Eight Investors in China as of 2006
Unit: US$ 100 million
Country/Region No. of Projects Share % Realized FDI Value Share %
Total 554445 100 7039.74 100 Hong Kong 269555 48.62 2797.74 39.74 Japan 37714 6.80 579.73 8.24 Virgin Island 16616 3.00 571.64 8.12 USA 52211 9.42 539.55 7.66 Taiwan 71847 12.09 438.93 6.23 South Korea 43130 7.256 349.99 4.97 Singapore 15556 2.617 300.04 4.26 U.K. 5359 0.902 139.22 1.98
Source: Foreign Investment Department of the Ministry of Commerce of China, 2007
2.2 China’s goals in attracting and utilizing FDI
Although China’s orientation and targets of using FDI might have adjusted to its development needs in different stages, its main purposes can be described as below (Yuan, 2005):
1. Having based its economy heavily on agriculture, China intended to use FDI to boost its development of industries, including building up transportation infrastructure, exploring energy and processing raw materials.
2. With the aspiration of establishing local research and development centers, China
would move into the technology-intensive fields, such as electronic information, bioengineer, new materials, aviation and aerospace.
8
3. China would also like to transform its traditional industries, such as machinery, textile and consumption goods manufacturing, with the new technologies and modern management systems brought in by foreign investors.
4. The deteriorating pollution draws China’s attention to environmental protection projects and forces it to raise efficiency of utilizing raw and renewable materials and energy.
5. China also likes to enlarge its exports and strengthen its connection to the rest of the world via export-oriented FDI. As the gap between China’s coastal and inner cities grows, it is also China’s intention to direct FDI to the country’s western region to build up industries there.
2.3 Major FDI types in China
Yuan (2005) illustrated that there are five major types of FDI in China, namely, (i) Equity Joint Venture (EJV), (ii) Contractual Joint Venture (or Cooperative Joint Venture, CJV) Cooperative Enterprises, (iii) wholly foreign-owned enterprises (WFOE), (iv) Share Company with Foreign Investment (SCFI) and (v) Joint exploration. The definition of each type is as below:
2.3.1 Equity Joint Venture (EJV)
An EJV refers to company with limited liability, whose equity and management are shared between foreign investors and Chinese sides in accordance to their equity shares. EJV used to dominate the forms of FDI in China, as shown in Table 2.5. China’s Joint
9
Venture Law and its Amendment Provisions set the percentage of a joint venture’s capital contributed by a foreign investor between 25 percent and 99 percent.
2.3.2 Contractual Joint Venture (or Cooperative Joint Venture, CJV)
As indicated by its name, a CJV is established with a preset arrangement between foreign investors and their Chinese counterparts. The arrangement lays down the terms and conditions as stipulated in the venture contracts. It also clarifies the liabilities, rights and obligations of each cooperative side. Grub and Lin (1991) discussed in their research that different from those in EJVs, the investors in CJVs do not assume the risk or receive profits in accordance to their respective capital shares but rather the risks and profits are preset in the venture agreement
2.3.3 Wholly foreign-owned enterprises (WFOE)
Obviously, a WFOE is an enterprises founded entirely by a foreign company with its own capital. Hence the risks, gains and losses of a WFOE are absorbed by the firm itself. This type of enterprise is under the coverage of the Law on Enterprises Operated Exclusively with Foreign Capital (1986) and its Enforcement Regulations (1988). The number of WFOEs gradually caught up with EJVs and CJVs from late 1990s when China further relaxed its restraints on FDI.
2.3.4 Share Company with Foreign Investment (SCFI)
SCFI is a stock limited company established by foreign companies, enterprises, or other economic organizations with their Chinese counterparts. The company is set up
10
according to the principle of stock. The specific responsibilities assumed by each stockholder depends on the amount of stocks he/she purchases.
2.3.5 Joint exploration
Joint exploration often pertains to natural resources such as oil. It is characterized with features of both CJVs and compensation trade. Its risk and output are distributed according to agreed shares, which resemble CJVs. This type of FDI offers China access to advanced equipment and technical assistance from foreign companies. The foreign investors, in return, receive a portion of the output.
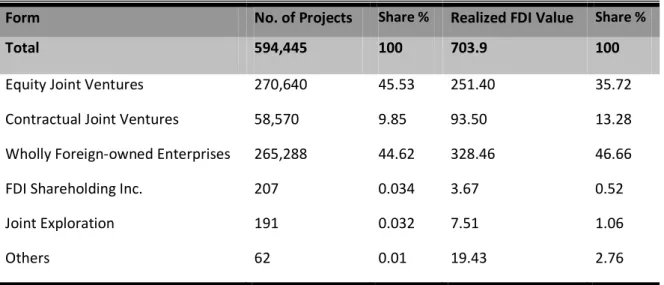
From Table 2.5, we can see that EJVs and WFOEs are the most important types of FDI, which accounted for 90% of the total FDI projects and 82.38% of total FDI realized value in China by the end of 2006.
Table 2.5: Cumulative FDI by different types as of 2006
Unit: US $ Billions
Form No. of Projects Share % Realized FDI Value Share %
Total 594,445 100 703.9 100
Equity Joint Ventures 270,640 45.53 251.40 35.72
Contractual Joint Ventures 58,570 9.85 93.50 13.28
Wholly Foreign-owned Enterprises 265,288 44.62 328.46 46.66
FDI Shareholding Inc. 207 0.034 3.67 0.52
Joint Exploration 191 0.032 7.51 1.06
Others 62 0.01 19.43 2.76
11
As pointed out by Wei (2002), there are two reasons for EJVs to become popular in China. First, the Chinese government believes that EJVs best serve the Chinese objective of absorbing foreign capital, technology, and management expertise. Second, foreign investors hope that by engaging in joint ventures, the local partners may assist in penetrating the domestic markets and accessing utilities and critical inputs. Also, Deng (2001) notes that many foreign investors in China have chosen WFOEs over EJVs in order to avoid the problems associated with EJVs, mostly caused by uncooperative or incompetent partners, differences in strategic objectives between partners, and the fear of loss of control over proprietary technology and know-how and a loss of long-term competitive advantages.
2.4 History of FDI in China
FDI in China can be traced back to the 1950s, during which time the major source was Soviet Union. However, it was not until 1978 that China began to open up itself to the rest of the world and embrace FDI inflows in a gradual manner. The year of 1978 witnessed China’s departure from its self-reliance strategies since Mao’s era with the country announcing a dramatic program to reform its economic system and open up to the outside world. Starting from 1978, FDI in China became desirable and began to contribute its due share to the development of the Chinese economy. In general, the development of FDI in China can be divided into five stages.
12 2.4.1 Experiment Stage (1979 – 1983)
The Chinese government started from an experimental approach, which they called “crossing the river by feeling the stones under the water.” FDI was permitted into China in a step-by-step manner. One key action of the first step was the establishment of four Special Economic Zones (SEZs), namely Shen Zhen, Shan Tou, Zhu Hai and Xia Men, in July 1981. These SEZs were designated for the absorption and utilization of foreign investment. They provided foreign investors with preferential treatment for their businesses. As China’s “window to the world”, these zones not only succeeded in attracting FDI but also served as a buffer for those who were afraid that foreign investment might cause bourgeois spiritual pollution. Meanwhile, China was catching up with the effort to complete its legislative system. The first of its kind, the Equity Joint Venture Law (the Law of People’s Republic of China on Joint Ventures Using Chinese and
Foreign Investment) was enacted in July 1979. The legislation both validated the existence of FDI in China and guaranteed the right and benefits of foreign investors. Another important policy initiative taken at this stage included Regulation for the Implementation of the Law of the People’s Republic of china on Chinese –foreign Equity
Joint Ventures (1983).
2.4.2 Growth Stage (1984 – 1991)
There were surely flaws in China’s handling FDI in the previous stage. Up to 1982, China’s restraints on FDI outside the SEZs remained rigid. Laws and regulations limited foreign ownership and their domestic sales. FDI projects often encountered a long and
13
drawn out approval process even though they provided sufficient materials and explanation. The lengthy process to approve FDI projects was simplified gradually but steadily between 1983 and 1985. Below is the list of new laws and regulations at this stage.
- Wholly Owned Subsidiaries (WOS) Law (1986)
- Provision for the FDI Encouragement (1986)
- Constitutional Status of Foreign invested Enterprises in Chinese Civil Law (1986)
- Adoption of Interim provision on guiding FDI (1987)
- Delegation on approval of selected FDI projects to more local governments (1988)
- Laws of cooperative joint ventures (1988)
- Revision of equity joint venture law (1990)
- Rules for implementation of WOS law (1990)
- Income tax law and its rules for implementation (1991)
The year of 1984 witnessed two historic activities. In the spring of that year, Deng Xiaoping remarked that China needed to open wider instead of checking upon the opening process (Zheng, 1984). In the fall, the Chinese government announced the “decision on reform of the economic structure”, and called for the building of a “socialist commodity economy” by assigning a larger role to the market in the domestic economic system (People’s Daily, October 21, 1984). Also impressed by the success of FDI in SEZs, the Chinese government took a further step to give FDI access to other parts of the country besides SEZs. In 1984, fourteen coastal cities were announced to be opened to the outside world. They are Dalian, Qinhuangdao, Tianjin, Yantai, Qingdao, Lianyungang,
14
Nantong, Shanghai, Ningbo, Wenzhou, Fuzhou, Guangzhou, Zhanjiang and Beihai. Compared to SEZs, these cities enjoyed more autonomy in making economic decisions. The local government s could approve FDI projects with capital investment up to certain level. For example, Shanghai could approve all FDI projects under 30 million USD (Yuan, 2005). They were also given the right to reserve and spend foreign exchange yielded by local FDI for their own growth. The approval procedures and processes for FDI projects were also greatly simplified.
The Law of People’s Republic of China on Wholly Foreign-owned Enterprises (WFOEs), published on April 12, 1986, provides for the protection for the profits and interest of foreign investors when they founded WFOEs in China. A series of other laws and regulations further relaxed China’s restriction in promoting FDI with measures for enterprise autonomy, profit remittances, labor recruitment and land use.
In 1987, China made Hainan, its second largest island, the biggest SEZ and a separate province (Before that, Hainan belonged to Guangdong province). Meanwhile, more parts of China, including the Yangtze River Delta surrounding Shanghai, the Pearl River Delta surrounding Guangzhou, the Southern Fujian Triangle, and the Liaoning and Shandong peninsulas, were designated to FDI. These areas received much of the preferential treatment as in SEZs and fourteen open coastal cities.
Also in this stage, the possibility of bringing in foreign management in foreign invested enterprises (FIEs) was considered and discussed. The practice was regarded not to weaken state sovereignty but to help “shake off the fetters of the old system and
15
promote strict management” (“Premier Zhao Zi Yang on the coastal areas” Development Strategy, Beijing Review, 8-14 February 1988).
In December 1990, the central government promulgated “Detailed Rules and Regulations for the Implementation of the People’s Republic of China Concerning Joint Ventures with Chinese and Foreign Investment.” The regulation aimed to encourage joint ventures that adopted advanced technology or equipments, saved energy and raw materials and upgraded products.
2.4.3 Peak Stage (1992 – 1993)
This stage witnessed the rise of Shanghai as China’s economic center with the opening up of Pudong New Area. The Chinese government sought to develop Shanghai into an international hub for finance, economy and trade. It was also the intention to carry out the experiment of new policies and apply successful practices within the rest of Shanghai and across the country (Financial Times, 1991; Financial Times Survey: China, April 24, 1991). With Shanghai’s location in Southeast China, the move signaled the Chinese government’s shifting emphasis to the area to avoid overly concentration of FDI in South China. Hi-tech enterprises, established manufacturers and financial companies were encouraged to set up their China operation at Pudong with various preferential treatments from central and local government.
Deng Xiaoping’s historic tour of the South in early 1992 and his remarks on the necessity to roll out more radical economic reforms had brought China’s open-up and FDI development to a new and higher stage. With the implementation of a new framework
16
for further opening up the economy, the Chinese government showed great effort to encourage export-oriented and Foreign Invested Enterprises (FIEs) with advanced technologies. A number of new sectors were also opened up to foreign investors, including wholesaling and retailing, accounting and information consultancy, banking and insurance. At the same time, governmental procedures were simplified in terms of FDI administration. China was also seeking to direct FDI into the country’s inner regions where there were less developed and industrialized.
The year of 1992 witnessed the remarkable growth of FDI in China. In September of that year, the Chinese government announced its intention to adopt the strategy of “socialist market economy” and improve the economic framework for standard market operations. A series of laws and regulations related to market operations were passed during 1992 and 1993, which included:
- Adoption of Trade Union Law (1992)
- Company Law (1993)
- Provision regulations of value-added tax, consumption tax, business tax and
enterprise income tax (1993)
As we can see in Chart 2.1 and Table 2.1, these initiatives proved effective as the pledged FDI in 1992 increased sharply by 385%. The value amounted $58.1 billion in total. The realized FDI manifested an exceptional growth of 152%, adding up to $11 billion, which equaled to the total amount of year 1989, 1990 and 1991. In 1993, the pledged FDI was valued at $110.9 billion, more than the cumulative amount over the past fourteen years. The amount reached $25.8 billion.
17 2.4.4 Adjustment Stage (1994 – 2000)
From 1994, the growth rate of FDI in China went down to a stable level from the relatively high rate in past two years, which indicated that a new stage had arrived. We see from Table 2.1 and Chart 2.1 that the contract value of FDI inflows increased from 82.68 billions USD in 1994 to 91.28 billions USD in 1995, and fell to 73.27 billions in 1996.
The Chinese government began to guide FDI to meet its goals set for economic development. According to the 1995 Provisional Guidelines for Foreign Investment Projects, enterprises in various industries were provided with different preferential treatment. The guiding directory of the Guidelines categorized all the FDI projects into four types: encouraged, restricted, prohibited and permitted (Yuan, 2005). The projects in infrastructure or underdeveloped agriculture and with advanced technology or manufacturing under-supplied new equipment to satisfy market demand fell into the first category. Those whose production exceeded domestic demand and those who engaged in the exploration of rare and valuable resources were treated as restricted. The third category included projects that would jeopardize national security or public interest, or those using sizeable amounts of arable land, or those endangering military facilities and so on. The rest projects are classified as permitted. Annual utilization of FDI reached to its peak in 1997 and 1998 but then trended downward in the following two years.
2.4.5 Post-WTO Stage (2001 – present)
On November 11, 2001, China became an official member of the World Trade Organization (WTO), after a 15-year negotiation marathon. Upon its accession to WTO,
18
China started to fulfill its obligation such as basic principles of non-discrimination, pro-trade, pro-competition and so on. In return, China also began to enjoy the privileges as a member of the WTO family. This historic event also exerted signification impact on FDI inflows to China.
Accession to WTO gives incentives to more export-oriented FDI. China’s export market becomes larger and more predictable. China’s export gains protection from opposing measures. In the opposite, China’s domestic market attracts FDI in industries where there is large market potential. Typically, these industries used to be dominated by relatively inefficient state-owned enterprises, such as telecommunication, banking and insurance. Foreign investors, especially large multinational companies, have increasing interest in these industries.
Becoming a WTO member bestows upon China the opportunity to further its economic reforms and restructure its legal framework. This, in consequence, improves China’s business environment and helps attract more foreign investment.
According to Yuan (2006), throughout the years, China has gradually reduced its industrial tariffs in a wide range of sectors and areas. More encouragingly to FDI, foreign firms are granted direct trading rights for the first time in the history, which means they can import and export themselves without going through a Chinese state-owned trading firm as the middleman. Reducing tariffs may decrease the incentives for some foreign investors to choose China to void possible high tariffs in other countries or areas, but China’s acquiring WTO membership boosts investors’ confidence in the Chinese economy and its market and thus attracts more FDI inflows.
19
2.5 Distribution of FDI in China
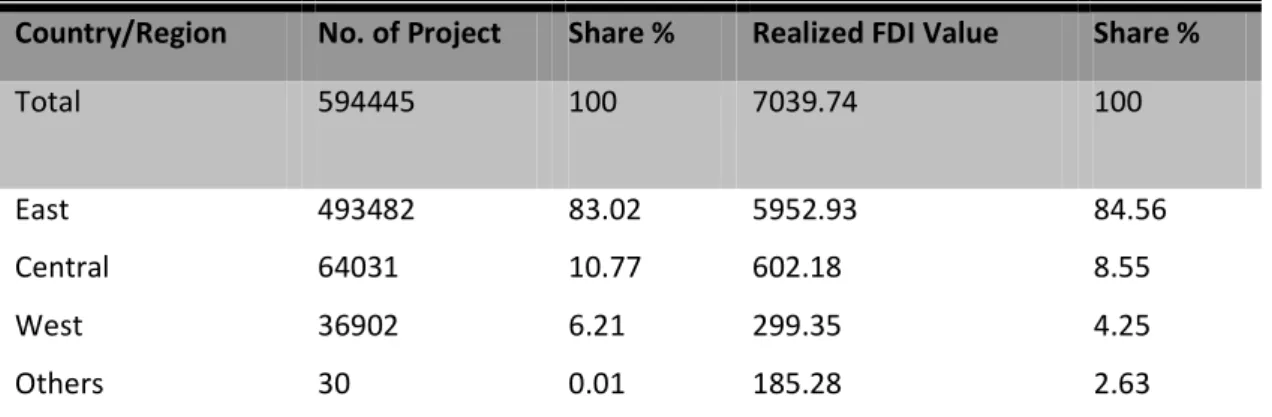
Almost every study on FDI in China would point out the unbalanced distribution of foreign investment across the country. China’s thirty-one provinces were divided into three regions: east area, central area, and west area. Wei (2004) explains that the reason for the division into regions is primarily to compare the regional difference and dynamic changes in attracting FDI inflows.
Table 2.6 shows basic information on the number of projects and realized value of FDI among the three regions as of 2006. The FDI inflows are concentrated highly along the coast line of East China, especially in the southeast regions. Among these coastal provinces and cities, Fujian, Shanghai, Jiangsu and Guangdong are the hosts to a major share of FDI. Guangdong, in particular, has been a leading destination of foreign investment consistently throughout the years. However, these recent years have witnessed the gap of FDI inflows between Guangdong and other coastal provinces narrowing. As for regional distribution, the East, with an FDI percentage of 84.56%, absorbed most part of foreign investment; while the Central and the West made up 8.55% and 4.25% respectively in the national total of accumulated foreign investment.
The analysis of determinants of region differences in attracting FDI is presented in Section 3.
20
Table 2.6: FDI Utilized by East, Central and West Parts of China as of 2006
Unit: US$ 100 million
Country/Region No. of Project Share % Realized FDI Value Share %
Total 594445 100 7039.74 100
East 493482 83.02 5952.93 84.56
Central 64031 10.77 602.18 8.55
West 36902 6.21 299.35 4.25
Others 30 0.01 185.28 2.63
Eastern region: Beijing, Tianjin, Hebei, Liaoning, Shanghai, Jiangsu, Zhejiang, Fujian, Shandong, Guangdong, Hainan
Central region: Shanxi, Jilin, Heilongjiang, Anhui, Jiangxi, Henan, Hubei ,Hunan
Western region: Inner Mongolia, Guangxi, Sichuan, Chongqing, Guizhou, Yunnan, Shaanxi, Gansu, Qinghai, Ningxia, Xinjiang, Tibet
Source: Foreign Investment Department of the Ministry of Commerce of China 2007.
CHAPTER 3 - Summary of the economic determinants of FDI
in China
3.1 China’s market size and economy growth
With the largest population in the world and the fastest growing economy, China manifests increasingly large demand and expanding market for domestic consumption. So, the FDIs from Europe and USA which are mostly market-oriented investment are
21
attracted by China’s huge potential markets. They set up factories and firms to produce and serve for China’s domestic markets.
In the past empirical studies, market size was found to be a significant and positive determinant of FDI. There are some theories and hypotheses underlying this finding. Shapiro (1998) pointed out that looking for the new market is one of the motivations of FDI. The larger the market size of a particular province, other things being constant, the more FDI the province should attract. Cheng and Kwan (2002), Liu et al. (1997), Tseng and Zebregs (2002) and Zhang (1999) indicate in their research that both at the national and the provincial level, empirical studies have found a strong positive correlation between GDP and FDI inflows in China. Meanwhile, they indicate that market size has been more important as a determinant of FDI from Europe and USA than for FDI from
Hong Kong and Taiwan, as the latter tend be more export-oriented. Besidesthese, Sun,
et al. (2002) contend that the market demand and market size have exerted positive impact on attracting FDI because they directly affect the expected revenue of the investment.
3.2 Abundant labor supply and lower labor cost
During the past 30 years, even now, China is widely referred to as a “World Factory” or “labor-intensive manufacturing country”. China took advantage of the world largest population with cheap labor to attract foreign investment since 1979. Hence, foreign investors found investment to China in order to lower their manufacturing cost. As
22
Moore (1993) confirmed that the lower the labor cost in the host country, the more attractive the host country, the lower wage is a significant determinant of FDI in China.
In previous empirical studies, Chen (1996), Cheng and Kwan (2000), Head and Rise (1996), and Liu et al. (1997) pointed out there is a positive relationship between lower wage and FDI. It means the lower wage in China; the higher will be inward FDI in China.
In the recent years of fast economic development, however, China attracts foreign investment not exclusively through cheap labor. As reflected in the model of Branstetter and Feenstra (1999), multinational firms in China tend to pay a wage premium to their workers. This may be because multinational firms desire to hire quality workers. The higher wage may well reflect higher labor productively. Hence, it is conceivable that wages in those provinces that can attract relatively more FDIs can be higher, too. A negative relationship between lower wages and higher FDI inflows also has been indicated by many previous studies. Sun, et al (2002) provided evidence to show that the wage is positively related to FDI before 1991 but negatively related with FDI since then. In addition, Lipsey (1999) indicated that there is no evidence to support that low wages, associated with low per capital real income, were the main attraction for FDI.
3.3 Infrastructure
Infrastructure is also one of the important determinants of FDI. The construction of Chinese infrastructure has been improved greatly in the past 30 years. The infrastructure in transportation, communication, and the supply of water, electricity and natural gas has been almost completed in the coastal area. The ability of supply and
23
quality of energies, raw materials and components has been improved obviously, which provides foreign investors with excellent external conditions in production and operation. Cheng and Kwan (2000) and Head and Ries (1996) provide evidence that provinces in China with more developed infrastructure have tended to receive more FDI.
Going back to Section 2, I think the main cause of uneven distribution of FDI in China is the developed infrastructure in the coastal area. To prove the positive impact of infrastructure for FDI, Wei (2002) discussed a dummy variable of coastal regions and the non-coastal regions to analyze relationship with FDI. A consistent finding of these studies is that foreign firms have a significant preference for investing in the coastal provinces. This is not surprising, as the coastal regions are characterized by the low information cost areas and firms were able to enjoy preferential treatment during China's early experimentation with FDI.
3.4 Favorable policies and stable political environment
Favorite government policy has been found to be effective in attracting foreign
investors (Janeba, 1995;Shapior and Globerman, 2003).
Tax incentives were most important factors, included income tax exemption, reduction, tariff-free during 1980 to 1993. From 1994, government used the same tax system for domestic and FDI firms. But in order to encourage more FDI and international trade, a five-year tax refund program was allowed, and tariff-free treatment was extended. For high-technology or export-oriented enterprises, the foreign investor may receive a full refund. Beside these, as I mentioned in Section 2, Chinese
24
government has improved the legal system for absorbing foreign investment and maintained on the steadiness, consistency, predictability and feasibility of the policies and laws of foreign investment.
3.5 Other determinants
3.5.1. Scale effects
Observations made by Tseng and Zebregs (2002) indicated the importance of “scale effects” for the increase in FDI. They pointed out the greater the amount of investment, the greater the confidence of others to invest. For example, in Guangdong, Fujian, Zhejiang and other parts of the east area, economies of scale make investors share information and facilities, like schools, bank services, and hospital. Also, in these areas, the economy chain and transportation is quite extensive and convenient.
3.5.2 Shared culture environment
Tseng and Zebregs (2002) argue that China’s success in attracting FDI is unique because of the large Chinese Diaspora. The fact that Hong Kong, Tai Wan and Singapore, have accounted for more than half of the FDI flows to China (See Table 2.4) is usually used to support this argument. Zhang (2002) also indicates that investors from these areas prefer to invest in mainland China, because they could share the cultural background rather than comparative wage rates within China. For non-Chinese investors, they have to overcome culture barriers, like language, which may imply a cost.
25
CHAPTER 4 - The role that FDI plays in affecting China's trade and
economic growth
4.1 The impact of FDI inflows on Domestic Economy
China has succeeded in attracting tremendous FDIs, and foreign firms are the most important part of this for the Chinese economy. Zebregs (2001) indicates that FDI flows to China have contributed to GDP growth in several ways: one is that FDI has raised GDP growth by adding to capital formation; another is FDI has contributed to higher GDP growth through its positive effect on total factor productivity. In addition, Tseng and Zebregs (2002) found that FDI has contributed to GDP growth directly through the establishment of FIEs and indirectly by creating positive spillover effects from FIEs to domestic enterprises.
Lemoine (1998) shows that FDIs are now major players in China’s international trade. This situation is the result of China’s policy towards FDI which has strongly encouraged export-oriented activities. Lardy (2000) observed that the growth of China’s trade has been four and a half times that of world trade, and China’s share of world trade quadrupled form 0.9 percent in 1978 to 3.7 percent in 2000.
Chen (1999) and Zhang and Song (2000) concluded that FDI has a positive and significant impact on provincial export performance. Tseng and Zebregs (2002) further point out that FIEs played a key role in this achievement. Between 1985 and 1999, the share of exported accounted for by FIEs grew from 1 percent to 45 percent. FIEs
26
accounted for half of overall export growth and one-third of import growth during this period.
4.2 The impact of FDI on employment opportunities
Without question, FDI created employment opportunities through the FIEs. Banerjee (2006) noted that the FDI firms’ urban employment was particularly concentrated in the eastern region provinces (85.76% of the total) and more particularly in Guangdong, Fujian, Jiangsu, Shandong, Liaoning and Zhejiang, and some capital city, like Shanghai, Beijing and Tianjin. In contrast, FDI firm’s urban employment in the central and the western regions made up for only 11.15% and 3.09% of FDI firms’ total urban employment in China, respectively. This suggests that FDI may have contributed to widening the income gap between the eastern and western regions of China.
4.3 The impact of FDI on Technology Transformation
Some surveys have been conducted over the last several years. The results from these surveys indicate that technology transfer from FDI was relative low, even though the Chinese government regarded FDI as a way of technology transformation. Chen et al. (1995) shared that the technology transfer from FDI was relative low, and argued that FDI’s less than satisfactory contribution to high technology transfer to China is partially explained by the fact that China relied on Hong Kong and Taiwan as its principal source of FDI. Yong and Lan (1997), based on a case study in the coastal city of Dalian, found some reasons why the technology transformation from FDI is low. First, many investors were not genuine sources of technology. Second, local partners had distorted motives
27
and restricted absorptive capabilities. Third, moderate technology gap, an incomplete technology package and the dominant inflow of hardware hamper advanced technology transfer. Fourth, most direct technology transfer was conducted in EJVs but there was only a small difference between the technology gap and technology transferability in many EJVs. Besides these, Li and Yeung (1999) also obtained the same result by conducting case study of Shanghai Volkswagen Automotive Company and Shanghai Bell Telephone Equipment Manufacturing Company. They reported that there were inter-firm technology transfer and knowledge spillovers in both cases. Wei (2002) found that there was only evidence of low and intermediate technology transfers, mainly from Hong Kong and Taiwan.
CHAPTER 5 - The Road ahead: New trends and changing situation
of FDI in China
5.1 Some current issues for export-oriented investment
5.1.1 The change of Exchange Rate
The real exchange rate is assumed to function mainly through the effect of altering relative production (Yuan 2006). When the real exchange rate goes up, foreign firms usually experience higher production costs and they would like to relocate their domestic production facilities to a country where there are lower production costs, i.e., China.
However, by the end of June, 2008, the exchange rate was 1 USD to 6.82 RMB, and RMB cumulatively appreciate over 18.5% to US dollars since July 2005 (Chart 5.1).
28
Hence, the appreciation of Chinese Yuan to US dollars directly hurts export-oriented firms’ profit.
Chart 5.1 U.S. Dollar to Chinese Yuan Exchange Rate from Jan. 2005 to Aug. 2008
Source: yahoo finance: http://finance.yahoo.com/currency/convert?from=USD&to=CNY&amt=1&t=5y
5.1.2 Increasing price of raw materials
Increasing the price of raw materials pushes up the cost of production in China. The crude oil price in the international markets reached new record high in May of this year. These situations lead to the increase of production cost. Some of the manufacturers have to seek for renew their production technologies to save material, while go after new supplies of raw materials in the international market. However, many small manufacturers who mostly rely on Original Equipment Manufacturing (OEM) are forced out of business under the pressure of escalating production cost. Taking the small copper-processing enterprises as an example, in the recent two years, quite a few of them went out of business. In addition, the Chinese government keeps adjusting the
29
tax refund of export of certain industries. As of June, 2008, some of the adjustment was 10% less, such as from 15% to 5%. It even cancelled the tax refund concerning some export goods. All these changes resulted in decreased profits for manufacturers.
5.2 Further promote foreign invest in the central and western regions by
Chinese government.
Back to the Table 2.6, because of uneven regional distribution of FDI across the country, the central and western areas of China just accounted for less than 15% of FDI inflows. However, these areas are rich in resources for farming, stock rising, mineral resources and tourist resources. With a large population and potentially lower labor force, other key elements for production are relatively inexpensive. Also, infrastructures
have been improved by central and local governments to attract investment. With the
suitable investment environment and emerging markets, foreign firms who invest in these regions are facing new opportunities and great development space.
5.3 Solving environmental issues will create new opportunities for FDI
Environmental problems are one of the biggest challenges faced by China and the rest of World in terms of economic development. At the fourth round of Sino-US strategic talks held this year, China and America have reached multiple agreements on selected environmental issues. The USA will transfer its leading technologies in the energy and environmental protection areas by the means of foreign direct investment, joint technical research and talent exchange. In the following years, China will offer30
more preferential treatment with more beneficial terms to FDI oriented toward environmental protection. Thus, it is predicted that the environmental protection industries would attract increasing FDI inflows.
5.4 Chinese Government will further perfect the environment for
investment in the future
After China joined in the WTO, the reform and opening up had entered a new developmental stage. The Chinese opening up is omni-directional, multi-leveled and wide-ranging. In November of 2006, the Communist Party of China held the 17th national congress which maintains the stability of the national political situation. The continuity of governmental principles and policies will guarantee that the Chinese reforms and opening up go on continuously and smoothly. The Chinese government announced that it will further perfect the environment for investment (the Ministry of Commerce of China, 2006):
1. Continuously strengthening the soft environmental elements of investment.
The soft environmental element refers to the market-based degree and policies of foreign investments including construction of law systems, perfect of market economy, establishment and implementation of policies and encouraging measures for foreign investment.
The Chinese government not only has already totally cleared and revised relevant laws, regulations and policy documents according to the requirements of market
31
economy and the promises to join in WTO, but also will make the establishment of laws, regulations and policies open, fair, standardized and transparent in the future. Meanwhile, the government will combine the transformation of governmental functions, improve the management and approval of investment, increase the efficiency of services and reduce the steps in examination and approval process.
2. The opening degree of the market should be expanded further. In order to implement the promise of WTO accession, China still needs to open more markets to foreign investors, particularly in the services sector, such as insurance markets, banking, and telecommunications. These markets are mostly monopolized by state-owned enterprises.
CHAPTER
6 - Concluding Remarks
This report has attempted to present a general idea of FDI in China. China did a successful job in attracting FDI from other countries since 1979. The thirty year history of Chinese FDI has formed with a more and more open economic and political system which is key point for foreign investors. The average growth rate of FDI in China is about 10% in recent years. This is an important development for the Chinese economy, the Chinese people, and also for economic growth. This observation don’t believe that this trend will continue unless the world economies get better, or China’s legal system and governance become more effective in enforcing contracts, especially in western China.
32
As for the source of FDI in China, we have to mention two major investors, Hong Kong and Taiwan. They have always been the most important ones. Together with Singapore, Hong Kong and Taiwan have accounted for more than half of the FDI flows to China.
Based on the analyses in this report, several determinants have motivated the FDI in China. First, some FDI investors are interested in the Chinese domestic market. Second, investors would like to find ways to lower production costs, typically cheap labor from China. Third, the quality of infrastructures contributes much to FDI inflows. The good infrastructure helps firms to enhance theirs levels of technology and reap economies of scale and scope. Fourth, the political environment is an important factor in attracting FDI. In China, the political leadership imposed a vision for the path of growth and development of the country.
From China’s experience, FDI contributes importantly to economic development. According to some researches, FDI inflows in China have raised the GDP growth by adding to capital formation, increasing in total factor productivity, and establishing Foreign-funded enterprises (FFEs). Second, FDI inflows in China play a major role in increasing China’s export, which directly results in the huge trade surplus of China and US, EU, and other countries. Third, FDI inflows in China created a large number of job opportunities through FIEs, but it also widen the income gap between eastern and western China.
33
The FDI in China faces some new challenges and opportunities. The challenges are the appreciation of the Chinese Yuan in the world currency market and the increasing production cost of raw material and labor. However, the Chinese government encourages more investment in western China and takes measures to protect environment. This can be expected to provide new opportunities for FDI in China.
34
References
Banerjee, A. (2006). “FDI in China and its Economic Impact,” World Review of
Entrepreneurship, Management and Sust. Development, 2, 1/2.
Branstetter, L. and Feenstra, R. (1999). “Trade and Foreign Direct Investment in China: a
Political Economy Approach,” NBER Working Paper No. 7100.
Chen, C. (1996). “Region Determinants of Foreign Direct Investment in Mainland China,”
Journal of Economic Studies, 23, 18-30.
Chen, C. (1999). “The impact of FDI and trade” In Yanrui Wu, Y. (Ed.), Foreign Direct Investment and Economic Growth in China, Edward Elgar Publishing.
Chen, C., Chang L.., and Zhang, Y. (1995). “The Role of Foreign Direct Investment in
China's Post-1978 Economic Development,” World Development 23(4), 691-703.
Cheng, L. K. and Kwan, Y. K. (2000). “What Are the Determinants of Location of Foreign
Direct Investment? The Chinese experience,” Journal of International Economics, 51,
379–400.
Deng, P. (2001). “WFOEs: The Most Popular Entry Mode into China,” Business Horizons, July-August, 63-72.
Grub, P. D. and Lin, J. H (1991). “Foreign Direct Investment in China,” New York, US: Quorum Books.
Head, K. and Ries, J. (1996). “Inter City Competition for Foreign Direct Investment: Static and Dynamic Effect of China’s Incentive Areas,” Journal of Urban Economics, 40, 38–60.
35
Janeba, E. (1995). “Corporate Income Tax Competition, Double Taxation Treaties, and Foreign Direct Investment,” Journal of Public Economics, 56, 311-325
Lardy, N. (2000). “Is China a “Closed” Economy?” Statement for a Public Hearing of the United States Trade Deficit Review Commission. February 24.
Lemoine, F. (1998). “Trade Policy and Trade Patterns during Transition: China and the
CEECs Compared in Different Paths to a Market Economy.” China and European
Economies in Transition, O.Bouin. F.Coricelli and F. Lemoine editors, OECD Development Center Seminars.
Lemoine, F. (2000). “FDI and the Opening Up of China's Economy,” CEPII Working Paper,
No. 00-11, June.
Lipsey, R. (1999). “The Location and Characteristics of U.S. Affiliates in Asia,” NBER Working Paper No. 6876.
Li, X. J. and Yeung, Y. M. (1999). “Inter-firm Linkages and Regional Impact of Transnational
Corporations: Company Case Studies from Shanghai, China,” Geografiska Annaler
Series B: Human Geography, 81(2), 61-72.
Liu, X., Song, H., Wei, Y. and Romilly, P. (1997). “Country Characteristics and Foreign Direct Investment in China: A Panel Data Analysis.“ Weltwirtschaftliches, Archive,
133(2), 313-329
Moore, Mo. (1993) “Determinants of German Manufacturing Direct Investment. 1980-1988.” Weltwirtschaftliches, Archive, 129, 120-38.
Shapiro, A.C. (1998). Foundations of Multinational Financial Management, 3rd Edition, NJ: Prentice Hall.
36
Shapiro, D. and Globerman, S. (2003). “Foreign Investment Policies and Capital Flows in Canada: A Sectoral Analysis.” Journal of Business Research, 56, 779-790
Sun, Q., Tong, W. and Yu, Q. (2002). “Determinants of Foreign Direct Investment across China,” Journal of International Money and Finance, 21(1), 79-113.
Tseng, W. and Zebregs, H. (2002). “Foreign Direct Investment in China: Some Lessons for Other Countries,” IMF Policy Discussion Paper, PDP 02/03.
Wei, W. H. (2004). “Foreign Direct Investment in China,” Doctoral Dissertation, the State University of New Jersey.
Wei, Y. Q. (2002). “Foreign Direct Investment in China: A Survey.” Working Paper,
Lancaster University Management School.
Young, S. and Lan, P. (1997). “Technology Transfer to China through Foreign Direct Investment,” Regional Studies, 31(7), 669-679.
Yuan, J. (2006). “Foreign Direct Investment in China: A Study of the Four Largest Investors.”
Master thesis, Dalhousie University.
Zebregs H. (2001). “Foreign Direct Investment and Output Growth in China,” IMF
Publications, February 2003
Zhang, H. (2002). “Why Does China Receive So Much Foreign Direct Investment?” World
Economy and China, 10(3), 49–58.
Zhang, K. (1999). “FDI and Economic Growth: Evidence form Ten East Asian Economics,”
37
Zhang, K. H. and Song, S (2000). “Promoting Exports: The Role of Inward FDI in China.”
China Economic Review, 2000, 11(4), 385-396.
Zheng, J. H. (1984). “The Birth of An Important Decision: A New Step in Opening the Country to the World,” LiaoWang, 24, June 11.