Effect of UV degradation and dynamic loading on durability of acrylic
carpets using multiple regression method
Meysam Moezzi1,a , Soheyla Khavari2 & Mohammad Ghane2
1
Department of Textile Engineering, Faculty of Engineering, University of Bonab, Bonab 5551761167, Iran
2
Department of Textile Engineering, Isfahan University of Technology, Isfahan 83111, Iran
Received 4 January 2018; revised received and accepted 6 December 2018
The effect of dynamic fatigue loading on the carpet samples subjected to long-time UV radiation exposure has been studied. The carpet samples are first subjected to different UV exposure time and then dynamic loading is imposed to the samples. In each case, the thickness loss of the carpets is measured. The results show that the UV exposure time has a slight effect on the thickness loss of the carpets. The number of dynamic impacts, on the other hand, shows a significant effect on the thickness loss with an exponential correlation. Using best curve fitting method based on least square method, a predicting equation is derived for the multiple effect of UV exposure time and number of dynamic loading on the thickness loss. The experimental verification reveals that the proposed predicting equation can be used with an acceptable accuracy. Keywords: Acrylic cut-pile carpet, Compression behavior, Dynamic fatigue loading, Thickness loss, UV degradation 1 Introduction
Acrylic carpets are generally exposed to different types of deterioration factors during their life time. One of these factors is the exposure to the sunlight directly or indirectly. Another important factor is different compression fatigue loading including the static (applied from the table’s legs) and the dynamic (by walking on the carpet surface) loads imposed to the carpet surface. Compression behavior of the piles as well as their dynamic reaction after the load-removal, play important roles in the compression performance quality of the carpet1,2. During the last decades, numerous researches have been performed on the compression behavior of the surface piles under loading conditions. The main issue is focused on the flexibility and/or recoverability of the piles after removing the loads as well as the carpets’ thickness reduction 3-5.
Celik and Koc6 studied the dynamic loading conditions on three different machine-made carpet
samples produced from acrylic, wool and
polypropylene fibres. They showed that increasing the number of impact in this kind of loading could increase the intensity of thickness reduction. A new theoretical model by Dayiary et al.7 was presented in order to evaluate total energy of pile deformation in
cut-pile carpets in terms of elastic bending and frictional loose energies. The validity of the presented model was then verified in a further study by Dayiary et al.8. They presented a new theoretical model in which total energy of pile deformation in cut-pile carpet has been calculated. The theoretical calculation involves bending energy of pile deformation, frictional loose energy due to sliding pile yarns, and compressional energy due to piles jamming at the end of pile deformation process9.
Sheikhi et al.10 studied the compression properties of acrylic cut-pile carpet consisting of pile yarn with different fibre blend ratios. The results show that with an increase in the coarse acrylic fibre component ratio, the yarn specific volume first decreases and then increases. The statistical regression analysis suggested that the compression behavior of acrylic cut-pile carpet is extremely close to the two parameter model proposed for woven fabrics. Tabatabaei et al.11
achieved the predictive models for the functional
compression properties of carpet. Factorial
experimental design and response surface method were applied for modeling of each compression properties.
Gao et al.12 presented the viscoelastic models for describing mechanical behavior of polypropylene carpet. The standard linear model and the standard nonlinear model are developed to simulate the polypropylene yarn tensile, stress relaxation and creep
——————
a
Corresponding author.
behaviors. The results showed that the standard linear model fits well the tensile, relaxation and creep experimental curves.
Erdogan13 studied experimentally the influence of cross-section shape of the pile fibres on the compression properties of carpets under short and long-term static loadings. The experimental results indicate that the percentage thickness loss of the carpets having hollow piles is slightly higher than the carpets with trilobal piles in both short- and long-term static loadings.
Berkalp and Onder14 studied the effect of mechanical impact on the structural properties of the carpets made from acrylic, wool and polypropylene fibers in two different pile height and stitch densities. It was concluded that the wear rate (the amount of abrasion), especially for the acrylic carpets, increases by increasing the weft density and pile height. Nilgün Ozdil et al.15 checked out the structural characteristics as well as the compressibility and recovery of seven carpet samples. It was found that increasing the yarn linear density, pile density, pile thickness and weight could positively affect the carpets recovery properties. Gupta et al.16 suggested a novel method so called response surface method to study compressional recovery of Persian hand knotted wool carpets. In various literatures, it has been shown that by increasing the carpet piles density, the piles compressibility is decreased due to the smaller spaces between the pile yarns and the higher frictional effect. Increasing the pile height eventually increases the carpet compressibility due to the higher buckling phenomenon of the piles17-19. Other dynamic-compression features of the pile materials were investigated including the compression modulus extracted from the stress-strain curve of compression tests, compression energy, recoverability, and energy absorption or hysteresis effect 20.
Javidpanah et al.21,22 used four types of cut-pile carpets. Pile yarns were air-jet textured polyester filament yarns that were modified by different heat processes. Then, the carpets compression behavior was investigated by static and dynamic loading tests. Results showed that the freezing and heat-setting processes of pile yarns have no significant effect on the carpet static and dynamic recovery.
When UV radiations are subjected to the textile materials, some reactions may occur in the molecular scales. This affects the physical and mechanical properties of the constituent fibres and consequently
the ultimate performance of the products23, 24. Clothing and some other products made of the textile materials are generally exposed to UV radiations directly or indirectly.
Moezzi and Ghane25 predicted the toughness of UV-degraded woven fabrics at different levels of exposure time and various directions. Regression methods were used to find the correlation between the exposure times and the loss rate of toughness.
Acceptable agreement was observed between
experimental results and regression model. In other research, they studied UV degradation effect on the recovery behavior of cut-pile carpets after static loading. Regression methods were used to find the correlation between the exposure times and the thickness loss. Acceptable agreement was observed between experimental results and regression model 26. This study is aimed at investigating the effect of both UV exposure and dynamic fatigue loading on the recovery performance of the acrylic carpets. The carpets are exposed to UV radiation in an accelerated UV chamber. Different dynamic impact numbers are then applied to the carpet samples. The thickness loss of the samples is measured and analyzed. A two variables equation is derived based on the best curve fitting and least square method. The equation can be used to predict the thickness loss in any arbitrary values of UV exposure time and dynamic impact numbers.
2 Materials and Methods
In this study, acrylic cut-pile carpet with the knot density of 500/m was produced. Number of knots per square meter was 1000×500. Weft-yarn was jute and warp-yarn was polyester/cotton. Pile-yarn was 100% acrylic. Weft-yarn density and warp-yarn density were 1000 and 500 per meter respectively. Weft-yarn count and warp-yarn count were 6 LBS /2 ply (R 3 LBS) and 20 Ne /2 ply (R 10 Ne) respectively. Pile-yarn height was 12 mm.
Dynamic tests were carried out based on the ISO
2094(BS4052) using WIRA dynamic loading
machine. The carpet samples were cut in the dimension of 125×125 mm2. The samples thicknesses were measured using a digital thickness tester (0.01 mm accuracy) based on the standard ISO 1765 (BS 4051). These samples were then exposed to UV radiation using an accelerated UV Chamber tester. The apparatus consists of 8 Philips TUV T8 30W/G30 lamps with the maximum wavelength of 253.7 nm. This wavelength was in the range of UVC. The
intensity of radiation lamps was measured by a digital light meter (Lutron UVC-254). The intensity of UVC light was 3mW/cm2.
The experiments were carried out on seven different cases of UVC exposure time, i.e. 0h, 30min, 1.5h, 3h, 4h, 6h, and 8h. In case of exposure time, five samples were used. Samples in each case of UVC exposure (five samples) were then imposed to the dynamic impact test. For all UVC cases, 8 levels of impact numbers were tested, i.e. 0, 25, 50,100, 150, 200, 500 and 1000. After each impact level the average thickness of sample was measured.
3 Results and Discussion
The value of thickness loss (TL%), is calculated26 using the following equation:
TL%= 0 0 100 i h h h …(1)
where TL(%) is the percentage of thickness loss compared to the initial thickness; h0, the initial
average thickness; and hi, the average thickness after
the ith impact.
In this study, the effect of dynamic impact numbers and the UV exposure time on the percentage thickness loss has been investigated. The thickness of samples after UV exposure is considered as the initial thickness. The experimental analysis shows a very slight difference between the thickness of the samples just before and after the UV exposure. However, the differences are not statistically significant. The percentages of thickness loss for samples are given in Table 1.
3.1 Effect of UV Exposure Time on Carpets Thickness Loss
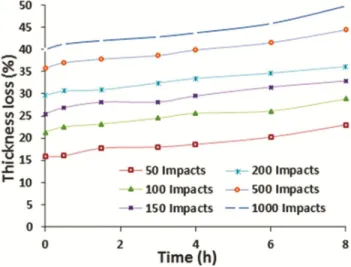
The variation in thickness losses versus UV exposure time at different impact numbers is shown in Fig. 1. The variation in thickness loss versus time of UV exposure shows an almost linear trend. It seems that with the increase in impact numbers the slope of line increases slightly. It may reveal that at the higher impact numbers the thickness loss is more sensitive to the UV radiation time.
3.2 Effect of Impact Numbers on Carpets Thickness Loss
The variations in thickness loss versus dynamic impact numbers at different UV exposure times is shown in Fig. 2. The increase in number of dynamic impacts, in all the exposure times, leads to increase the per cent thickness loss. It is illustrated
Table 1 — Thickness loss percentage Initial thickness, mm Exposure time, h Thickness loss, % 0 Impact 25 Impact 50 Impact 100 Impact 150 Impact 200 Impact 500 Impact 1000 Impact 12.83 0.0 0.00 10.37 (4.05) 15.82 (3.43) 21.36 (5.60) 25.49 (2.68) 29.62 (6.12) 35.85 (4.14) 39.98 (5.55) 11.73 0.5 0.00 12.45 (3.59) 16.05 (4.72) 21.57 (3.69) 26.00 (5.09) 29.75 (3.18) 36.23 (4.80) 40.41 (6.58) 11.97 1.5 0.00 13.28 (4.32) 16.62 (6.05) 22.22 (2.80) 27.15 (4.80) 30.00 (5.44) 37.01 (3.76) 41.18 (3.78) 11.42 3.0 0.00 14.27 (2.88) 16.90 (3.86) 23.47 (6.20) 27.81 (4.56) 31.52 (4.14) 37.74 (5.40) 42.03 (5.62) 12.73 4.0 0.00 14.92 (5.21) 17.44 (5.34) 24.51 (4.48) 28.52 (3.45) 32.82 (4.61) 39.04 (6.32) 42.97 (2.18) 12.02 6.0 0.00 15.39 (4.47) 18.64 (4.88) 24.62 (7.13) 30.12 (2.21) 33.36 (6.52) 40.35 (3.49) 44.76 (6.02) 11.80 8.0 0.00 17.63 (3.92) 21.10 (3.32) 27.12 (4.20) 31.27 (6.24) 34.58 (2.20) 43.05 (3.50) 48.56 (3.51) Values in parentheses show standard deviations.
Fig. 1 — Variation in thickness losses versus UV exposure time at different impact numbers
that the trend in thickness loss has a steep slope up to about 200 impact numbers. While, at the higher impact numbers, it tends to show a lower slope and attain a constant value at a very high impact numbers.
3.3 Curve Fitting and Predicting Model
To achieve the predicting model, sigma plot software is used to find the best curve fit for the experimental data based on the least square method. An exponential equation shows the best curve fit with maximum R-square. The general form of the equation in each exposure time is found to be:
) …(2)
where y is the percentage of thickness loss (TL %); x, the number of dynamic impacts; and A and B, the constants.
The curve fitting procedure has been performed in each case of UV exposure times and the values of constants A and B are calculated. Table 2 shows the values of A and B as well as R-squares in each case of UV exposure time.
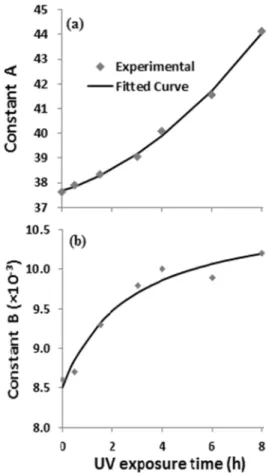
At this stage, the correlation between the constants A and B and the UV exposure time is calculated using sigma plot software based on the least square method. Constant A reveals a quadratic regression with the UV exposure time showing an R-square of 0.9967, as shown in following equation
…(3)
Constant B shows a rational function with UV exposure time (R-square of 0.9624), as shown in following equation:
…(4)
Figure 3 shows the experimental plots of the constants A and B versus the UV exposure time. The theoretical curves of the best fitting Eqs (3) and (4) are also shown in Fig. 3. By inserting Eqs (3) and (4) in Eq. (2) , following equation is obtained:
y = (37.6969 + 0.3007t + 0.0619t2) (1- e–
1 0.19
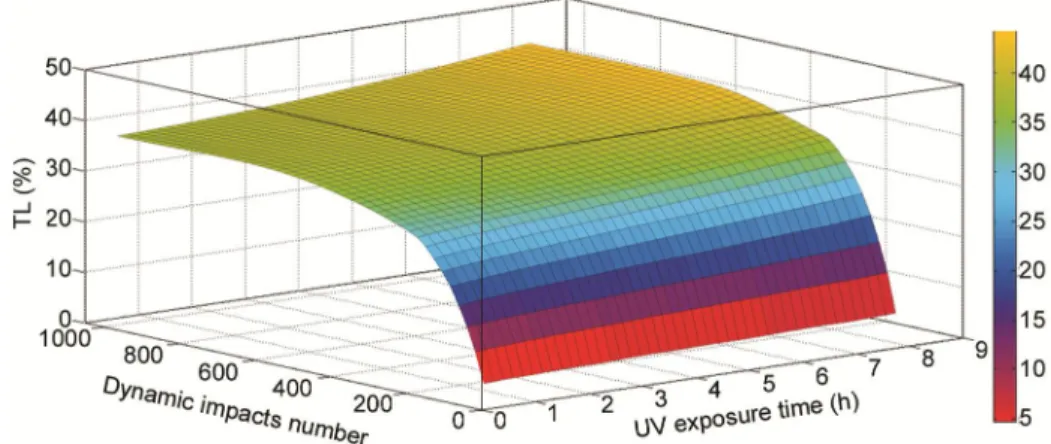
(117.56 44.62 ) t x t ) …(5)where y is the thickness loss (TL %); x, the number of impacts; and t, the UV exposure time (h).
These two variables equations can be used to predict the thickness loss of the carpet in any arbitrary impact numbers and UV exposure time. A three dimensional presentation of Eq. (6) is shown in Fig. 4.
Fig. 2 — Effect of number of impacts on percentage of thickness loss
Table 2 — Values of constants A and B in different exposure time R-sq B×10-3 A UV exposure time, h 0.977 8.6 37.61 0.0 0.967 8.7 37.93 0.5 0.958 9.3 38.34 1.5 0.957 9.8 39.04 3.0 0.957 10.0 40.09 4.0 0.953 9.9 41.54 6.0 0.928 10.2 44.14 8.0
Fig. 3 — Correlation between (a) constant A, and (b) constant B and time
Table 3 — Comparison of experimental and modeling data Difference, % Experimental Predicting model Exposure time, h -3.94 18.48 17.78 0.0 0.87 18.23 18.39 0.5 1.61 18.95 19.26 1.5 0.64 20.12 20.25 3.0 -1.30 21.12 20.85 4.0 -1.00 22.34 22.12 6.0 -3.65 24.42 23.56 8.0
The variable parameters are UV exposure time and impact numbers. The output or independent parameter is the percentage of thickness loss.
3.4 Model Verification
To verify the predicting model, some experiments in an arbitrary impact number are conducted. The verifying level is considered at 75 impact numbers. The dynamic loadings are imposed on the samples at the same levels of UV exposure times as the main samples. The percentage of thickness losses are measured and compared to the values obtained from the predicting model [Eq. (5)]. The results are shown in Table 3. The percentage
difference between the predicating and the
experimental values are also calculated (Table 3). Minus sign indicates that the predicted value is less than the experimental value.
As can be seen in Table 3, the difference in percentage between the predicting model and the experimental values is very small and in an acceptable range. It can be concluded that the presented equation can predict the effect of UV exposure time and the dynamic loading on thickness loss of the carpets with an acceptable accuracy.
4 Conclusion
In this study, the effect of dynamic impact and UV exposure time on the thickness loss of machine woven carpets has been investigated. The results show that the increase in dynamic impact numbers have significant effect on the thickness loss of the carpets. An exponential relation is observed between the thickness loss and the dynamic impact numbers. The rate of thickness loss is high and significant up to about 200 impacts and then tends to attain a constant value at higher dynamic ismpact numbers. The UV exposure time also, on the other hand, shows some effect on the thickness loss. However, the effect of dynamic impact number is more significant than the UV exposure time. The multiple regression equation is also derived. The multiple regression equation can be used to predict the thickness loss percent in an arbitrary UV exposure time and dynamic impact numbers with significant accuracy.
References
1 Grover G, Zho S & Twilly I C, Text Res J, 63 (1993) 257. 2 Wu J, Pan N & Williams KR, Text Res J, 77 (2007) 172. 3 Korkmaz Y & Dalcikocer S, J Text Inst, 101 (2010) 236. 4 Carnaby G A & Wood E J, J Text Inst, 80 (1989) 71. 5 Koc E, Celik N & Tekin M, Fibres Text East Eur, 13 (2005)
56.
6 Celik N & Koc E, Fibres Text East Eur, 18 (2010) 54. 7 Dayiary M, Shaikhzadeh Najar S & Shamsi M, J Text Inst,
100 (2009) 688.
8 Dayiary M, Shaikhzadeh Najar S & Shamsi M, J Text Inst, 101 (2010) 488.
9 Dayiary M, J Text Inst, 106 (2015) 1315.
10 Sheikhi H, Shaikhzadeh Najar S, Etrati1 M & Dayiary Bidgoly M, Fibres Text East Eur, 20 (2012) 77.
11 Tabatabaei S M, Ghane M, Zeinal Hamadani A & Hasani H,
Fiber Polym, 15 (2014) 1977.
12 Gao X, Sun Y, Meng Z & Sun Z, Mater Lett, 65 (2011) 2228.
13 Ümit Halis Erdoğan, J Text Inst, 103 (2012) 1369. 14 Berkalp Ö B & Önder E, Text Res J, 71 (2001) 249.
15 Nilgun Ozdil, Faruk Bozdogan, Gonca Ozcelik Kayseri & Gamze Supuren Mengu, J Text Apparel Tech Manage, 22 (2012) 203.
16 Gupta SK, Majumdar A & Goswami K K, Indian J Fibre Text Res, 42 (2017) 399.
17 Dunlop J I & Jie S, J Text Inst, 80 (1989) 569.
18 Moghasem A R & Gharehaghaji AA. Int J Eng Trans B: App, 21 (2008) 303.
19 Vangheluwe L & Kiekens P, Text Res J, 67 (1997) 671.
20 Mojabi SA, Shaikhzadeh Najar S, Hosseini Hashemi S, Rashidi A & Bassam S J, Fibres Text East Eur, 66 (2008) 57. 21 Javidpanah M, Shaikhzadeh Najar S & Dayiary M, J Text
Inst, 105 (2014) 1265.
22 Javidpanah M, Shaikhzadeh Najar S & Dayiary M, J Text Inst, 106 (2015) 236.
23 Moezzi M, Ghane M & Semnani D, J Eng Fiber Fabric, 10 (2015) 1.
24 Moezzi M, Ghane M, Nicoletto G & Nedoushan R J,
Mater Des, 54 (2014) 279.
25 Moezzi M & Ghane M, J Text Inst, 104 (2013) 1277. 26 Jafari S, Ghane M & Moezzi M, J Text Inst, 108 (2017) 256.