İSTANBUL TECHNICAL UNIVERSITY INSTITUTE OF SCIENCE AND TECHNOLOGY
WEB–BASED GROUP DECISION SUPPORT SYSTEMS IN DEFENCE TECHNOLOGIES
M.Sc. Thesis by Yavuz GÖSTERİŞLİ
(514031154)
Date of submission : 5 May 2006 Date of defence examination : 15 June 2006
Supervisor: Assoc. Prof. Dr. Cengiz GÜNGÖR Members of the Examining Committee: Assoc. Prof. Dr. Y. İlker Topçu (İ.T.Ü.)
Assist. Prof. Dr. Ahmet Beşkese (B.Ü.)
JUNE 2006
PREFACE
Organizations that are dealing with defence systems have engaged in various business processes (e.g., engineering, research, research and development) are working together by sharing information and making decisions. Technological advances and the myriad of development tools available today are still beset with issues of incompatible machines, platforms and operating system, on top of costly proprietary systems.
A Web-based Decision Support System (DSS) is a built with Web technologies so that the DSS users access it with Web browsers via an Internet connection [9, 52]. Web-based DSS applications developed by companies may be deployed on corporate intranets to support internal business processes or they can be integrated into public corporate Web sites to support their decision making process [52]. Web-based GDSS products provide a more generic approach to solving more complex problems that are less structured. Web – based group support systems provide defence system organizations to engage in their businesses more effectively and efficiently. Therefore, Web GDSS supports these organizations if they have to make decision on any subject matter.
I am pleased to acknowledge the substantial contributions of those who assisted me in completing this thesis. My heartfelt thanks go to the members of my thesis committee, Dr. Cengiz Güngör, Dr. Yusuf İlker Topçu, and Dr. Ahmet Beşkese for their valuable comments and suggestions throughout the writing process of this thesis. I am particularly indebted to my supervisor Dr. Cengiz Güngör for having been a kind advisor, a colleague and a friend. I would like to thank him for his substantial advice, gentle redirections, precious criticisms as well as constant encouragements. I would like to appreciate Dr. Gülcan Erçetin who helped me to conceptualize the theoretical framework and guided me throughout the research process of the thesis with her invaluable comments and suggestions. I would also like to appreciate Dr. Gülcan Erçetin, Dr. Ayşe Gürel, Işıl Erduyan who provided me with students to pilot the instruments. I would like to express my sincere gratitude to my friend Hüseyin Şimşek, Robin Laçinoğlu, Servan Güney, Volkan Bal who helped me to design the software program named as İTÜ-Web GDSS. I am also indebted to my friends and colleagues Nazik Dinçtopal, Nurçin Eğercioğlu for collaborating in data collection and preparing the computer laboratories for the study, Şebnem Yalçın for proof reading of my thesis. They have always welcomed me whenever I needed assistance.Moreover, many thanks to the 2005/2006 freshman, sophomore, senior students at the Department of Foreign Language Education in Boğaziçi University for their willingness to participate in the study. I further extend my gratitude to my family Mert Gösterişli, Yasemin Gösterişli, Gülsen Soylu, who provided me with constant support and patience througout the writing process of the study.
I dedicated this thesis to my mother and my father.
May 2006 Yavuz GÖSTERİŞLİ
TABLE OF CONTENTS
TABLE LIST viii
FIGURE LIST ix SYMBOL LIST xi ÖZET xii SUMMARY xiii 1. INTRODUCTION 2 2. DECISION MAKING 4 3. MULTIPLE CRITERIA DECISION ANALYSIS (MCDA) 5
4. THE ANALYTIC HIERARCHY PROCESS (AHP) 6
4.1. Construction of Hierarchy 10 4.2. Philosophy, Procedure and Application of the AHP 11
4.3. Prioritization of Choices 17
4.3.1. Measurement Scale 17 4.3.1.1. Absolute and Relative Measurement 18
4.3.1.2. Fundamental or Priority Scale 19
4.4. Comparison Matrix and Solutions 20
4.4.1. Eigenvector 23 4.4.2. Consistency 24
5. DECISION SUPPORT SYSTEMS (DSS) 27
5.1. Definitions of DSS 27 5.2. Characteristics of DSS 28
5.3. Types of DSS 30
5.3.1. Model-Oriented DSS 30 5.3.2. Data-Oriented DSS 31
5.4. Functional Requirements of DSS 32 5.5. Difficulties with DSS Development and Use 33
5.6. DSS Methods 35 6. GROUP DECISION MAKING 37
6.1. Groups and Decision Making 37 6.2. The Drawbacks of Group Decision Making 38
6.3. Groupware 40 6.4. Group Decision Support System (GDSS) 41
6.5. Group Decision Support System (GDSS) using AHP 42 7. REVIEW OF WEB-BASED DECISION SUPPORT SYSTEM (WEB DSS)
AND WEB-BASED GROUP DECISION SUPPORT SYSTEM (WEB GDSS) 47
7.1. Web-based Decision Support System 47 7.2. Implementation Challenges of Web DSS 49 7.3. Characteristics and Design of Web DSS 50
7.3.1. Web DSS should be usable, useful and used 51 7.3.2. Web DSS Design can not be separated from implementation 52
7.3.3. Web DSS Design is a Change Process 52
7.3.3.1. Technocratic Approach 53 7.3.3.2. System’s Analysis Approach 54 7.3.3.2. System’s Analysis Approach 54
7.3.3.4. Evolutive Approach 55 7.3.4. Decision and Web DSS Design are both Learning Process 55
7.4. Web-based Group Decision Support System 56 8. İTÜ – WEB GDSS: THE ARCHITECTURE AND DESIGN OF A WEB-
BASED GROUP DECISION SUPPORT SYSTEM 58
8.1. The Architecture and Design of İ.T.Ü. – Web GDSS 58
8.1.1. The Development Framework for İTÜ – Web GDSS 63
8.1.2. Implementation of İTÜ – Web GDSS 64
8.2. Storyboard for İTÜ – Web GDSS Design 65
8.2.1. Storyboard for System Manager 67 8.2.2. Storyboard for Project Manager and Project User 74
8.2.2.1. Project Manager Creates New Project 77 8.2.2.2. Project Manager Creates Hierarchy Decision Tree for AHP of
Project 79 8.2.2.3. Project User Evaluates Hierarchy Decision Tree for AHP of
Project 84 8.2.2.4. Information 91
8.2.2.5. Announcements 92 8.2.2.6. Discussion Board 94 8.2.2.7. Project Decision for Project Manager 97
8.2.2.8. Project Decision for Project User 101 8.2.2.9. Reports for Project Manager 102 8.2.3.10. Project Manager’s Responsibilities 103
8.2.3.11. Project User’s Responsibilities 106
9. THEORY DEVELOPMENT AND RESEARCH HYPOTHESES 109
9.1. Statement of Research Problems 109
9.2. Hypotheses 110
9.2.1. Null Hypotheses (H0) 110 9.2.2. Alternative Hypotheses (H1) 110
10. RESEARCH METHOD 112 10.1. Research Design and Subjects 112
10.2. Task Identification and Description 112
10.3. Variable Identification 113 10.4. Experimental Procedures 114 11. RESULTS AND DISCUSSION 117
11.1. Satisfaction with System: 119 11.2. Satisfaction with Decision Making Process: 120
11.3. Satisfaction with Decision: 121 11.4. Satisfaction with Overall GDSS: 122 12. CONCLUSION AND FURTHER RESEARCH 124
REFERENCES 126
APPENDIXES 132 Appendix A: Problem Task 132
Appendix B: Questionnaire 133 Appendix C: Reliability Analysis for Satisfaction with System 134
Appendix D: Reliability Analysis for Satisfaction with Decision Making
Process 135 Appendix E: Reliability Analysis for Satisfaction with Decision 137
Appendix F: Reliability Analysis for Satisfaction with GDSS 138
Appendix G: Descriptives of Group 141 Appendix H: Graphs of Satisfaction with System 142
Appendix H1: Histograms of Satisfaction with System 142 Appendix H2: Normal Q-Q Plots of Satisfaction with System 143 Appendix H3: Detrended Normal Q-Q Plots of Satisfaction with System 144
Appendix H4: Boxplot of Satisfaction with System 145
Appendix J: Graphs of Satisfaction with Decision Making Process 146
Appendix J1: Histograms of Satisfaction with Decision Making Process 146 Appendix J2: Normal Q-Q Plots of Satisfaction with Decision Making
Process 147 Appendix J3: Detrended Normal Q-Q Plots of Satisfaction with Decision
Making Process 148 Appendix J4: Boxplot of Satisfaction with Decision Making Process 149
Appendix K: Graphs of Satisfaction with Decision 150
Appendix K1: Histograms of Satisfaction with Decision 150 Appendix K2: Normal Q-Q Plots of Satisfaction with Decision 151 Appendix K3: Detrended Normal Q-Q Plots of Satisfaction with Decision 152
Appendix K4: Boxplot of Satisfaction with Decision 153
Appendix L: Graphs of Satisfaction with GDSS 154
Appendix L1: Histograms of Satisfaction with GDSS 154 Appendix L2: Normal Q-Q Plots of Satisfaction with GDSS 155 Appendix L3: Detrended Normal Q-Q Plots of Satisfaction with GDSS 156
Appendix L4: Boxplot of Satisfaction with GDSS 157
Appendix M: Independent Samples T – Test 158 Appendix N: Means Plots of Independent Samples T – Test 160
Appendix O: One Sample T – Test of İTÜ – Web GDSS Group 162
Appendix P: One Sample T – Test of Groups 163
CURRICULUM VITAE 164
TABLE LIST
Page
Table 4.1. Fundamental Scale... 20
Table 4.2. Pair-wise Comparison Matrix... 21
Table 4.3. Average Random Consistency Index (R.I)... 26
Table 7.1. Comparison of three types of DSS... 51
Table 10.1. Distribution of Students over GDSS groups... 114
Table 11.1. Group Statistics for Dependent Variables... 117
Table 11.2. Independent Samples T-test... 117
FIGURE LIST
Page
Figure 4.1 : A Three Level Hierarchy... 8
Figure 4.2 : A Linear Hierarchy Structure ... 12
Figure 4.3 : A Detailed Three Level Hierarchy Structure... 13
Figure 4.4 : A Detailed Four Level Hierarchy Structure ... 14
Figure 4.5 : A Nonlinear Network Hierarchy Structure... 15
Figure 5.1 : Model-Oriented Support Sequence ... 31
Figure 5.2 : Data-Oriented Support Sequence ... 32
Figure 6.1 : Consensus Decision Method Hierarchy ... 45
Figure 6.2 : Separate (Combined) Decisions Method Hierarchy... 46
Figure 7.1 : Evolution towards Web DSS.... 51
Figure 7.2 : DSS Design and Implementation as a Socio-Technical Process.... 53
Figure 7.3 : Technocratic Approach ... 54
Figure 7.4 : System’s Analysis Approach... 54
Figure 7.5 : Participative Approach ... 55
Figure 7.6 : Evolutive Approach... 55
Figure 8.1 : The Architecture of İTÜ – Web GDSS ... 60
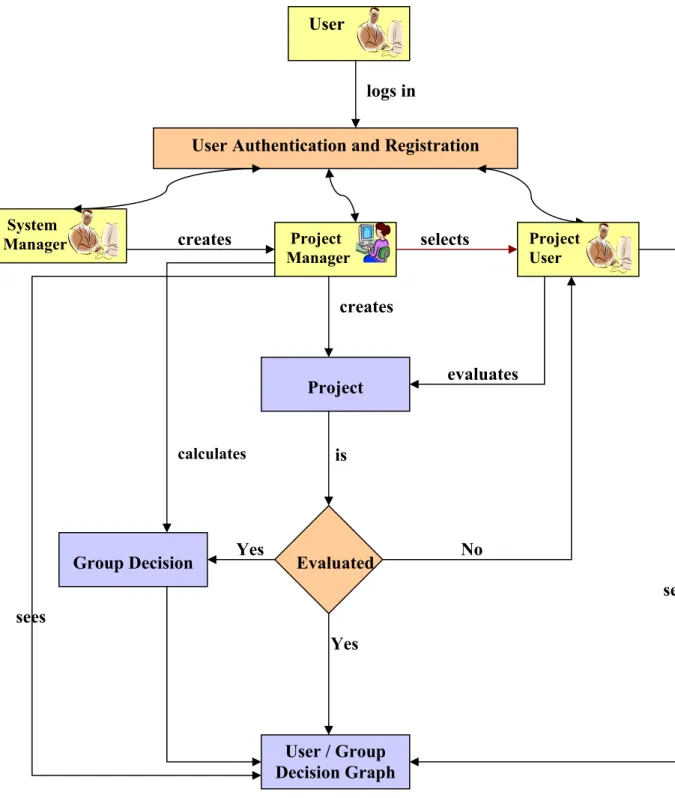
Figure 8.2 : Overview of Project Design and Evaluation ... 61
Figure 8.3 : Home Page of İTÜ – Web GDSS... 65
Figure 8.4 : User creates account ... 66
Figure 8.5 : System Administration Page ... 67
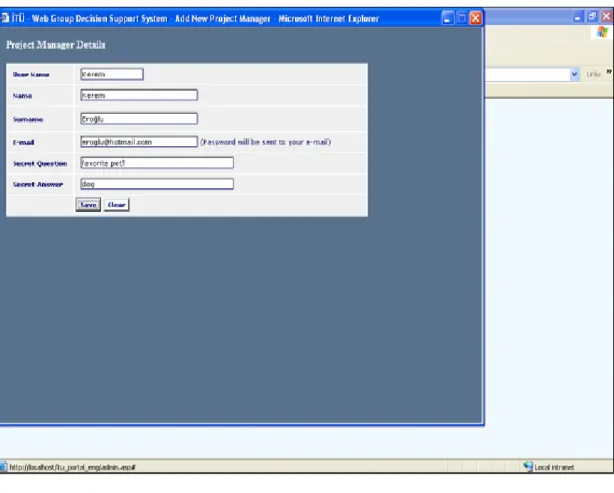
Figure 8.6 : İTÜ–Web Group Decision Support System–Add New Project Manager Page... 68
Figure 8.7 : Users List Page ... 69
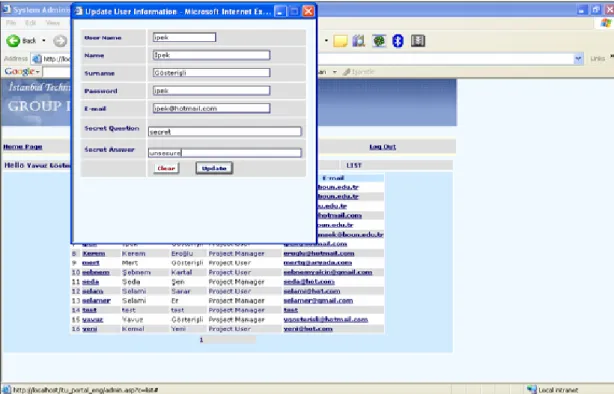
Figure 8.8.a : Update User Information Page ... 70
Figure 8.8.b : Send E-mail Page ... 70
Figure 8.9 : Update My Info Page... 71
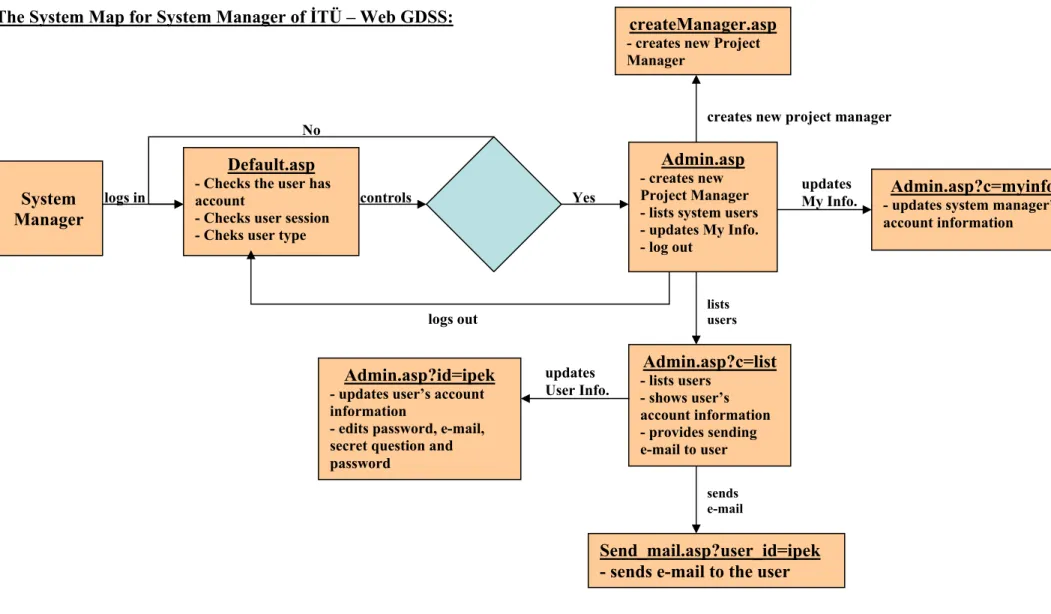
Figure 8.10 : The System Map for System Manager of İTÜ – Web GDSS ... 72
Figure 8.11 : Project Design and Evaluation Page for Project Manager... 73
Figure 8.12 : Update My Info Page... 74
Figure 8.13 : Contact Us Page ... 74
Figure 8.14 : Page Design for Project Design and Evaluation of İTÜ-Web GDSS75 Figure 8.15 : New Project Details Page ... 76
Figure 8.16 : Users Page ... 77
Figure 8.17 : Creating Hierarchical Decision Tree of Project Page... 78
Figure 8.18 : Drag Criterion... 79
Figure 8.19 : Drop Criterion ... 80
Figure 8.20 : Sub-Criteria of Hierarchy ... 80
Figure 8.21 : The Hierarchy Tree... 81
Figure 8.22 : The Project Hierarchy Tree ... 82
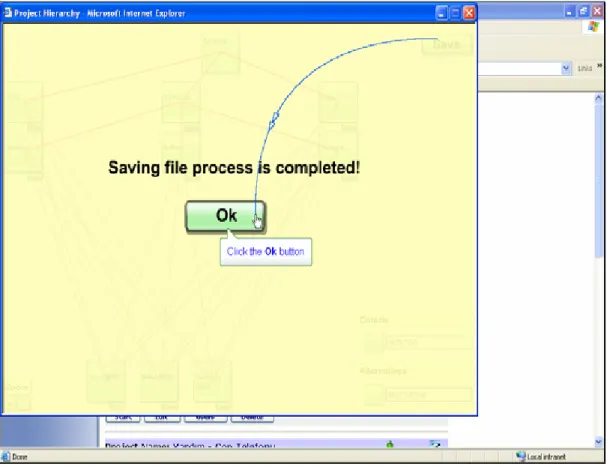
Figure 8.23 : Saving Project Hierarchy Tree ... 83
Figure 8.24 : Project Design and Evaluation Page for Project User ... 84
Figure 8.25 : Project Hierarchy for Project User ... 85
Figure 8.26 : Evaluation Frame for an Element in Project User Evaluation ... 86
Figure 8.27 : First Pair-wise Comparison for Element in Project User Evaluation87 Figure 8.28 : Second Pair-wise Comparison for Element in Project User Evaluation ... 88
Figure 8.29 : Third Pair-wise Comparison for Element in Project User Evaluation ... 89
Figure 8.30 : Completed Pair-wise Comparison of Project User... 90
Figure 8.31 : Information for İTÜ – Web GDSS Page ... 91
Figure 8.32 : Announcements for Projects Page... 92
Figure 8.33 : New & Edit Announcement Page... 93
Figure 8.34 : Discussion Board Page ... 94
Figure 8.35 : Discussions Page ... 95
Figure 8.36 : Reply Subject Page... 96
Figure 8.37 : Project Decision for Project Manager Page... 97
Figure 8.38 : Project Users’ Decisions Status Page ... 98
Figure 8.39 : Project User’s Decision on Project Page ... 99
Figure 8.40 : Group Decision Page... 100
Figure 8.41 : Project User Decision Page ... 101
Figure 8.42 : Reports Page... 102
Figure 8.43 : The System Map for Project Manager of İTÜ – Web GDSS... 104
Figure 8.44 : The System Map for Project User of İTÜ – Web GDSS ... 107
Figure 11.1 : Graph for Means of Satisfaction with System... 119
Figure 11.2 : Graph for Means of Satisfaction with Decision Making Process... 120
Figure 11.3 : Graph for Means of Satisfaction with Decision ... 121
Figure 11.4 : Graph for Means of Satisfaction with GDSS ... 122
SYMBOL LIST
A : Pair-wise Comparison Matrix
a
ij : Relative importance of element i over element ja
ik : Relative importance of element i over element ka
jk : Relative importance of element j over element k wi : Weight of element iwj : Weight of element j
n : Number of elements
λ
max : Maximum eigenvaluew
: Relative importance vectorAw : w vector of the relative importance of A matrix
C. I. : Consistency Index
C. R. : Consistency Ratio
R. I. : Random Index
SAVUNMA TEKNOLOJİLERİNDE WEB TABANLI GRUP KARAR DESTEK SİSTEMLERİ
ÖZET
Bu çalışmada, İTÜ – Web GDSS adı altında bir Web tabanlı karar destek sisteminin yapısı ve tasarım detayları anlatılmıştır ve bir karar destek sistemi oluştururken karşılaşılan zorluklardan bahsedilmektedir. İTÜ - Web GDSS çok ölçütlü karar verme metotlarından biri olan Analitik Hiyerarşi Süreci modelini kullanmaktadır. İTÜ – Web GDSS Web tabanlı bir grup karar destek sistemidir. Bu sistem, kullanıcılara bir hedef doğrultusunda kendi kararlarını almalarına yardımcı
olmaktadır. İTÜ – Web GDSS, grup kararını da desteklemekte olup kullanıcılara kendi kararlarının yanı sıra grup kararlarını gözlemleyebilmelerini sağlamaktadır. İTÜ – Web GDSS bir yazılım aracıdır ve AHS modelini karar alma sürecinde kullanmaktadır. AHS yöntemi kullanılarak bir problem modellenir, alternatifler göreceli önemlerine göre değerlendirilir, bilgi organize edilir ve değerlendirme hükümleri yapılır. İTÜ – Web GDSS Web de kullanılabilir olup küresel olarak erişime açıktır. Web teknolojilerinin avantajlarını kullanmaktadır. Web kaynaklarına bağlantı kurmak ve çeşitli platform özellikleri sisteme önemli özelliklerinden bazılarıdır.
Karar destek sistemlerini kullanan grupların performansları son 20 yıldır çokça tartışılan bir konudur. Bu yüzden, grup karar destek sistemi kullanan takım üyelerinin tatmini gibi öznel değişkenlere biraz daha odaklanmaya ihtiyaç duyulmaktadır. Deneysel bir çalışma yapılarak İTÜ – Web GDSS’in kullanıcı tatmini rapor halinde hazırlanmıştır. Bu çalışmada, grup kararı alırken çeşitli kullanıcı tatmin öğelerine odaklanılmıştır: sistemden tatmin, süreçten tatmin, karardan tatmin, karar destek sisteminden tatmin.
WEB–BASED GROUP DECISION SUPPORT SYSTEMS IN DEFENCE TECHNOLOGIES
SUMMARY
In this research, the architecture and detailed design of a Web-based GDSS, called İTÜ – Web GDSS are discussed to address the challenges of building a Web-based GDSS. İTÜ - Web GDSS, which uses Analytical Hierarchy Process model in decision process that is for multi-attribute decision making, is a Web-based Group Decision Support System. İTÜ - Web GDSS supports users to decide on their own specified goal. It also provides users to observe their own decision and group decision. İTÜ – Web GDSS is a software tool, which implements the AHP. It uses the AHP methodology to model any problem, evaluate relative desirability of alternatives, and organize information and judgments used in decision making. İTÜ – Web GDSS is deployed on the World Wide Web (WWW) and can be accessed globally. It takes advantages of WWW with wide ability, Web resource integration and cross-platform capabilities.
Performance of groups using group decision support systems has been an issue debated over the last two decade. Yet, there is a need for more focused subjective variables such as the satisfaction of team members with the experience of using a GDSS. An empirical study is reported to assess the user satisfaction of İTÜ – Web GDSS in supporting distributed group. This research focuses on different types of user satisfaction in GDSS based group decision making: system satisfaction, process satisfaction, outcome, and GDSS satisfaction.
1. Introduction
Companies are going global and this is especially important for companies participating in the global supply chain. To become smart enterprises, these companies are deploying virtual teams to carry out short- and long-term projects [45, 46]. Virtual teams are geographically dispersed groups of people sharing common goal to carry out interdependent tasks while working at different locations. They employ computer and communication technologies to communicate ideas and information, coordinate activities, as well as make decisions [13, 42]. For virtual teams to work effectively, it is critical they use collaboration technologies to overcome the barriers of time and space [23, 42].
Group Decision Support Systems (GDSS) and Group Support Systems (GSS) combine communication, computer, and decision support technologies to facilitate the formulation and solution of unstructured problems by a group of people. In this research, the architecture and detailed design of a Web-based GDSS, called İTÜ – Web GDSS are discussed to address the challenges of building a Web-based GDSS. İTÜ - Web GDSS, which uses Analytical Hierarchy Process model in decision process that is for multi-attribute decision making, is a Web-based Group Decision Support System. İTÜ - Web GDSS supports users to decide on their own specified goal. It also provides users to observe their own decision and group decision. İTÜ – Web GDSS is a software tool, which implements the AHP. It uses the AHP methodology to model any problem, evaluate relative desirability of alternatives, and organize information and judgments used in decision making. İTÜ – Web GDSS is deployed on the World Wide Web (WWW) and can be accessed globally. It takes advantages of WWW with wide ability, Web resource integration and cross-platform capabilities.
Performance of groups using group decision support systems has been an issue debated over the last two decade. Yet, there is need for more focused on subjective variables such as the satisfaction of team members with the experience of using a GDSS. An empirical study is reported to assess the user satisfaction of İTÜ – Web
GDSS in supporting distributed group. This research focuses on different types of user satisfaction in GDSS based group decision making: system satisfaction, process satisfaction, outcome, and GDSS satisfaction.
The remainder of the research report is organized as follows: the next section explains decision making; multi criteria decision analysis and the basic principles of AHP are described in the Sections 3 and 4. Section 5, description of the Decision Support Systems and different types of DSS are explained. Group decision making and different types of GDSS are explained in Section 6. Review of Web-based Decision Support System (Web DSS) and Web-based Group Decision Support System (Web GDSS) are in Section 7.
The Architecture and Design of İTÜ – Web based Group Decision Support System are explained in the Section 8. As research theory development and hypotheses are explained in the Section 9, research method is described in the Section 10. Section 11 provides results and discussion of the research. Conclusion and further research suggestions explained in the final section.
2. Decision Making
Decision making is the cognitive process of selecting from multiple alternatives. Every decision-making process has a final choice. Decision-making is a reasoning process which can be rational or irrational, and can be based on explicit assumptions or tacit assumptions. Decision making is an activity that lies at the heart of management. The assumption of a management role places an individual in the mainstream of an organization’s decision-making activity with authority to make decisions and to organize and develop the organization’s decision making capability. All the explicit or implicit actions of an organization are the result of management decision making. Decision making is a vital organizational activity.
Decision making is said to be a psychological construct. This means that although we can never "see" a decision, we can infer from observable behavior that a decision has been made. Therefore we conclude that a psychological event that we call "decision making" has occurred. It is a construction that imputes commitment to action. That is, based on observable actions, we assume that people have made a commitment to effect the action.
3. Multiple Criteria Decision Analysis (MCDA)
Managers are faced with problems in projects that are complex in their decision environments. The elements of the problems are numerous, and the interrelationships among the elements are extremely complicated. Relationships between elements of a problem may be highly nonlinear; changes in the elements may not be related by simple proportionality. Furthermore, human value and judgment systems are integral elements of project problems [40]. Therefore, the ability to make sound decisions is very important to the success of a project. In fact, Schuyler [66] makes it a skill that is certainly near the top of the list of project management skills, and notices that few of us have had formal training in decision making.
Multiple criteria decision-making (MCDM) approaches are major parts of decision theory and analysis. They seek to take explicit account of more than one criterion in supporting the decision process [6]. The aim of MCDM methods is to help decision-makers learn about the problems they face, learn about their own and other parties’ personal value systems, learn about organizational values and objectives, and through exploring these in the context of the problem, to guide them in identifying a preferred course of action [6, 22, 53, 72, 73 and 76]. In other words, MCDA is useful in circumstances which necessitate the consideration of different courses of action, which can not be evaluated by the measurement of a simple, single dimension [6]. Hwang and Yoon [31] published a comprehensive survey of multiple attribute decision making methods and applications. Two types of the problems that are common in the project management that best fit MCDA models are evaluation problems and design problems. The evaluation problem is concerned with the evaluation of, and possible choice between, discretely defined alternatives. The design problem is concerned with the identification of a preferred alternative from a potentially infinite set of alternatives implicitly defined by a set of constraints [5].
4. The Analytic Hierarchy Process (AHP)
It is believed that life is so complicated that to make decisions people need to think in a complex way. Complex problems usually have many related factors. Simple thinking leads to combinations of collections of ideas which give rise to a structure whose components are strands that are separate, but tangled. When people make their decisions on having an additional child, they would not probably list all the variables that are essential to this decision. In addition to this, people would not probably explicitly compare the significance of each variable. However, it can not be denied that some people are comparing and implicitly indicating preferences among different choices.
The Analytical Hierarchy Process (AHP) is a decision-aiding method developed by Saaty [55, 56, 58 and 62]. It aims at quantifying relative priorities for a given set of alternatives on a ratio scale, based on the judgment of the decision-maker, and stresses the importance of the intuitive judgments of a decision-maker as well as the consistency of the comparison of alternatives in the decision-making process [55]. Since a decision-maker bases judgments on knowledge and experience, then makes decisions accordingly, the AHP approach agrees well with the behavior of a decision-maker. The strength of this approach is that it organizes tangible and intangible factors in a systematic way, and provides a structured yet relatively simple solution to the decision-making problems [67]. In addition, by breaking a problem down in a logical fashion from the large, descending in gradual steps, to the smaller and smaller, one is able to connect, through simple paired comparison judgments, the small to the large.
The Analytic Hierarchy Process (AHP) is a multiple criteria decision-making tool that has been used in almost all the applications related with the decision-making. The Analytic Hierarchy process (AHP), which was developed by Thomas Saaty (1980), is a basic approach to decision making. The strength of the AHP method lies in its ability to structure a complex, multi-attribute, and multi-period problem hierarchically. The Analytic Hierarchy Process (AHP) [54, 56, 57, 61, 63, 64, and
75] is a theory for dealing with complex technological, economic, and socio-political problems. Its mathematical foundations are simple. Its purpose is to make a contribution towards unity in modeling real-world problems, away from the existing fragmentation where each problem tends to have specialized model and terminology. Its major assumptions are that the methods people use to pursue knowledge, to predict, and to control their world are relative, and that the goal that people seek, i.e., knowledge, is itself relative.
The Analytic Hierarchy Process (AHP) is designed to cope with both rational and intuitive judgments to select the best from a number of alternatives evaluated with respect to several criteria. In this process, the decision maker carries out simple pair-wise comparison judgments that are used then used to develop overall priorities for ranking the alternatives. Pair-wise comparisons of the elements, which are usually alternatives and attributes, can be established using a scale indicating the strength with which one element dominates another with respect to higher-level element. This scaling process can be translated into priority weights for comparison of elements. The AHP not only allows for inconsistency in the judgment but also provides a means to improve consistency.
In making decisions, people provide subjective judgments based on feelings and intuition rather than on well work-out logical reasoning. The AHP has been demonstrated to explicate the underlying mental process by which overall judgments are arrived at in situations where in a complexity of goals and criteria are involved. Basically, the AHP is a multi-objective multi-criteria decision-making approach which employs a pair-wise comparison procedure to arrive at a scale of preferences among sets of alternatives. To apply this approach, it is necessary to break down a complex unstructured problem into its component parts; arrange these parts, or variables, into a hierarchic order; assign numerical values to subjective judgments to determine which variables have the highest priority and should be acted upon to influence the outcome.
The breakdown involves structuring the problem as a hierarchy; this describes the ability to understand each part within its appropriate context. Without the hierarchy, each component could be well considered, but consideration would be sterile. Therefore, it can be said that incorporating the findings back into the framework
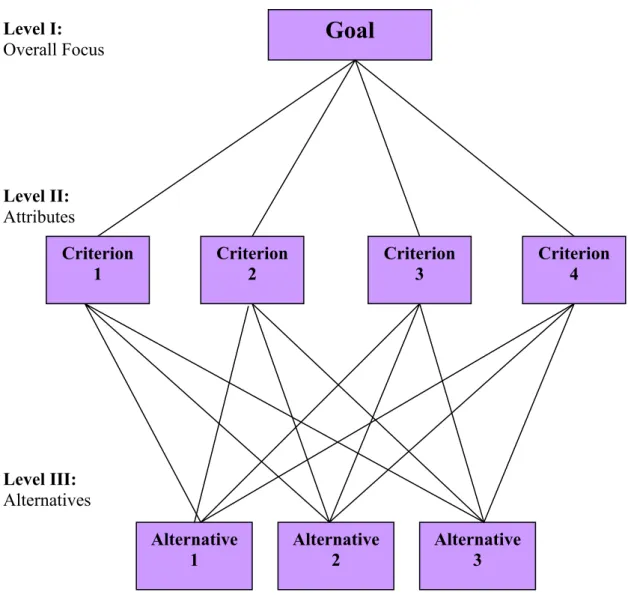
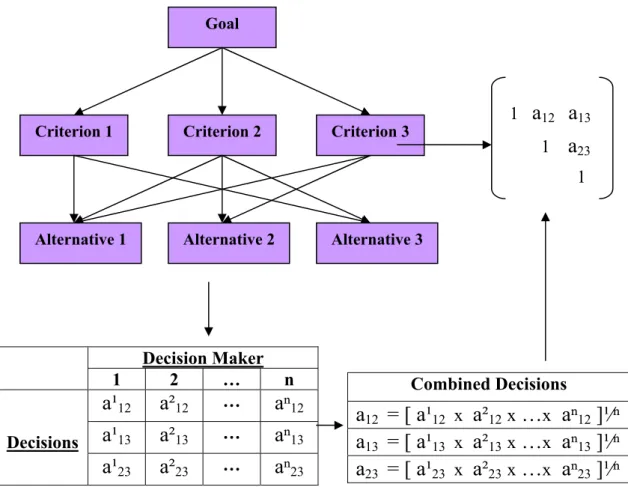
from which they are drawn would not be done. In the Figure 4.1, the simplest form used to structure a decision problem is a hierarchy consisting of three levels:
• The goal of the decision
• The criteria
• The alternatives.
Alternatives
Criteria
Goal
Figure 4.1 : A Three Level Hierarchy
Hierarchical decomposition of complex systems appears to be a basic device used by human mind to cope with diversity. One organizes the factors affecting the decision in gradual steps from the general, in the upper levels of the hierarchy, to particular, in the lower levels. The purpose of the structure is to make it possible to judge the importance of the elements in a given level with respect to some or all of the elements in the adjacent level above. Once the structuring is completed, the AHP is surprisingly simple to apply.
In the application of AHP, it has three fundamental processes: 1. Structuring a hierarchy,
2. Setting the priorities of active factors, 3. Calculating the results.
As it is mentioned before, the Analytic Hierarchy Process is a multiple criteria decision-making tool. This is an Eigen value approach to the pair-wise comparisons. It also provides a methodology to calibrate the numeric scale for the measurement of
quantitative as well as qualitative performances. The scales from 1/9 for ‘least valued than’, to 1 for ‘equal’, and to 9 for ‘absolutely more important than’ covering the entire spectrum of the comparison.
Some key and basic steps in this methodology are: 1. State the problem.
2. Broaden the objectives of the problem or consider all actors, objectives and its outcome.
3. Identify the criteria that influence the behavior.
4. Structure the problem in a hierarchy of different levels constituting goal, criteria, sub criteria and alternatives.
5. Compare each element in the corresponding level and calibrate them on the numerical scale. This requires n (n-1)/2 comparisons, where n is the number of elements with the considerations that diagonal elements are equal or ‘1’ and the other elements will simply be the reciprocals of the earlier comparisons.
6. Perform calculations to find the maximum Eigen value, consistency index CI, consistency ratio, and normalized values for each criteria/alternative.
7. If the maximum Eigen value, CI, and CR are satisfactory then decision is based on the normalized values; else the procedure is repeated till these values lie in a desired range.
AHP helps to incorporate a group consensus. Generally this consists of questionnaire for comparisons of each element and geometric mean to arrive at a final solution. The hierarchy method used in AHP has various advantages [55].
Common benefits of the AHP are that: 1. It is simple to use and understand.
2. It necessitates the construction of a hierarchy of attributes, sub attributes, alternatives, and so on, which facilitates communication of the problem and recommend solution.
3. It provides a unique means of quantifying judgmental consistency.
4.1. Construction of Hierarchy
It is believed that the most creative task in making a decision is deciding what factors to include in the hierarchic structure. When constructing hierarchies one must include enough relevant detail to represent the problem as thoroughly as possible, but not so thoroughly as to lose sensitivity to change in the elements. There are important issues while considering a hierarchy:
• considering the environment surrounding the problem,
• identifying the issues or attributes that one feels should contribute to the solution,
• who are the participants associated the problem.
Arranging the goals, attributes, issues, and stakeholders in a hierarchy serves two purposes:
1. it provides an overall view of the complex relationships inherent in the situation and in the judgment process,
2. it also allows the decision maker to assess whether he or she is comparing issues of the same order of magnitude.
The elements being compared should be homogeneous. The hierarchy does not need to be complete; that is, an element in a given level does not have to function as a criterion for all the elements in the level below. Thus a hierarchy can be divided into sub hierarchies sharing only a common topmost element. Further, a decision maker can insert or eliminate levels and elements as necessary to clarify the task of setting priorities or to sharpen the focus on one or more parts of the system. Elements that are of less immediate interest can be represented in general terms at the higher level of the hierarchy and elements of critical importance to the problem at hand can be developed in greater depth and specifity. The task of setting priorities requires that the criteria, the sub criteria, the properties or features of the alternatives be compared among themselves in relation to the elements of the next higher level.
It can not be denied that the basic principle to follow in creating the hierarchy structure is always to see if one can answer the following question: “Can we compare the elements on a lower level in terms of some or all the elements on the next higher level?”
A useful way to proceed is to work down from the goal as far as one can and then work up from the alternatives until the levels of the two processes are linked in such a way as to make comparison possible. Here are some suggestions for an elaborate design.
1. Identify an overall goal. What are you trying to accomplish? What is the main question?
2. Identify sub goals of the overall goal. If relevant, identify time horizons that affect the decision.
3. Identify criteria that must be satisfied in order to fulfill the sub goals of the overall goal.
4. Identify sub criteria under each criterion. Note that criteria or sub criteria may be specified in terms of ranges of values of parameters or in terms of verbal intensities such as high, medium, low.
5. Identify actors involved. 6. Identify actor goals. 7. Identify actor policies. 8. Identify options or outcomes.
9. Take the most preferred outcome and compare the ratio of benefits to costs of making the decision with those of not making it. Do the same when there are several alternatives from which to choose.
10.Do benefit/cost analysis using marginal values. Because people who deal with dominance hierarchies, ask which alternative yields the greatest benefit; for costs, which alternative costs the most.
4.2. Philosophy, Procedure and Application of the AHP
The Analytic Hierarchy Process is a general theory of measurement. It is used to derive ratio scales from both discrete and continuous paired comparisons in multilevel hierarchic structures. These comparisons may be taken from actual measurements or from a fundamental scale that reflects the relative strength of preferences and feelings. The AHP has a special concern with departure from consistency and measurement of this departure, and with dependence within and between groups of elements of its structure. In its general form, the AHP is a nonlinear framework for carrying out both deductive and inductive thinking. This is
made possible by taking several factors into consideration simultaneously, allowing for dependence and for feedback, and making numerical tradeoffs to arrive at a synthesis or conclusion.
Hierarchy, essentially, is a special system type; it depends on the assumption that the units, which became into light, may be grouped in different series, and elements in one group affect the factors in the other group. The elements in a group are assumed to be independent of each other. The structure of the hierarchies is linear levels that are differentiated from main goal to alternatives. In the Figure 4.2, a linear hierarchy structure is expressed [60].
...
......
component element...
Figure 4.2 : A Linear Hierarchy Structure
As it is figured out above, the hierarchy is a simple structure that is confronted in daily life. Hierarchy is a structure stone for the model of the problems. In the process of constituting the hierarchy structure, decision maker must prepare the model with respect to this basic structure. The hierarchy structure is, therefore, detailed and differentiated according to the goal of problem. In the Figure 4.3 and Figure 4.4, detailed hierarchy structure examples can be seen [50].
13
Goal
Criterion 1 Criterion 2 Criterion 3 Criterion 4 Level I: Overall Focus Alternative 1 Alternative 2 Level III: Alternatives Alternative 3 Level II: AttributesFigure 4.4 shows a typical four-level hierarchy applied to any problem. Note that, as always, the focus is at the top level and the alternatives are at the lowest level. If any of the sub attributes were further divided into sub-sub attributes, those sub-sub attributes would have constituted a new level. If one felt that the sub attributes are not necessary, that level could be eliminated, thereby making it a three-level problem.
14
Goal
Criterion
Criterion
Sub
Criterion
Sub
Criterion
Sub
Criterion
Sub
Criterion
Sub
Criterion
Sub
Criterion
Sub
Criterion
Sub
Criterion
Alternative
Alternative
Alternative
Alternative
Figure 4.4 : A Detailed Four Level Hierarchy Structure
LEVEL I: Overall Focus LEVEL III: Subattributes LEVEL IV: Alternatives LEVEL II: Attributes
Up to now, the relationship between the same level components is not considered as important in the hierarchic structure. Linear hierarchic structure is differentiated from main goal to alternatives. However, generally, the component parts at the same level are related to each other in real world. Therefore, this situation is expressed with the nonlinear network systems that are special structure for the hierarchic structure. A basic nonlinear network system is shown as in the Figure 4.5. [60].
...
..
..
...
Figure 4.5 : A Nonlinear Network Hierarchy Structure
It is believed that people have been concerned with the measurement of both physical and psychological events. Physical means the field of tangible events that people constitute some kind of objective reality outside the individual conducting the
measurement. However, in contrast, psychological events mean the field of intangibles, which comprise the subjective ideas, feelings, and beliefs of the individual and society as a whole. The AHP is a method that can deal with establishing measures in both physical and social domains.
In using the AHP to model a problem, one needs a hierarchic or a network structure to represent that problem, as well as pair-wise comparisons to establish relations with the structure. In particular, there has been special effort in order to characterize the matrices that are resulted in comparisons. Due to the need for a variety of judgments, there has also been considerable work done to deal with the synthesizing group judgments [59].
The structure that is generally composed of dependent relations in models helps to analyze the relationships between the choices with a simple logical algorithm. It can not be denied that any component is absolutely related to prior level component in any network system. Although, the reciprocal influence of components at the same level is internal consistency, the interaction between components at the different levels is called as external consistency.
In the literature, there is no specified or given procedure for the determination of the goal, criteria, and activities to construct a hierarchy structure that is first step analytic hierarchy process. The steps, which are maintained, depend on the goal that is focused to decompose the complexity of system. In developing a physical model formula, the methods that include the system as a whole may be located in the design methods. In this situation, therefore, the steps may become ineffective while constructing hierarchical structure. Although there have been difficulties in process and concept, construction of a hierarchy structure has advantages as below:
• It is a uniform and elastic structure.
• Natural systems can be stated in this structure.
• The effect of any changes in the upper level on the lower level factors. can be easily seen
• Analyzing lower level factors is a sufficient and required condition to achieve main goal.
4.3. Prioritization of Choices
A hierarchy structure is a mathematical and structural demonstration of real life problems with the least failure. Analytic hierarchy process is a quantitative method that shows the relationships among all of the factors under the established goal. Prioritization is a determination of relative importance of pair-wise comparison between all level elements according to the question-answer session. In this step; the main factors that can be considered are the determination of factors’ relative importance and the determination of the effects of these importances on main goal. The main problem in this step is to verify the fundamental scale for the measurement of comparisons before constituting pair-wise comparison matrices.
4.3.1. Measurement Scale
The measurement scale during the process of factors’ prioritization is very important. It is considered that prioritization is established according to this fundamental scale. Any measurement scale is made up of three elements:
• objects cluster,
• numbers cluster,
• matching objects to numbers.
Unit system that contains all numbers in the range of scale is used in the standard scales. Due to the fact that it prevents the complexity of interpretation of numbers that are in the measurement scale, unit systems are used. Not only do standard scales establish the relationship between the numbers that are from measurement, but also do standard scales minimize the failure which can be occurred from arbitrary scales. Numerical calculations in a given standard scales are different according to the condition that has been in. When the real problem has been faced with, there is not any established procedure or algorithm in order to make numerical calculations in any standard scale. The same numerical measurements in different scales have different meanings. That is why; it describes the importance of scale that has been used in a given situation. In this manner, standard scales help to understand the meaning of measurement, not the measurement itself.
4.3.1.1. Absolute and Relative Measurement
It is argued that there are two kinds of comparisons that human make: absolute and relative. In absolute comparisons, alternatives are compared with a standard or baseline which exists in one’s memory and has been developed through experience. In relative comparisons, alternatives are compared in pairs according to a common attribute. The AHP has been used in both types of comparisons to derive ratio scales of elements. These scales are called as absolute and relative measurement scales. Absolute measurement is the comparison between the values taken from scales as a unit and the other measurement values. Before preparing the scale, unit value must be determined. In general, scale range is verified before the measurement. Decision maker establishes the unit value that represents the general scale. Absolute measurement is applied to rank the alternatives in terms of either the criteria or the ratings (intensities) of the criteria. After setting priorities for the criteria or sub criteria (if there are any), pair-wise comparisons are also made between the ratings themselves to set priorities for them under each criterion and dividing each of their priorities by the largest rated intensity to get the ideal intensity. Finally, alternatives are scored by checking off their respective ratings under each criterion and summing these ratings for all the criteria. This produces a ratio scale score for the alternative. The scores obtained of the alternatives can in the end be normalized by dividing each one by their sum.
In multi-attribute decision making problems, another scale that has been used is relative scales. Relative measurement
w
i, i=1,…, n, of each of n elements is a ratioscale of values assigned to that element and derived by comparing it in pairs with the others. In paired comparisons two elements i and j are compare with each other with respect to a property they have in common. The smaller i is used as the unit and the larger j is estimated as a multiple of that unit in the form
(
w
i/ w
j) / 1
where the ratiow
i/ w
j is taken from a fundamental scale of absolute values. There are two types ofrelative measurement that are mentioned in the literature. The first one is called normalization which is achieved by dividing measurement by general sum. The second on is priority scale (fundamental scale) that is generating from evaluated criteria with respect to main goal after the comparisons that have been made. The relationship between the criteria is committed to the importance of one criterion on
the other criterion. Calculated ratio from the measurements and established priority order are fundamentals of the Analytic Hierarchy Process.
4.3.1.2. Fundamental or Priority Scale
Paired comparison judgments in the AHP are applied to pairs of homogeneous elements. Prioritization process can be established by weighting different computations for all of the criteria after taking goal-input ratio of calculated measurement into account. Therefore, it can be said that prioritization scale is a principle of multi-attribute decision making models. In AHP, measurements are monotonously transferred into priority scale. Priority scales being talked of rely on ordering with respect to the choice and the importance of the measurement on main goal for each different measurement. Fundamental scales are needed to determine the priority and choices of each goal to criteria, and each criterion to alternatives.
To convert the measurement values to different scales put forth the differences between two basic scales for consideration. Relative scale is made up of certain number of objects cluster for anyone. In other words, any relative scale constitutes a principal for prioritization procedure about the model that has been studied and constructed by observing and judgments. Therefore, fundamental scale used in AHP was found by Thomas L. Saaty as you can see in Table 4.1 [58].When hierarchical structure and prioritization are established, all measurements can be expressed as comparison matrix before the solution of AHP problem. Then, model problem can be solved with the help of matrixes that are comparisons of factors. The degree of preference or intensity of the decision maker in the choice for each pair-wise comparison is quantified on a scale of 1 to 9, and these quantities are placed in a matrix of comparisons.
Table 4.1: Fundamental Scale
Intensity
of Importance Definition Explanation
1 Equal importance Two activities contribute equally to
the objective
2 Weak
3 Moderate importance Experience and judgment slightly
favor one activity over another
4 Moderate plus
5 Strong importance Experience and judgment strongly
favor one activity over another
6 Strong plus
7 Very strong and demonstrated
importance
An activity is favored very strongly over another; its dominance demonstrated in practice.
8 Very very Strong
9 Extreme importance The evidence favoring one activity over another is of the highest possible order of affirmation
Reciprocals of above
If activity i has one of the above
nonzero numbers assigned to it when compared with activity j,
then j has the reciprocal value when compared with i.
A reasonable assumption
Rationals Ratios arising from the scale
If consistency were to be forced by obtaining n numerical values to span
the matrix
4.4. Comparison Matrix and Solutions
Analytic Hierarchy Process requires having judgment on factors that affect decision making after constructing the hierarchy. The effective way of evaluating judgment intensities is pair-wise comparison which means that pair components can be evaluated with respect to only one criterion. While pair-wise comparison is processed according to one criterion, any other criterion does not be cared about. Assume that there are n stones, A1,…, An , whose weights
w
1,…,
w
n,, respectively,are known. Let us form the matrix A of pair-wise ratios whose rows give the ratios of the weights of each stone with respect to all others.
Then, pair-wise comparison matrix is formed as shown in Table 4.2. After obtaining pair-wise judgments, the next step is the computation of a vector of priorities or weighting of elements in the matrix. In terms of matrix algebra, this consists of calculating the “principal vector” (eigenvector) of the matrix, then normalizing it to sum to 1.0 or 100%. In principal, AHP relies on taking the components of one level
and only one component of the upper level as data; creating a similar matrix, which is a pair-wise comparison with respect to the relative influence of all components of the lower level on the component of upper level, as shown in Table 4.2; calculating eigenvector that has maximum Eigen value of the matrix.
Table 4.2: Pair-wise Comparison Matrix A1 A2 … An
A1 w1/w1 w1/w2 … w1/wn
A2 w2/w1 w2/w2 … w2/w1
… … … … …
An wn/w1 wn/w2 … wn/wn
Although, principal vector, eigenvector, provides the determination of priority series, Eigen value provides the consistency of pair-wise comparisons. By comparing the weight of
w
i tow
jsequentially, pair-wise comparison matrix A is obtained.Mathematical expression of this relationship is
w
i/ w
j= a
ij (i, j = 1, 2, …n) (4.1)In this manner, all
a
ijvalues of the matrix are positive, equal tow
i/w
jvalues, andhave reciprocal values as
a
ji= 1/ a
ij.
Under this circumstances, comparison matrix A is transformed as below; 1
a
ij …….. ……..a
in1/
a
ij1
:A
=
: :: : 1/
a
in …….. …….. …….. 1At the same time, the matrix A =
(
a
ij)
is said to be consistent and its principal Eigenvalue is equal to n if the expression (4.2) is obtained.
a
jk= a
ik/ a
ij (4.2)However, the relationship can not be established in real life. One of the main reasons for this is that people cannot give precise values of comparisons. Another reason is that human can make a mistake about judgments. If there is not a scale at all in the case of some measuring devices, precise values of
w
i/ w
jcan not be given, but onlyestimates are given.When ideal solution is found as if
a
ij value equals to value ofw
i/ w
j,
these equations can be found as below:1 i
w
w
*w
1= w
i,
2 iw
w
*w
2= w
i…….
n iw
w
*w
1= w
i(4.3)
But, in general, values are approximately equal to
w
i, not absolutely equal tow
i.Therefore, equalizing
w
i to average of these values can be thought as logical. Insteadof ideal condition of
w
i/w
j=
a
ij,
using ageneral approach ofw
i= average (a
i1, a
i2… a
in)
can be more realistic.From this moment, expression (4.4) is obtained.
w
i=
n
1
na
w
j
j ij∑
=1j = 1, 2, …….n
(4.4)In the event
a
ij is estimated better, the value will be really closer to the value ofw
i/w
j. How good is the principal eigenvector estimate w? By solving this problem,w
= (w
1,…, w
n)
T
, o
btaining the matrix whose entries are
w
i/w
j is a consistentmatrix. Consistent matrix is consistent estimate of the matrix A. The original matrix itself A, needs not to be consistent. In fact, the entries of A need not even be transitive.It is maintained that the factor is a measure of the error due to consistency. When
a
ij deviates from ideal value, n must also be changed in order to havewell-adjusted expression (4.4). Thus, “maximum eigen value”
(
λ
max)
is used instead of n.
It turns out that A is consistent if and only if
λ
max=
n
and alwaysλ
max ≥n
.
In brief,if it deviates from ideal consistency condition,
λ
max is closer to n. In ideal condition,λ
max equals to n and equation (4.4) becomes as equation (4.5).w
i=
1
maxλ
a
w
j
n j ij∑
=1j = 1, 2, …….
n (4.5)As a result of generalizing the equations;
Aw
=
λ
maxw
(4.6)
is obtained. Therefore, finding relative importance vector
w
in order to realize the expression ofAw
=
λ
maxw
by starting from A, is the solution of the model.Pair-wise comparisons matrix is calculated for each level and for the criteria of these levels; levels and criteria create the problem. After these computations, sub criteria or alternatives, which are effective on a main goal with the help of the established matrices, are calculated.
There are two concepts which are being talked of solution steps above. These are the principal eigenvector and consistency.
4.4.1. Eigenvector
The solution algorithm of the Analytic Hierarchy Process depends on principal vector or eigenvector. The computation of a vector of priorities or weighting of elements in the matrix means that this consists of calculating the principal vector (eigenvector) of the matrix, and then normalizing it to sum to 1.0 or 100% in terms of matrix algebra. Standard programs are available for computing principal vector of a matrix.
An easy way to get an approximation to the priorities is to normalize the geometric means of the rows. This result coincides with the eigenvector for n ≤ 3.
A second way to obtain an approximation is by normalizing the elements in each column of the judgment matrix and averaging over each row: Divide the elements of each column by the sum of that (i.e. normalize the column) and then add the
elements in each resulting row and divide this sum by the number of elements in the row.
A simple way to obtain the exact value (or an estimate) of
λ
max when the exact value(or an estimate) of w is available in normalized form is to add the columns of A and multiply the resulting vector by the priority vector w.
4.4.2. Consistency
Consistency ratio (C.R.) is an approximate mathematical indicator of the consistency of pair-wise comparisons. It is a function of what is called the “maximum Eigen value” and size of the matrix called a “consistency index” which is then compared against similar values if the pair-wise comparisons had been merely random that is called “random index”. If the ratio of the consistency index to the random index, which is called “consistency ratio”, is no greater than 0.1, it is suggested that the consistency is generally quite acceptable for pragmatic purposes.
The consistency of comparison matrix and the solution algorithm of the model are also depending on Eigen value and eigenvector. It is believed that there is a number of ways to derive the vector of priorities from the matrix
(a
ij)
[58]. Emphasizing onconsistency leads to the Eigen value formulation
Aw=nw
. Suppose that the prioritiesw= (w
1,…,w
n)
with respect to a single criterion are known. The matrix ofratio comparisons can be formed and multiplied by on the right by w to obtain
nw
as follows:w
1/w
1w
1/w
2 …w
1/w
nw
2/w
1w
2/w
2 …w
2/w
1 … … … …w
n/w
1w
n/w
2…w
n/w
nw
1w
2 : :w
n=
n
w
1w
2 : :w
nIf
a
ij represents the importance of alternative i over alternative janda
jk represents theimportance of alternative j over alternative k and
a
ik,
the importance of alternative iover alternative k, must equal
a
ija
jk ora
ik= a
ija
jk (4.7)24
for the judgments to be consistent. To simplify the notation, it can be written Aw= λmax w where A is the matrix of pair wise comparisons.
The solution is obtained by raising the matrix to a sufficiently large power, then summing over the rows and normalizing to obtain the priority vector
w=
(w
1,…,w
n)
. The process is stopped when the difference between components of thepriority vector obtained at the kth power and (k+1)st power is less than some predetermined small value. The vector of priorities is the derived scale associated with the matrix of comparisons. It is assigned in this scale the value zero to an element that is not comparable with the elements considered.
It is important to note that the principal eigenvector is well estimated. Note that if w=
(w
1,…,w
n)
T , by solving the problem, is obtained, the matrix whose entries arew
i/w
j isa consistent matrix which is consistent estimate of the matrix A. The originalmatrix itself A, need not be consistent. In fact, the entries of A need not even be transitive; i.e., A1 may be preferred to A2 and A2 to A3 but A3 may be preferred to A1. It turns out that A is consistent if and only if
λ
max=
n
and that alwaysλ
max ≥n
.λ
i=
n
=>
λ
max=
n
(4.8)
The consistency index is obtained from a series of calculations. First multiply the matrix of pair-wise comparisons, call it matrix [A], by the principal vector or priority weights calling as matrix [B] to get a new vector [C].
[A] x [B] = [C]
(4.9)Next, divide each element in vector [C] by its corresponding element in vector [B] to find a new vector [D].
[C] ÷ [B] = [D]
(4.10)
Now, average the numbers in vector [D]. This is an approximation of what is called the “maximum Eigen value”, denoted as
λ
max.It is interesting to note that
λ
max–
n
/ (n – 1)
is the variance of the error incurred inestimating
a
ij. The measure of inconsistency can be used to improve the consistency 25of judgments. As a measure of deviation from consistency, “consistency index” is used:
C.I. =
λ
max–
n
/ (n – 1)
(4.11)
The “consistency ratio” is obtained by comparing the C.I. with the appropriate one of the following set of numbers seen in Table 4.3 each of which is an average random consistency index derived from a sample of randomly generated reciprocal matrices using the scale 1/9, 1/8, …, 1, …, 8, 9. If it is not less than 0.10, the problem must be studied and judgments must be revised again. Random indexes (R.I.) for various matrix sizes, n, have been approximated based on large numbers of simulation runs as in Table 4.3.
C.R. = C.I. / R.I
.
(4.12)
Consistency ratio can be calculated by dividing consistency index to random index for specified matrix size.
Table 4.3: Average Random Consistency Index (R.I)
n 1 2 3 4 5 6 7 8 9 10 11 …
R.I. 0.00 0.00 0.58 0.90 1.12 1.24 1.32 1.41 1.45 1.49 1.51 …
Based on Saaty’s empirical suggestions that a C.R = 0.10 is acceptable, it would be concluded that the foregoing pair-wise comparisons to obtain attribute weights are reasonably consistent.
5. Decision Support Systems (DSS)
Decision makers’ requirements are met with different types of information systems. Management information systems, database management systems (DBMS), on-line analytic processing (OLAP) are just a few examples of systems that provide information used in decision making. It has been suggested that DSS address some or even all of the key requirements.
5.1. Definitions of DSS
Decision support systems (DSS) are computer-based systems used to assist and aid decision makers in their decision making processes. Because of the continuously growing number of different types of computer-based systems, it is important to distinguish among them and position DSSs within the family of information systems used by decision makers. Little (1970) [41], in one of the earliest works on computer-based decision support, proposed that a DSS is “a model-based set of procedures for processing data and judgments to assist a manager in his decision making”.
From the inception of DSSs, it has become clear that they aid and assist decision makers but do not replace them. This feature distinguishes a DSS from other IS. Some IS replace decision makers in well structured, routine and recurring decisions; others are used to verify, record or extract data. Keen and Scott-Morton (1978)[34], note that DSS play a different role and propose the following definition:
“Decision support systems couple the intellectual resources of individuals with the capabilities of computers to improve the quality of decisions. It is a computer-based support for management decision makers who deal with semi-structured problems.”
Moore and Chang (1980) [44], define a DSS in terms of its features and use. They view a DSS as a system that is extendable, capable of supporting ad hoc analysis and
decision modeling, oriented towards future planning, and of being used at irregular, unplanned intervals.
Bonzeck, Holsapple and Whinston (1980) [10], define DSS in terms of its components. A generic DSS consists of a language system for communication between the user and the DSS, a knowledge system containing problem domain knowledge which consists of data and procedures, and a problem processing system consisting of programs capable of solving decision problems.
The difficulties with defining DSSs were recognized already at the early stage of their introduction. Sprague and Carlson note that some definitions are so restrictive that only a few existing systems satisfy them, while other definitions are broad so that they include almost all computer systems. Systems for extracting, summarizing and displaying data are also viewed as DSSs (McNurlin and Sprague, 1993) [43].
5.2. Characteristics of DSS
The development and implementation of decision support systems (DSS) require knowledge and understanding of managerial decision making, levels of reasoning and problem solving and roles of managers in organizations [43].
These prerequisites for using computerized decision support already constitute a challenge for those contemplating the use of information technology for project management. The mandate for a better future is uncontestable but formulating this mandate in a tractable manner is non-trivial. This justifies the use of any support methodology- computerized or not- to help authorities involved in project management sort out all the decision variables and parameters, problem solving heuristics, and appreciate the impacts of potential policy actions.
The process of developing a DSS often revolves around five building blocks:
1. Information Resource Management: In software engineering terms, input data are required for decision analysis and resolution; output data are generated and presented to decision makers for policy making. Effective management of these data constitutes a first major task of any decision support tool.
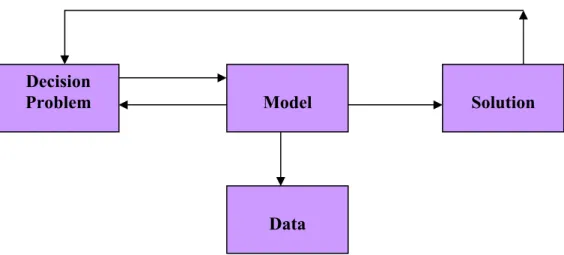
2. Model Management: A model is an abstraction of reality whose purpose is to help decision makers focus on the main elements of a problem.
Multiple objective optimizations under constraints are a classic modeling approach in management science. Qualitative reasoning, expert heuristics, and data mining are alternative methods to formulate decisions. Given a decision problem, the challenge of DSS is to find the best decision method(s) able to suggest a satisfying solution to policy makers.
3. Interactive Problem Solving: Direct interaction between the DSS and its user allows for a more responsive and user-centered view of the problem. A good DSS is one that provides the right information to the right person at the right time with full transparency. In addition, DSS should provide some cognitive feedback to decision makers by helping them comprehend dynamic changes in the underlying assumptions.
4. Communications and Teamwork Support: Decision making, more often than not, involves more than one decision maker and support for communication and coordination is an important dimension of DSS. Support for information exchange, federated organizational memory, group decision and negotiation is an integral component of organizational decision support.
5. DSS as Non-Human Co-workers: In a tightly connected networked world, we postulate a working scenario in which humans will team up with computers as co-workers to optimize execution of business decisions [47]. We envision a new social structure that emerges from the interaction of individuals – both human and non-humans – operating in a goal-oriented environment under rules that place only bounded demands on each individual’s information and computational capacity [11].
The immediate value of using these five building blocks is to help the DSS users improve their decision outcomes. DSS should achieve its support mission by lending a hand to its users: More quality input data are expected to provide a more complete assessment of the problem situation and a richer set of decision alternatives. More sophisticated decision algorithms are expected to help decision makers find solutions that could not have been found otherwise. Expansive trade-off analyses and interactive simulation are expected to provide decision makers with further insights. Communications and group decision support are expected to increase the chance of
![Table 7.1 also describes the comparison between DSS, Group DSS, and Web DSS [37].](https://thumb-us.123doks.com/thumbv2/123dok_us/10933775.2982105/64.892.168.785.589.858/table-describes-comparison-dss-group-dss-web-dss.webp)