Al-Jabar: Jurnal Pendidikan Matematika Vol. 10, No. 1, 2019, Hal 111 - 124
111
An Investigation On Pre-Service Elementary School Teachers’ Mathematics Anxiety Lina Puspitaning Rahayu1, Ali Mustadi2, Petrus Sarjiman3
1,2Pendidikan Dasar, Program Pascasarjana, Universitas Negeri Yogyakarta 3Fakultas Ilmu Pendidikan, Universitas Negeri Yogyakarta
1Correspondence Address; linapuspitaning.2018@student.uny.ac.id
Abstract
The aims of this study are to (1) determine the level of mathematics anxiety (MA) of pre-service elementary school teachers, (2) compare the MA among pre-service elementary school teachers in terms of gender, and (3) compare the MA among pre-service elementary school teachers in terms of the semester. This research employed a quantitative approach with comparative research design. In addition, the samples were 498 pre-service elementary school teachers. The instrument used is the Revised-Mathematics Anxiety Survey (R-MANX) developed by Bursal and Paznokas (2006). R-MANX consists of 30 statement of a 5-point Likert scale. The data analysis was processed using one-way ANOVA assisted by SPSS version 23. The findings reveal that the MA of pre-service elementary school teachers is high. Further, it is revealed that there is no significant MA difference between male and female pre-service elementary school teachers. Also, there is no significance of MA difference among pre-service elementary school teachers who are in 2nd semester, 4th semester, and 6th semester. Therefore, the results of this research imply that MA can affect pedagogical competence of a teacher and it could have an impact on the way the teacher manages the class.
Keywords: Elementary Pre-Service Teachers; Mathematics; Mathematics Anxiety
INTRODUCTION
Mathematics is one of the subjects taught at all levels of education and is the subject that mostly raises anxiety for many students starting from the elementary school level (Ramirez, Chang, Maloney, Levine, & Beilock, 2016; Ramirez, Gunderson, Levine, & Beilock, 2013; Sorvo et al., 2019), secondary schools (Birgin, Baloglu, Çatlioglu, & Gürbüz, 2010; Lague, Eakin, & Dykeman, 2019) to universities (Haynes, Mullins, & Stein, 2004; Nunez-Pena, Suarez-Pellicioni, & Bono, 2013). Ashcraft (2002) says that mathematics anxiety (MA) is generally defined as feeling tense or fear that disrupts performance in mathematics. A similar opinion is expressed by Richardson & Suinn (1972) who say that mathematics anxiety (MA) is defined as feeling tense and anxious that interferes when someone is manipulating numbers and solving mathematical problems in a variety of daily lives and academic situations. MA experienced by these students includes 2 kinds of anxieties, namely MA in everyday life and MA in dealing with academic situations in educational institutions (Bursal & Paznokas, 2006). The MA experienced by students can be caused by various factors. Ashcraft (2002) in his research explained that the teachers’ teaching styles are predicted to be one of the factors that cause the MA. This opinion is reinforced by the research by Finlayson (2014) which explains that the causes of MA in pre-service mathematics teachers are a feeling of lack of confidence and fear of failure, rigid teaching style, ineffective learning practices, and lack of students' involvement in learning. Other things like fear in answering the right questions and math tests are also causes of MA experienced by some students (Harper & Daane, 1998).
Al-Jabar: Jurnal Pendidikan Matematika Vol. 10, No. 1, 2019, Hal 111 - 124
112
If the causes of MA continue to grow and are not handled properly, it will have an impact on low mathematical performance (Galla & Wood, 2012; Hill et al., 2016; Nunez-Pena et al., 2013; Reali, Jiménez-Leal, Maldonado-Carreño, Devine, & Szücs, 2016; Schillinger, Vogel, Diedrich, & Grabner, 2018), students’ mathematics achievement is getting lower, and even job prospects related to mathematics could be getting worst (Ramirez et al., 2016). Moreover, in the modern world, as it is today, everyone is required to understand and apply mathematical concepts to solve various contextual problems in each of their lives (OECD, 2017). Such is the urgency of why the MA needs to be handled properly.
The researcher suspects the teacher as someone who is responsible for handling the MA considering the way the teacher teaches is one of the factors that causes it. In fact, in the field, the teachers also experience MA (Bush, 1989; Hembree, 1990; Ramirez, Hooper, Kersting, Ferguson, & Yeager, 2018). Research reveals that teachers who experience MA will transmit the MA to their students (Beilock, Gunderson, Ramirez, & Levine, 2010; Bekdemir, 2010; Geist, 2010; Ramirez et al., 2018; Stoehr, 2017; Vinson, 2001). Teachers who experience anxiety tend not to have confidence in their ability to manage their classrooms, become stressed and angry at student behavior, and are pessimistic about students' abilities (Santrock, 2011, p. 451). This self-confidence makes teachers tend to be angry when students ask for help in working on math problems (Cornell, 1999). Students who continue to be scolded by their teacher over time will show dislike of mathematics and furthermore will cause them to have the MA themselves.
The MA experienced by these teachers is related to the learning period when they are prepared to become pre-service teachers. Studies reveal that the teaching they receive in mathematics during their study seems to play an important role in shaping their attitudes towards mathematics (Gresham, 2009). Therefore, teacher education courses have a responsibility to help the pre-service teachers in reducing the MA (Gautreau, Brye, & Lunceford, 2016; Gresham & Burleigh, 2018; Hurst & Cooke, 2014; Peker & Ertekin, 2011; Wilkins, 2009), thus creating a positive attitude for the pre-service teachers towards mathematics.
Based on the explanation of the MA experienced by the teachers, a study is needed to determine the level of MA experienced by the pre-service elementary school (SD) teachers. If it is known, the university in conducting the teacher education programs can carry out actions to reduce MA for the pre-service teachers. This study has several objectives, namely.
1) Knowing the MA level of pre-service elementary school teachers.
2) Knowing the difference between the MA of the pre-service elementary school teachers in terms of gender.
3) Knowing the difference in MA of the pre-service elementary school teachers in terms of the semester.
Based on the online research that has been conducted by the researcher, there has not been a lot of studies that discuss the pre-service elementary school teachers in Indonesia. Some
Al-Jabar: Jurnal Pendidikan Matematika Vol. 10, No. 1, 2019, Hal 111 - 124
113
studies discuss the MA but the research subject used is not the elementary school teachers and take place abroad, not in Indonesia. The research in question will be explained below.
First, descriptive qualitative research conducted by Rizta & Antari (2019). This research was conducted in Indonesia and the results of the study show that the most frequently occurs MA in pre-service mathematics teachers is anxiety on math tests, mathematics assignments, and numerical calculations. The difference between this research and the one conducted by Rizta & Antari is the subject of the research and subject matter discussed in the study. The research subjects used in the Rizta & Antari’s study are the students of pre-service middle school mathematics teachers while the subjects of this research are pre-service elementary school teachers. The next difference is the subject discussed in the study. Research conducted by Rizta & Antari discusses the factors that cause the anxiety level of pre-service teachers qualitatively while this research discusses the comparison of MA levels seen in terms of gender and semester level.
Second, research conducted by Çatlioglu, Birgin, Serkan, & Gürbüz (2009). It investigates the MA levels as well as the differences in MA among pre-service elementary school teachers in Turkey by gender and semester level. That research is similar to this research but the place of implementation is not in Indonesia. Most studies on MA are conducted abroad. It is still rare for studies to discuss the comparison of MA in terms of gender and semester level in Indonesia. Therefore, this study is intended to compare the MA in terms of gender and semester level in Indonesia.
Third, research conducted byGürbüz & Yıldırım (2016). The purpose of this research is to determine the MA level for elementary school teachers in Turkey and to investigate the effect of a number of variables on MA levels. The study samples are elementary school teachers in Turkey, not pre-service elementary school teachers. In contrast to the research conducted by Gürbüz & Yıldırım, this study intends to explore the MA of pre-service elementary school teachers in Indonesia. If the subject of the Gürbüz & Yıldırım research is the elementary school teachers who already have teaching experience, then the subject of this research is pre-service elementary school teachers who are still university students. Another difference is the subject discussed in the study if the Gürbüz & Yıldırım research discusses the influence of several variables on the MA, this research discusses the comparison of MA in terms of gender and semester level.
THE RESEARCH METHODS
This study uses quantitative comparative methods. The research subjects were the students of PGSD (Elementary School Teacher Education) Study Program of 2016-2018 at a university in Yogyakarta, Indonesia. Samples were selected using proportional stratified sampling. This sampling technique was used because the number of male and female in the population were imbalanced. The design in this study is as follows:
Al-Jabar: Jurnal Pendidikan Matematika Vol. 10, No. 1, 2019, Hal 111 - 124
114
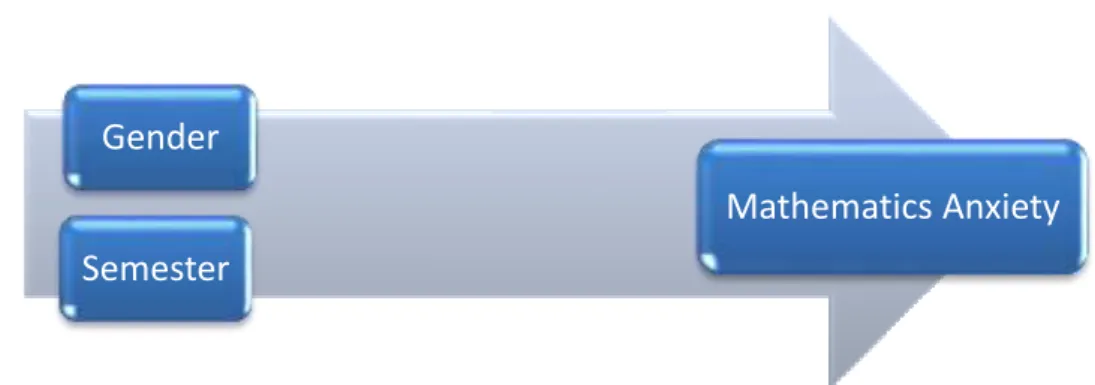
Figure 1. Research of Design
There were more female students than male students. The samples of this study were 498 students consisting of 408 females, 90 males, 172 2nd semester students, 167 4th semester students, and 159 6th semester students. The distribution of research samples is described in Table 1.
Table 1. Distribution of PGSD Students Based on Gender and Semester
Gender
Semester
2nd Semester 4th Semester 6th Semester Total
f % f % f % f %
Female 138 80.2 136 81.4 134 84.3 408 81.9 Male 34 19.8 31 18,6 25 15, 7 90 18.1 Total 172 100 167 100 159 100 498 100
Data on the pre-service elementary school teachers were collected using the Revised-Mathematics Anxiety Survey (R-MANX) developed by Bursal and Paznokas (2006). R-MANX consists of 30 statement items using a 5-point Likert scale with a scale of 1 (never) - 5 (always). The scale consists of 23 negative items and 7 positive items. The highest score of R-MANX is 150 and the lowest score is 30. The higher the R-MANX score, the higher the level of MA for the pre-service elementary school teachers. The reliability coefficient Cronbach Alpha on the R-MANX scale is 0.90 (Bursal & Paznokas, 2006).
Before the data was analyzed, the scores of R-MANX items number 4, 9, 14, 17, 19, 24, 29 must be reversed to produce consistent values between positive and negative items. If the participant gets a score of 1 (lowest), the score must be changed to the highest score that is 5. Score 2 is changed to 4, score 3 is unchanged, score 4 is changed to 2, and score 5 is changed to 1.
Data that has been obtained will be analyzed quantitatively using the Statistical Package for Social Sciences (SPSS) program 23. The pre-service elementary school teachers’ MA is grouped into four groups: low MA group, medium MA group, high MA group, and very high MA group. This group classification is made using the quartile of the MA scores of pre-service elementary school teachers. The grouping of MA is presented in table 2.Classifying MA
Gender
Semester
Al-Jabar: Jurnal Pendidikan Matematika Vol. 10, No. 1, 2019, Hal 111 - 124
115
Table 2. The Classification Criteria of the Pre-service Elementary School Teachers
Interval Value Category
X ≤ K1 Low
K1 <X ≤ K2 Medium
K2 <X ≤ K3 High
X> K3 Very High
The pre-service elementary school teachers MA scores below or equal to quartile 1 (X ≤ K1) Indicating a low MA group. The scores between quartiles 1 and 2 (K1 < X ≤ K2) indicate a medium MA group. The scores between quartile 2 and 3 (K2 < X ≤ K3) indicate a high MA
group. The score above quartile 3 (X > K3) indicate a very high MA group.
Furthermore, to see the mean difference of R-MANX from each gender group and semester level group, one-way ANOVA was used. Before one-way ANOVA was done, prerequisite tests were required in the form of normality test and homogeneity test. After doing both tests, hypothesis testing was carried out using the ANOVA test. The hypothesis proposed to examine the differences in MA based on gender is as follows.
H0: There is no significant difference in MA between female and male pre-service elementary school teachers.
H1: There is a significant difference in MA between female and male pre-service elementary school teachers.
The hypothesis proposed to test the differences in MA based on semester level is as follows. H0: There is no significant difference in MA between pre-service elementary school teachers
in the 2nd semester, 4th semester, and 6th semester.
H1: There is a significant difference in MA between pre-service elementary school teachers in the 2nd semester, 4th semester, and 6th semester.
The conclusion is that, if the significance value is <0.05 then H0 is rejected. Meanwhile, if the significance value is > 0.05 then H0 is accepted.
THE RESULTS OF THE RESEARCH AND THE DISCUSSION The MA Level of the Pre-service Elementary School Teachers
The results of the descriptive analysis of MA scores of the pre-service elementary school teachers in Yogyakarta can be seen in Table 3.
Table 3. Descriptive Statistics Score of Pre-service Elementary School Teachers’ MA
Statistics Value N 498 Mean 73.52 Median 73, 00 Mode 65.00 Std. Deviation 13.75 Minimum 39.00 Maximum 114.00 Quartile 1 64.00 Quartile 2 73.00 Quartile 3 83.00
Al-Jabar: Jurnal Pendidikan Matematika Vol. 10, No. 1, 2019, Hal 111 - 124
116
The results of the grouping of pre-service elementary school teachers’ MA can be seen in Table 4.
Table 4. Distribution of Frequency and Percentage of Pre-service Elementary School Teachers’ MA
Interval Value Category f %
X ≤ 64 Low 132 26.51%
64 <X ≤ 73 Medium 119 23.89% 73 <X ≤ 83 Height 126 25.30% X> 83 Very High 121 24.30%
In Table 3, the average MA of the pre-service elementary school teachers is 73.52. Based on the categories found in Table 4, the average MA of the pre-service elementary school teachers is in the high category. From the results of the descriptive statistics calculation, it is known that the average MA level falls into the high MA category.
The results of the study show that the MA level of the pre-service elementary school teachers is at a high level. The results of this study are supported by research conducted by several researchers who show that MA level of the pre-service elementary school teachers is at a high level (Isiksal, Curran, Koc, & Askun, 2009; Levine, 1998). In contrast to the results of this study, other studies show that it should be at the medium level (Bekdemir, 2010; Bursal & Paznokas, 2006; Rayner, Pitsolantis, & Osana, 2009) and low (Çatlioglu et al., 2009; Hurst & Cooke, 2014). The high and low of MA can be caused by various things including pressure to answer the right questions, difficulty in understanding the mathematical terms, pressure due to the duration of the test (Harper & Daane, 1998), and the level of confidence (Finlayson, 2014; Harper & Daane, 1998). ). Other studies state that MA is affected by ineffective learning practices on campus (Finlayson, 2014); past experiences of always fail in mathematics (Bekdemir, 2010; Hembree, 1990; Stoehr, 2017; Wilson, 2018); and perceptions of mathematics (Gautreau et al., 2016). However, in this study, there are still no explanations for the factors that influenced the high MA. So, further research is needed to prove what factors affect the high MA of the pre-service elementary school teachers in Indonesia.
The Difference in MA between Female and Male Pre-service Elementary School Teachers Before the testing was carried out using one-way ANOVA, prerequisite tests were needed in the form of normality and homogeneity tests. To test the normality of data by gender, the Shapiro-Wilk test and normal graph q-plot tests were used. The results of the normality test based on gender can be seen in Table 5, Figure 1.a and 1.b.
Table 5. Data Normality Test Based on Gender
Shapiro-Wilk
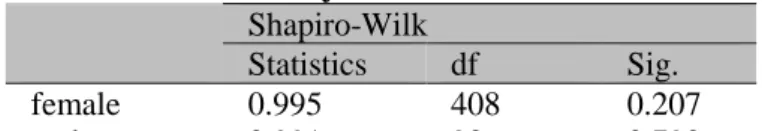
Statistics df Sig. female 0.995 408 0.207
male 0.991 90 0.790
The results of the normality test based on gender (female and male) using the Shapiro-Wilk test show the significance values of 0.207 and 0.790. This shows that the MA data for
Al-Jabar: Jurnal Pendidikan Matematika Vol. 10, No. 1, 2019, Hal 111 - 124
117
female and male are normally distributed because the significance values of the Shapiro-Wilk test are more than 0.05 (0.207> 0.05 and 0.790> 0.05).
From the image 1.a and 1.b, the dots spread around the diagonal line and the spread follows the direction of the diagonal line. It means the data of MA based on gender meets the assumption of normality.
(a) (b)
Figure 2. Graphs of Gender Normality Test Results: (a) Female and (b) Male After the normality test was done, the homogeneity test was carried out. Homogeneity test used the homogeneity test of variance. In Table 6 below, it is known that P (sig) data for MA based on gender is more than 0.05 (0.137> 0.05). Because the data has a significance of more than 0.05, the MA data based on gender is declared homogeneous.
Table 6. The Data of Homogeneity Test on Gender
Levene Statistics df1 df2 Sig.
2,218 1 496 0.137
The next stage after the data has fulfilled the assumption of normality and homogeneity, the hypothesis testing using one-way ANOVA was conducted. One-way ANOVA is used to find out whether there are differences in MA between female and male pre-service elementary school teachers. The results of the calculation of one-way ANOVA using SPSS version 23 can be seen in Table 7.
Table 7. One-way ANOVA Data Based on Gender
Sum of Squares df Mean Square F Sig. Between Groups 0.009 1 0.009 0,000 0.995 Within Groups 93952,290 496 189,420
Total 93952,299 497
Based on the table 7, the significance value of 0.995 is obtained. Because the value of P is greater than 0.05 (P> 0.05), then H0 (there is no significant difference in MA between female and male pre-service elementary school teachers) is accepted. It can be concluded that there is no difference in MA between female and male pre-service elementary school teachers.
Al-Jabar: Jurnal Pendidikan Matematika Vol. 10, No. 1, 2019, Hal 111 - 124
118
The results of this study indicate that there is no difference in MA between female and male pre-service elementary school teachers. The results of this study are similar to the research conducted by Çatlioglu et al. (2009); Dane (2005); Haynes et al. (2004); Peker & Ertekin (2011) which shows that there is no difference in MA between women and men. Unlike the results of this study, the results of other studies show that there are differences in MA between women and men, where MA in women is greater than men (Bowd & Brady, 2003; Goetz, Bieg, Lüdtke, Pekrun, & Hall, 2013; Gürbüz & Yıldırım, 2016; Hembree, 1990; Hill et al., 2016; Recber, Isiksal, & Koç, 2018). Meanwhile, Burak & Ozel (2012) in their study states that male has a higher MA than female. It seems that the MA in terms of gender is one of the variables that many researchers found different results in each place.
Furthermore, Flessati & Jamieson (1991) in their study explain that there is no evidence that female has more MA. Flessati & Jamieson (1991) reported in their study that MA is something that both sexes share. Opinions of Flessati & Jamieson (1991) might explain why there is no difference in MA for pre-service female and male teachers. In this study, both female and male pre-service teacher admitted that they experienced MA. The MA experienced by female and male pre-service elementary school teachers is possible because both of these gender experience bad mathematical experiences in the past (Bekdemir, 2010; Hembree, 1990; Stoehr, 2017; Wilson, 2018) or because learning practices on college are ineffective (Finlayson, 2014).
Differences in MA Candidate Elementary School Students Based on Semester Levels Shapiro-Wilk test and normal graph q-plot were used to test data normality based on semester. The results of the normality test based on the semester can be seen in Table 8, Figure 2.a, 2.b, and 2.c.
Table 8. Data Normality Test Based on Semester
Shapiro-Wilk
Statistics df Sig. 2nd Semester 0.996 172 0.906 4th Semester 0.995 167 0.829 6th Semester 0.986 159 0.115
The results of the normality test based on the semester using the Shapiro-Wilk test show significance values of 0.906; 0,829; and 0.115. This shows that the MA based on semester is normally distributed because the significance values of the Shapiro-Wilk test results are more than 0.05 (0.906> 0.05; 0.829> 0.05, and 0.115> 0.05).
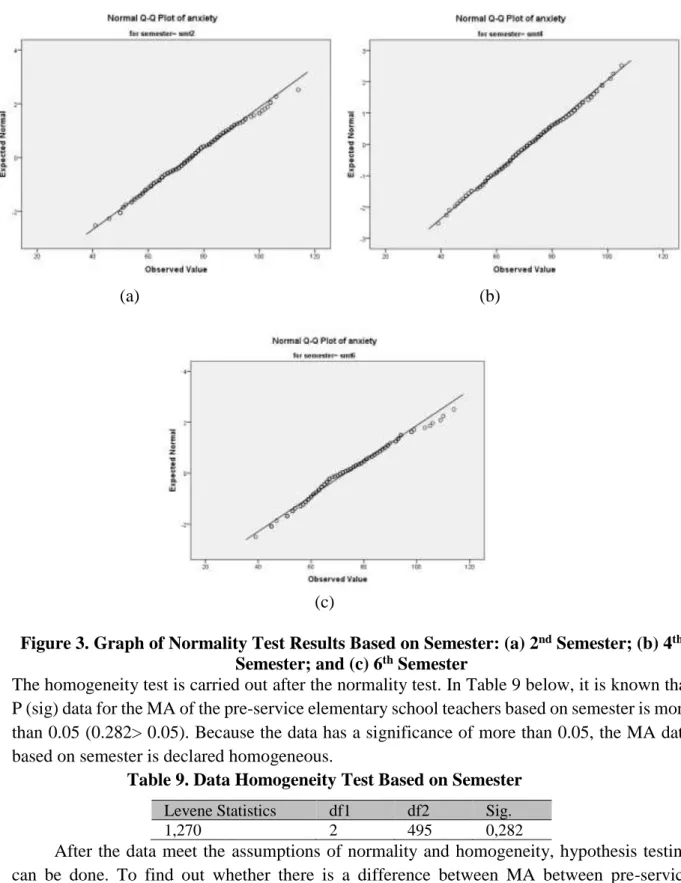
From images 2.a, 2.b, and 2.c, the points spread around the diagonal line and the spread follows the direction of the diagonal line. It means that the MA based on semester is assumed as normal.
Al-Jabar: Jurnal Pendidikan Matematika Vol. 10, No. 1, 2019, Hal 111 - 124
119
(a) (b)
(c)
Figure 3. Graph of Normality Test Results Based on Semester: (a) 2nd Semester; (b) 4th
Semester; and (c) 6th Semester
The homogeneity test is carried out after the normality test. In Table 9 below, it is known that P (sig) data for the MA of the pre-service elementary school teachers based on semester is more than 0.05 (0.282> 0.05). Because the data has a significance of more than 0.05, the MA data based on semester is declared homogeneous.
Table 9. Data Homogeneity Test Based on Semester
Levene Statistics df1 df2 Sig.
1,270 2 495 0,282
After the data meet the assumptions of normality and homogeneity, hypothesis testing can be done. To find out whether there is a difference between MA between pre-service elementary school teachers in the 2ndsemester, 4th semester, and 6th semester, one-way ANOVA
Al-Jabar: Jurnal Pendidikan Matematika Vol. 10, No. 1, 2019, Hal 111 - 124
120
is used. The results of the calculation using one-way ANOVA assisted bt SPSS version 23 can be seen in Table 10.
Table 10. One-way ANOVA Data Based on Semester Level
Sum of Squares df Mean Square F Sig. Between Groups 955,623 2 477,812 2,543 0,080 Within Groups 92996,676 495 187,872
Total 93952,299 497
Based on the table 10, the significance value of 0.080 (P> 0.05) is obtained. Because the value of P is greater than 0.05 (P> 0.05), then H0 is accepted. It can be concluded that there is no difference in MA between pre-service elementary school teachers in the second semester, fourth semester, and sixth semester.
The results of this study reveal that there is no difference between the MA of the pre-service elementary school teachers who are in the second semester, fourth semester, and sixth semester. This research is similar to the research conducted by Çakiroglu & Işiksal (2009) which shows that the attitude of the pre-service teachers toward mathematics is not significantly different based on grade level. The results of different studies are revealed by Çatlioglu et al. (2009) which states that there is no difference in MA between the pre-service elementary school teachers seen from the class level. There is no difference in MA between the pre-service elementary school teachers in the second semester, fourth semester, and the sixth semester may be because they have received the basic mathematics material since the first semester. Furthermore Çakiroglu & Işiksal (2009) say that the experience gained by the pre-service elementary school teachers do not cause differences in term of attitudes. It can be seen that even though 6th-semester students who have more mathematics experience than the second and the fourth-semester students do not show different mathematical anxiety. The students showed similar math anxiety. The more mathematics experience does not influence math anxiety.
The implication of the results of this study confirms that the MA can influence pedagogical competence of a teacher because it can have an impact on the way the teacher manages the class. This is reinforced by the opinion of Maryani, Husna, Wangid, Mustadi, & Vahechart (2018) that state that pedagogical competence possessed by a teacher has an influence on classroom management. Therefore, various efforts are needed to reduce the MA. One of them is the effort of the university to provide educational programs for pre-service elementary school teachers. First, universities that host teacher education programs must be able to provide effective mathematics learning and meaningful mathematics teaching experience for students (Rahayu, Sartono, & Miftakhuddin, 2019). Harper & Daane (1998) add that mathematics lectures at universities must emphasize collaboration, use manipulation, and have extensive fieldwork experience for the students as the pre-service teacher. Second, the university needs to examine the obstacles and challenges experienced by the pre-service teacher as well as hold consultations and discussions to deal with the obstacles experienced by each student (Finlayson, 2014; Gresham & Burleigh, 2018). After discussion, it is necessary to reflect on the pre-service elementary school teachers. This reflection can help teachers to plan
Al-Jabar: Jurnal Pendidikan Matematika Vol. 10, No. 1, 2019, Hal 111 - 124
121
the teaching in the future (Gautreau et al., 2016). Third, the pre-service teacher must be aware that the MA they have will have an impact on their students later so that they must be able to suppress their MA and increase their self-confidence in teaching mathematics (Ramirez et al., 2018; Wilson, 2018).
CONCLUSION AND SUGGESTION
The results of this study reveal that the MA of the pre-service elementary school teachers is at a high level. It does not show different results when viewed in terms of gender and semester level. Both female and male pre-service elementary school teachers as well as the second semester, fourth semester, and sixth-semester students of the pre-service elementary school teachers show not too much different in MA. Based on the conclusions mentioned above, the advice that can be given for further research is to examine the factors that cause a high level of mathematics anxiety and how to reduce it. This research is expected to be a reference for future research.
REFERENCES
Ashcraft, M. H. (2002). Math anxiety: Personal, educational, and cognitive consequences.
Current Directions in Psychological Science, 11(5), 181–185.
Beilock, S. L., Gunderson, E. A., Ramirez, G., & Levine, S. C. (2010). Female teachers’ math anxiety affects girls’ math achievement. Proceedings of the National Academy of Sciences,
107(5), 1860 LP – 1863.
Bekdemir, M. (2010). The pre-service teachers’ mathematics anxiety related to depth of negative experiences in mathematics classroom while they were students. Educational Studies in Mathematics, 75, 311–328.
Birgin, O., Baloglu, M., Çatlioglu, H., & Gürbüz, R. (2010). An investigation of mathematics anxiety among sixth through eighth grade students in Turkey. Learning and Individual Differences, 20, 654–658.
Bowd, A. D., & Brady, P. H. (2003). Gender differences in mathematics anxiety among preservice teachers and perceptions of their elementary and secondary school experience with mathematics. The Alberta Journal of Educational Research, 49(1), 24–36.
Burak, I., & Ozel, S. (2012). Mathematics anxiety among sixth and seventh grade Turkish elementary school students. Procedia - Social and Behavioral Sciences, 46, 4933–4937. Bursal, M., & Paznokas, L. (2006). Mathematics Anxiety and Preservice Elementary Teachers’
Confidence to Teach Mathematics and Science. School Science and Mathematics, 106(4), 173–180.
Bush, W. S. (1989). Mathematics anxiety in upper elementary school teachers. School Science and Mathematics, 89(6), 499–509.
Al-Jabar: Jurnal Pendidikan Matematika Vol. 10, No. 1, 2019, Hal 111 - 124
122
Çakiroglu, E., & Işiksal, M. (2009). Preservice elementary teachers’ attitudes and self-efficacy beliefs toward mathematics. Egitim ve Bilim, 34(151), 132–139.
Çatlioglu, H., Birgin, O., Serkan, C., & Gürbüz, R. (2009). The level of mathematics anxiety among pre-service elementary school teachers. In Procedia Social and Behavioral Sciences (Vol. 1, pp. 1578–1581).
Cornell, C. (1999). I Hate Math! I Couldn’t Learn it, and I Can’t Teach it! Childhood Education,
75(4), 255–230.
Dane, A. (2005). Differences in mathematics anxiety by sex, program, and education of university mathematics students in Turkey. Psychological Reports, 96(2), 422–424. Finlayson, M. (2014). Addressing math anxiety in the classroom. Improving Schools, 17(1),
99–115.
Flessati, S. L., & Jamieson, J. (1991). Gender differences in mathematics anxiety: An artifact of response bias? Anxiety Research, 3(4), 303–312.
Galla, B. M., & Wood, J. J. (2012). Emotional self-efficacy moderates anxiety-related impairments in math performance in elementary school-age youth. Personality and Individual Differences, 52, 118–122.
Gautreau, C., Brye, M. V., & Lunceford, C. (2016). Mathematics-related anxiety and attitudes: Examining the impact among Latina preservice teachers. Journal of Latinos and Education, 15(1), 26–38.
Geist, E. (2010). The anti-anxiety curriculum: Combating math anxiety in the classroom.
Journal of Instructional Psychology, 37(1), 24–31.
Goetz, T., Bieg, M., Lüdtke, O., Pekrun, R., & Hall, N. C. (2013). Do girls really experience more anxiety in mathematics? Psychological Science, 24(10), 2079–2087.
Gresham, G. (2009). An examination of mathematics teacher efficacy and mathematics anxiety in elementary pre-service teachers. The Journal of Classroom Interaction, 44(2), 22–38. Gresham, G., & Burleigh, C. (2018). Exploring early childhood preservice teachers’
mathematics anxiety and mathematics efficacy beliefs. Teaching Education, 30(2), 1–25. Gürbüz, R., & Yıldırım, K. (2016). An investigation of mathematics anxiety of primary school
teachers. Turkish Journal of Computer and Mathematics Education, 7(3), 536–552. Harper, N. W., & Daane, C. J. (1998). Causes and reduction of math anxiety in preservice
elementary teachers. Action in Teacher Education, 19(4), 29–38.
Haynes, A. F., Mullins, A. G., & Stein, B. S. (2004). Differential models for math anxiety in male and female college students. Sociological Spectrum: Mid-South Sociological Association, 24(3), 295–318.
Al-Jabar: Jurnal Pendidikan Matematika Vol. 10, No. 1, 2019, Hal 111 - 124
123
Hembree, R. (1990). The nature, effects, and relief of anxiety mathematics. Journal for Research in Mathematics Education, 21(1), 33–46.
Hill, F., Mammarella, I. C., Devine, A., Caviola, S., Passolunghi, M. C., & Szucs, D. (2016). Maths anxiety in primary and secondary school students: Gender differences, developmental changes and anxiety specificity. Learning and Individual Differences Journal, 48, 45–53.
Hurst, C., & Cooke, A. (2014). Seeking a balance: Helping pre-service teachers develop positive attitudes towards mathematics as they develop competency. Open Journal of Social Sciences, 2, 210–216.
Isiksal, M., Curran, J. M., Koc, Y., & Askun, C. S. (2009). Mathematics anxiety and mathematical self-concept: considerations in preparing elementary-school teachers. Social Behavior and Personality, 37(5), 631–644.
Lague, A., Eakin, G., & Dykeman, C. (2019). The impact of mindfulness-based cognitive therapy on math anxiety in adolescents. Preventing School Failure: Alternative Education for Children and Youth.
Levine, G. (1998). Changing anticipated mathematics teaching style and reducing anxiety for teaching mathematics among pre-service elementary school teachers. Educational Research Quarterly, 21(4), 37–46.
Maryani, I., Husna, N. N., Wangid, M. N., Mustadi, A., & Vahechart, R. (2018). Learning difficulties of the 5th grade elementary school students in learning human and animal body organs. Jurnal Pendidikan IPA Indonesia, 7(1), 96–105.
Nunez-Pena, M. I., Suarez-Pellicioni, M., & Bono, R. (2013). Effects of math anxiety on student success in higher education. International Journal of Educational Research, 58, 36–43.
OECD. (2017). PISA 2015 Assessment and Analytical Framework: Science, Reading,
Mathematic, Financial Literacy and Collaborative Problem Solving. Paris: OECD Publishing.
Peker, M., & Ertekin, E. (2011). The relationship between mathematics teaching anxiety and mathematics anxiety. New Educational Review, 23(1), 213–226.
Rahayu, L. P., Sartono, E. K. E., & Miftakhuddin. (2019). Self-efficacy of primary school teachers in mathematics teaching: A comparative research on teacher training program products. Mimbar Sekolah Dasar, 6(1), 68–78.
Ramirez, G., Chang, H., Maloney, E. A., Levine, S. C., & Beilock, S. L. (2016). On the relationship between math anxiety and math achievement in early elementary school: The role of problem solving . Journal of Experimental Child Psychology, 141, 83–100. Ramirez, G., Gunderson, E. A., Levine, S. C., & Beilock, S. L. (2013). Math anxiety, working
Al-Jabar: Jurnal Pendidikan Matematika Vol. 10, No. 1, 2019, Hal 111 - 124
124 Development, 14(2), 187–202.
Ramirez, G., Hooper, S. Y., Kersting, N. B., Ferguson, R., & Yeager, D. (2018). Teacher math anxiety relates to adolescent students’ math achievement. AERA Open, 4(1), 1–13. Rayner, V., Pitsolantis, N., & Osana, H. (2009). Mathematics anxiety in preservice teachers: Its
relationship to their conceptual and procedural knowledge of fractions. Mathematics Education Research Journal, 21(3), 60–85.
Reali, F., Jiménez-Leal, W., Maldonado-Carreño, C., Devine, A., & Szücs, D. (2016). Examining the link between math anxiety and math performance in Colombian students.
Revista Colombiana de Psicología, 25(2), 369–379.
Recber, S., Isiksal, M., & Koç, Y. (2018). Investigating self-efficacy, anxiety, attitudes mathematics achievement gender and school. Anales de Psicologia, 34(1), 41–51. Richardson, F. C., & Suinn, R. M. (1972). The mathematics anxiety rating scale: Psychometric
data. Journal of Couseling Psychology, 19(6), 551–554.
Rizta, A., & Antari, L. (2019). Tingkat mathematics anxiety pada mahasiswa calon guru matematika. Jurnal Pendidikan Matematika, 13(1), 9–20.
Santrock, J. W. (2011). Educational Psychology (Fifth Edit). New York: McGraw-Hill. Schillinger, F. L., Vogel, S. E., Diedrich, J., & Grabner, R. H. (2018). Math anxiety,
intelligence, and performance in mathematics: Insights from the German adaptation of the Abbreviated Math Anxiety Scale (AMAS-G). Learning and Individual Differences, 61, 109–119.
Sorvo, R., Koponen, T., Viholainen, H., Aro, T., Räikkönen, E., Peura, P., Aro, M. (2019). Development of math anxiety and its longitudinal relationships with achievement among primary school children. Learning and Individual Differences, 69, 173–181.
Stoehr, K. J. (2017). Mathematics anxiety: One size does not fit all. Journal of Teacher Education, 68(1), 69–84.
Vinson, B. M. (2001). A comparison of preservice teachers’ mathematics anxiety before and after a methods class emphasizing manipulatives. Early Childhood Education Journal,
29(2), 89–94.
Wilkins, J. L. M. (2009). Elementary school teachers’ attitudes toward different subjects. The Teacher Educator, 45(1), 23–36.
Wilson, S. (2018). Understanding maths anxiety in pre-service teachers through a quality of life framework. International Journal of Child, Youth and Family Studies, 9(4), 168–187.