Author(s) Crowley, Una Bernadette
Publication date 2014
Original citation Crowley, U. B. 2014. Development of low-cost sensing and separation devices based on macro, micro and nano technology for health applications. PhD Thesis, University College Cork.
Type of publication Doctoral thesis
Rights © 2014, Una Bernadette Crowley.
http://creativecommons.org/licenses/by-nc-nd/3.0/
Embargo information No embargo required
Item downloaded
from http://hdl.handle.net/10468/2007 Downloaded on 2017-02-12T14:11:11Z
Development of low-cost sensing and separation devices
based on macro, micro and nano technology for health
applications
by
Una Bernadette Crowley B.S.c.
A thesis submitted to the National University of Ireland
for the degree of Doctor of Philosophy
August 2014
Under the supervision of Dr. Eric Moore and Professor Jeremy
Glennon
Department of Chemistry
Tyndall National Institute,
National University of Ireland,
i
Acknowledgements
I would like to extend my sincere thanks to all those people who helped me during the course of this thesis. I would like to express my gratitude in particular to Professor Jeremy Glennon and Dr. Eric Moore for giving me the opportunity to work under you both and for all your guidance and support. I would like to thank Dr. Miloslav Pravda for his help and advice over the last 4 years. I would also like to thank the staff of the Chemistry department, especially Eileen, Mary, Christine, Tina and Matthias, whose help and time I greatly appreciated.
To all my friends and colleagues both in LSI in Tyndall and ABCRF in UCC, without you guys I would never have successfully completed this study. A special thanks to Eileen Hurley who is always willing to lend a helping hand. Walter, Michelle, Niall, Lisa, Gerard, Shauna, David, Rachel, Victor, Amy and Elaine thank you all for always listening to my many, many complaints and helping me through the tough times.
To my family, especially Mam and Dad, who have supported me and given me nothing but encouragement throughout my thesis. It has been a very long road but I am finally at the end of it. They always knew that I could do whatever I wanted to do with my life and their faith in me and my abilities have now been realised. Last but not least I would like to express my sincere gratitude to my boyfriend, Kenneth for being the driving force behind me over the past few years and in particular over the past few months in achieving completion of this thesis. Thank you all from the bottom of my heart.
ii
Declaration
I hereby declare that this thesis is my own work, in partial fulfilment of the requirements of the Doctor of Philosophy degree. It is based on research carried out in the Department of Chemistry and the Tyndall National Institute, University College Cork, Ireland between October 2010 and July 2014.
iii
Abstract
The work presented in this thesis described the development of low-cost sensing and separation devices with electrochemical detections for health applications. This research employs macro, micro and nano technology. The first sensing device developed was a toner-based micro-device. The initial development of microfluidic devices was based on glass or quartz devices that are often expensive to fabricate; however, the introduction of new types of materials, such as plastics, offered a new way for fast prototyping and the development of disposable devices. One such microfluidic device is based on the lamination of laser-printed polyester films using a computer, printer and laminator. The resulting toner-based microchips demonstrated a potential viability for chemical assays, coupled with several detection methods, particularly Chip-Electrophoresis-Chemiluminescence (CE-CL) detection which has never been reported in the literature.
Following on from the toner-based microchip, a three-electrode micro-configuration was developed on acetate substrate. This is the first time that a micro-electrode configuration made from gold; silver and platinum have been fabricated onto acetate by means of patterning and deposition techniques using the central fabrication facilities in Tyndall National Institute. These electrodes have been designed to facilitate the integration of a 3-electrode configuration as part of the fabrication process. Since the electrodes are on acetate the dicing step can automatically be eliminated. The stability of these sensors has been investigated using electrochemical techniques with excellent outcomes. Following on from the generalised testing of the electrodes these sensors were then coupled with capillary electrophoresis.
The final sensing devices were on a macro scale and involved the modifications of screen-printed electrodes. Screen-printed electrodes (SPE) are generally seen to be far less sensitive than the more expensive electrodes including the gold, boron-doped diamond and glassy carbon electrodes. To enhance the sensitivity of these electrodes they were treated with metal nano-particles, gold and palladium. Following on from this, another modification was introduced. The carbonaceous material carbon monolith was drop-cast onto the SPE and then the metal nano-particles were electrodeposited onto the monolith material.
iv Table of Contents Acknowledgements i Declaration ii Abstract iii Table of Contents iv
List of Figures xii
List of Tables xxi
List of Abbreviations xxiii
Objectives and Thesis Overview xxv
1 General Introduction 1
1.1Sensors and Separation 2
1.2An Introduction to Electro-Analytical Principles 6
1.2.1 General Introduction 6
1.3 Fundamentals of Electroanalytical Chemistry 8
1.3.1 Introduction 8
1.3.2 Electrochemical Cell 8
1.3.3 Electrochemical Measurements 12 1.3.4 Electrochemical Measurement Techniques 24
1.3.4.1 Linear Sweep Voltammetry (LSV) 25 1.3.4.2 Cyclic Voltammetry 29 1.3.4.3 Square Wave Voltammetry 32 1.3.4.4 Differential Pulse Voltammetry 33 1.3.4.5 Electrical Impedance Spectroscopy (EIS) 34
1.4 Transducers 37 1.4.1 Introduction 37 1.4.2 Potentiometric Transducers 37 1.4.3 Conductometric Transducers 38 1.4.4 Amperometric Transducers 38 1.4.5 Optical Transducers 39 1.4.6 Piezoelectric Transducers 40 1.4.7 Acoustical Transducers 41 1.4.8 Calorimetric Transducers 42
v
1.5 Working Electrode Material 43
1.5.1 Macroelectrodes 43
1.5.1.1 Introduction 43
1.5.1.2 Metal Working Electrodes 43 1.5.1.3 Mercury Electrodes 44 1.5.1.4 Carbon Electrodes 45 1.5.1.5 Screen-Printed Electrodes 45
` 1.5.2 Microelectrodes 46
1.5.2.1 Introduction 46
1.5.2.2 Fabrication, Shapes and Responses 52 1.6 Chemically Modified Electrodes 55
1.6.1 Introduction 55
1.6.2 Approaches to Chemically Modify Electrodes 58 1.7 Other Measurement Techniques used in the work in this Thesis 60 1.7.1 Capillary Electrophoresis 60
1.7.1.1 Introduction 60
1.7.1.2 Electrophoresis 62
1.7.1.3 Electro-osmotic flow (EOF) 63
1.7.2 Chemiluminescence 68
1.7.2.1 Introduction 68
1.7.2.2 Luminol Chemiluminescence Reaction 71
1.8 Statistical Information 72 1.8.1 Introduction 72 1.8.2 Validation 72 1.8.2.1 Calibration Range 73 1.8.2.2 Limit of detection 73 1.8.2.3 Selectivity 74 1.8.2.4 Sensitivity 74
1.8.2.5 Accuracy and Precision 75 1.8.3 Repeatability and Reproducibility 75
1.8.4 Percentage Recovery 76
1.8.5 Correlation 76
1.9 Buffers 77
1.9.1 Introduction 77
vi
1.10 Electrochemical Instrumentation 78
1.10.1 Introduction 78
1.10.2 Chi 1040A Electrochemical Workstation 78 1.10.3 Palmsens Electrochemical Workstation 79
1.11 References 80 2 Toner-Based Microchips 86 2.1 Objectives 87 2.2 Introduction 88 2.3 Experimental Details 91 2.3.1 Reagents 91 2.3.2 Apparatus 91 2.4 Procedures 92
2.4.1 Fabrication of Toner-based microchip 92 2.4.2 Preparation of Reagents 93 2.4.2.1 Amino Acids 93 2.4.2.2 Chiral Compounds 93 2.4.3 Experimental Protocol 93 2.5 Results 95 2.5.1 Amino Acids 97
2.5.1.1 Optimisation of the CL detection of amino acids using toner-based microchips 97 2.5.1.2 ME separation of Amino acids on toner-based
microchips 97
2.5.1.3 Preparation of calibration curve of amino acids using CL detection in Toner-chip 98 2.5.1.4 Analysis of plasma sample 99
2.5.2 Chiral Separation 101
2.5.2.1 Optimisation of the CL detection of D,L-
phenylalanine using toner-based microchips 101 2.5.2.2 ME separation of D,L-phenylalanine on toner-based
microchips 101
2.5.2.3 Preparation of calibration curve of D,L-phenylalanine using CL detection in Toner-chip 103
vii
2.6 Limitations of toner-based microchips 104 2.7 Conclusions and Future Work 105
2.8 Highlights 106 2.9 References 107 3 Acetate Microelectrode 109 3.1 Objectives 110 3.2 Introduction 110 3.2.1 Technical Background 111 3.2.2Substrate Cleaning 111 3.2.3Metallisation 112 3.2.4 Photolithography 113 3.2.5 Capillary Electrophoresis 113 3.2.6 Analytes used in this work 114 3.2.6.1 Uric Acid used for initial testing of microelectrodes 114 3.2.6.2 Neurotransmitters used in CE 114
3.3 Experimental Details 116
3.3.1 Reagents 116
3.3.2 Apparatus 116
3.3.2.1 Initial electrochemical testing 116
3.3.2.2 CE work 117
3.4 Procedures 117
3.4.1 Fabrication of the Three Electrode System 117 3.4.1.1 Designing the Electrodes 117 3.5.1.2 Steps involved in the fabrication of the electrodes 118 3.4.2 Preparing electrode for CE 121
3.4.2.1 Acetate microelectrode with CE 121 3.4.2.2 Conventional 3-electrode system with CE 121 3.4.3 Electrode system setup with Capillary Electrophoresis 121 3.4.3.1 Conventional 3-electrode system 121 3.4.3.2 Acetate microelectrode 123
3.5 Results
124
3.5.1 Initial Testing of microelectrodes 124 3.5.1.1 Electrochemical behaviour of UA at the
microelectrode 124
viii
3.5.1.3 Effect of solution pH 127 3.5.1.4 Determination of UA by Cyclic Voltammetry 128 3.5.1.5 Real sample analysis: determination of UA in human
plasma serum 130
3.5.2 Coupling microelectrode with CE 131 3.5.2.1 Na2B4O7·10H2O solution, pH 9.5 131
3.5.2.2 Determination of analytes individually with the acetate microelectrode using Cyclic Voltammetry 132 3.5.2.3 Optimising conditions for acetate microelectrode coupled
with CE 133
3.5.2.3.1 Effect of Injection time 133 3.5.2.3.2 Effect of buffer pH 134 3.5.2.3.3 Effect of buffer concentration 135 3.5.2.4 Preparation of calibration curve of neurotransmitters
using acetate microelectrode configuration 136 3.5.2.5 Stability and Repeatability of the acetate
microelectrode 137
3.5.2.6 Real sample analysis: determination of neurotransmitters in human plasma serum 137 3.5.2.7 Comparison of optimum microelectrode results with the
conventional 3-electrode system 138 3.6 Conclusions and Future Work 140
3.7 Highlights 141
3.8 References 142
4 Modification of Macro electrodes using metal nanoparticles and carbon monolith 145 4.1 Objectives 146 4.2 Introduction 146 4.3 Experimental 149 4.3.1 Reagents 149 4.3.2 Apparatus 149 4.3.3 Procedures 150
4.3.3.1 Fabrication of the Screen-Printed Electrode 150 4.3.3.2 Protocol for modifying the SPE with gold and
palladium nanoparticles 151 4.3.3.3 Protocol for modifying the SPE with CM 151
ix
4.3.3.4 Protocol for drop angle measurement 152 4.3.3.5 Protocol for Electrochemical Impedance Spectroscopy
(EIS) 153
4.3.3.6 Studies on the influence of Scan Rate 153 4.3.3.7 Cyclic Voltammetry (CV) 153
4.4 Results 153
4.4.1 SPE/Au nanoparticles 154
4.4.1.1 Characterisation using SEM of the SPE with gold
nanoparticles 154
4.4.1.2 Contact-angle measurement of SPE and SPE/Au 155 4.4.1.3 Electrochemical behaviour of SPE and SPE/ Au 155 4.4.1.3.1 Comparison of Cyclic Voltammogramms 155 4.4.1.3.2 Vary Scan Rate 156 4.4.1.4 EIS measurements 160 4.4.1.5 Effect of pH on the oxidation of DA and UA 161 4.4.1.6 Effect of deposition time on the oxidation of DA
and UA 162
4.4.1.7 Simultaneous determination of DA and UA 162 4.4.1.8 Characterisation of the SPE/Au using amperometric
(I-t) curve 164
4.4.1.9 Stability and repeatability of the SPE/Au 164 4.4.1.10 Real sample analysis: determination of DA and UA in
human serum 165
4.4.2 SPE/ Pd nanoparticles 166
4.4.2.1 Characterisation using SEM of the SPE with palladium
nanoparticles 166
4.4.2.2 Contact-angle measurement of SPE and SPE/Pd 167 4.4.2.3 Electrochemical behaviour of SPE and SPE/Pd 168 4.4.2.3.1 Comparison of Cyclic Voltammogramms 168 4.4.2.3.2 Vary Scan Rate 169 4.4.2.3.3 EIS measurements 170 4.4.2.3.4 Effect of pH on the oxidation of AA
and UA 171
4.4.2.3.5 Effect of deposition time on the oxidation
of AA and UA 173
4.4.2.3.6 Simultaneous determination of AA and UA 173 4.4.2.3.7 Characterisation of the SPE/Pd usin using
amperometric (I-t) curve 175 4.4.2.3.8 Stability and repeatability of the SPE/Pd 176 4.4.2.3.9 Real sample analysis: determination of AA
x
and UA in human serum 176 4.4.3 SPE/ CM/Au nanoparticles 177
4.4.3.1 Characterisation using SEM of the SPE/CM with gold
nanoparticles 177
4.4.3.2 Contact-angle measurement of SPE, SPE/CM and
SPE/CM/Au 179
4.4.3.3 Electrochemical behaviour of SPE/CM and
SPE/CM/Au 180
4.4.3.3.1 Comparison of Cyclic Voltammogramms 180 4.4.3.3.2 Vary Scan Rate 181 4.4.3.3.3 EIS measurements 182 4.4.3.3.4 Effect of pH on the oxidation of DA
and UA 184
4.4.3.3.5 Effect of deposition time on the oxidation of DA and UA 186 4.4.3.3.6 Simultaneous determination of DA and UA 186 4.4.3.3.7 Characterisation of the SPE/CM/Au using
using amperometric (I-t) curve 188 4.4.3.3.8 Stability and Repeatability of the
SPE/CM/Au 188
4.4.3.3.9 Real sample analysis: determination of DA and UA in human serum 189 4.4.4 SPE/CM/ Pd nanoparticles 190
4.4.4.1 Characterisation using SEM of the SPE with palladium
nanoparticles 190
4.4.4.2 Contact-angle measurement of SPE, SPE/CM and
SPE/CM/Pd 191
4.4.4.3 Electrochemical behaviour of SPE and SPE/CM/Pd 192
4.4.4.3.1 Comparison of Cyclic Voltammogramms 192 4.4.4.3.2 Vary Scan Rate 193 4.4.4.3.3 EIS measurements 194 4.4.4.3.4 Effect of pH on the oxidation of AA
and UA 195
4.4.4.3.5 Effect of deposition time on the oxidation
of AA and UA 197
4.4.4.3.6 Simultaneous determination of AA and UA 197 4.4.4.3.7 Characterisation of the SPE/CM/Pd using
using amperometric (I-t) curve 199 4.4.4.3.8 Stability and repeatability of the
xi
4.4.4.3.9 Real sample analysis: determination of AA and UA in human serum 200
4.5 Discussion and Future Work 201
4.6 Highlights 202
4.7 References 205
5 Conclusions & Future Work 206
5.1 Introduction 207 5.2 Chapter 2 208 5.3 Chapter 3 208 5.4 Chapter 4 209 5.5 Conclusions 210 6 Appendix 211 6.1 List of Journal Publications, Oral and Poster Presentations 212
6.1.1 List of Journal Publications 212 6.1.2 List of Oral Presentations 213 6.1.3 List of Poster Presentations 214
6.1.4 List of Awards 215
xii
List of Figures
Figure 1.1 Schematic layout of a sensor 3
Figure 1.2 Simple schematic of a three-electrode electrochemical cell 10 Figure 1.3 Schematic representation of the electrical double layer put forward by
Helmholtz 15
Figure 1.4 Schematic representation of the electrical double layer put forward by
Stern 16
Figure 1.5 Schematic representation of diffusion 20 Figure 1.6 Schematic representation of migration 21 Figure 1.7 Schematic representation of convection 21 Figure 1.8 Schematic representation of Fick’s First Law of Diffusion 23 Figure 1.9 Representation of a typical LSV graph 25 Figure 1.10 (A) Typical potential-time excitation signal for voltammetry and
(B) Typical voltammogram for a reversible process 31 Figure 1.11 (A) Typical voltammogram for an irreversible process and
(B) Typical voltammogram for a quasi-reversible process 32 Figure 1.12 Potential wave form for square wave voltammetry 33 Figure 1.13 Potential wave form for differential pulse voltammetry 34 Figure 1.14 Impedance circuit (Randles model) for characterisation of modified
electrodes 35
Figure 1.15 Nyquist plot for oxidation/reduction reaction of 5 mM [Fe(CN)6] 3-/4-
in 0.1 M KCl (imaginary impedance versus real impedance).
Frequency from 1 to 100 kHz 36
Figure 1.16 Position transducers, contactless and potentiometric 38
xiii
Figure 1.18 Optical fiber sensor 40
Figure 1.19 Quartz crystal microbalance 41 Figure 1.20 Example of an acoustic sensor for grinders 42
Figure 1.21 Working SPE design 46
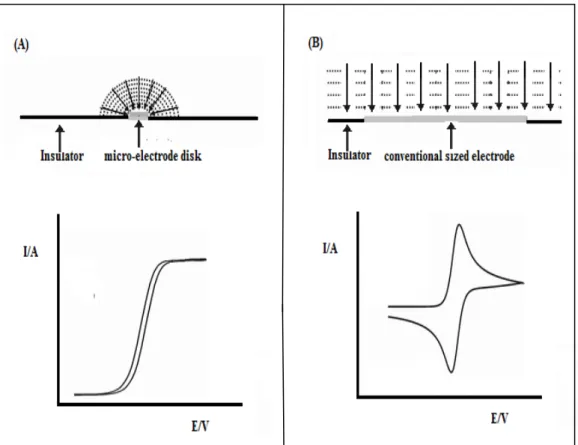
Figure 1.22 Highlighting the unique differences between a micro electrode and a conventional sized electrode where (A) shows the quasi steady-state behaviour observed at a disk micro-electrode where convergent diffusion is predominantly observed and (B) shows the typical peak-shaped voltammogram obtained under the same
conditions at a conventional sized electrode where planar
diffusion is predominantly observed. 49 Figure 1.23 Illustrations of the most common microelectrode geometries and
their diffusion fields 52
Figure 1.24 Scheme of Capillary Electrophoresis 60 Figure 1.25 Flow profiles in HPLC and CZE 62 Figure 1.26 The double layer at the capillary wall 63 Figure 1.27 Illustration of CZE separation 66 Figure 1.28 Basic Chemiluminescence Reaction 69 Figure 1.29 Overall luminol chemiluminescence reaction in aqueous medium 71 Figure 1.30 Chi 1040A Electrochemical Workstation 78 Figure 1.31 PalmsensElectrochemical Workstation 79 Figure 2.1 Representation of steps involved in fabrication process 92 Figure 2.2 Layout and dimensions of the toner-based microchip used in this work 94
xiv
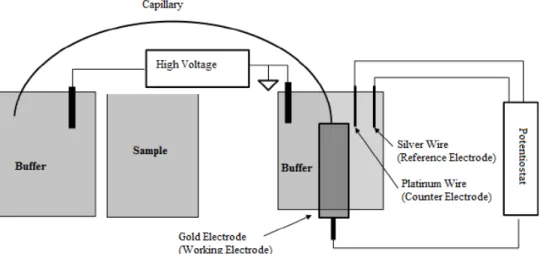
Figure 2.3 Scheme of MCE-CL System 94 Figure 2.4 View of MCE-CL System 95 Figure 2.5 Fluorescein migrating through cross-channel of toner chip 96
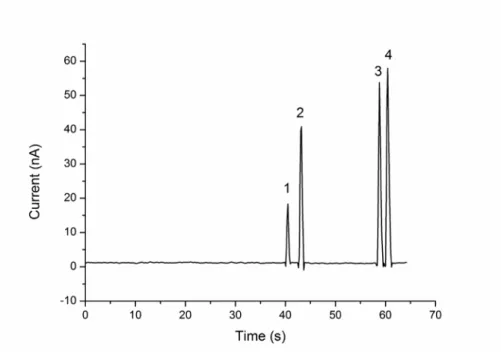
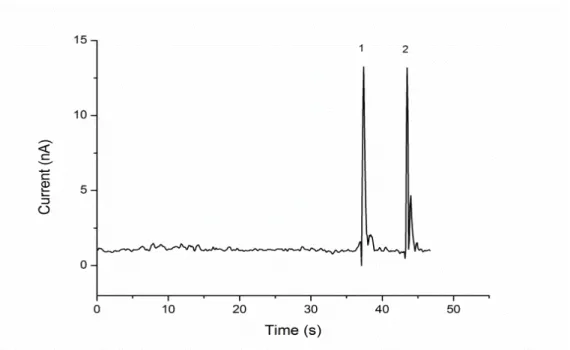
Figure 2.6 Electropherogram obtained from the separation of a standard sample. MCE conditions: the running buffer was 50 mM phosphate buffer
(pH 9.6) containing 2.5mM luminol, 0.45 mM Cu2+ and 4.5 mM tartrate. The oxidiser solution was 50mM phosphate buffer (pH 9.6) containing 50 mM H2O2. All analyte concentrations are 1.0 x 10
-5
M.
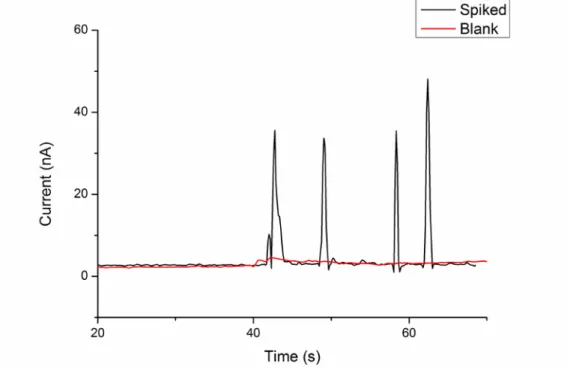
Peaks: 1. Glycine; 2. Cysteine; 3. Histidine; 4. Tryptophan. 98 Figure 2.7 Electropherogram obtained from the plasma sample spiked with 25 µM
Gly, Cys, His and Trp. MCE conditions are as in Fig. 2.6.
Peaks: 1. Gly; 2. Cys; 3. His; 4. Trp. 100 Figure 2.8 Electropherogram obtained from the separation of a standard sample.
MCE conditions: the running buffer was 25 mM phosphate buffer (pH 9.4) containing 2.5 mM luminol, 0.45 mM Cu2+ and 0.9 mM D-penicillamine. The oxidiser solution was 25 mM phosphate buffer (pH 9.4) containing 50mM H2O2. All analyte concentrations are 1.0 x 10⁻⁵ M.
Peaks: 1. L- phenylalanine 2. D- phenylalanine. 102 Figure 2.9 Electropherogram obtained from the separation of a standard sample.
MCE conditions are as in Fig. 2.8. Analyte concentrations are 2.0 x 10⁻⁵ M L- phenylalanine and 1.0 x 10⁻⁵ M.D- phenylalanine.
Peaks: 1. L- phenylalanine 2. D- phenylalanine. 103 Figure 3.1 (A) Close-up view of microelectrode configuration connected to
Chi 1040A. (B) View of experimental apparatus including Chi,
monitor, microelectrode and connections. 117 Figure 3.2 (A) Designs for the three electrode system and (B) dimensions of the
electrodes (images are not in scale). 118 Figure 3.3 Schematic diagram of the different layers of the microchip 120 Figure 3.4 Acetate wafer and a close up view of an individual microelectrode 120 Figure 3.5 Scheme of the conventional 3-electrode system 122 Figure 3.6 Setup of the conventional 3-electrode system which includes a Au
working electrode, Ag/AgCl reference electrode and Pt wire for
xv
Figure 3.7 Setup of the microelectrode system 124 Figure 3.8 Cyclic voltammograms of an acetate microelectrode using a) 50 mM
Phosphate buffer solution pH4 and b) 50 mM Phosphate buffer
solution pH 4 with 1.7 mM UA. Scan rate: 50 mV/s. 125 Figure 3.9 Cyclic voltammograms of acetate electrode in 5 mM Fe(CN)63-/4-
containing 0.1 M KCl solution at scan rate from 50 to 400 mV/s. 126 Figure 3.10 The plot of the anodic peak current versus square root of the scan rate. 126 Figure 3.11 The plot of anodic current of UA versus pH values on cyclic
voltammograms. 127
Figure 3.12 The linear relationship between the peak potential and solution
pH of UA. 128
Figure 3.13 CVs of various UA concentrations (a-f); 1.7 x 10⁻³, 2.22 x 10⁻³ M, 2.73 x 10⁻³ M, 3.21 x 10⁻³ M, 3.68 x 10⁻³ M and 4.14 x 10⁻³ M at the acetate electrode in 50 mM PB solution in pH 4.0. 129 Figure 3.14 Calibration plot obtained from the CVs shown above. 129 Figure 3.15 Cyclic voltammogram obtained at (a) the conventional 3-electrode
system and (b) the acetate microelectrode in 50 mM PB solution
pH 9.5. Scan rate 100 mV/s. 131 Figure 3.16 CVs obtained from the individual analytes using the acetate
microelectrode in 50 mM Na2B4O7·10H2O solution, pH9.5.
All analyte concentrations are 100µM. 132
Figure 3.17 Electropherograms obtained from varying the injection time. Injection buffer: 50 mMNa2B4O7·10H2O solution, pH 9.5. The
running buffer was similar to the injection buffer. Concentration of analytes: 100 μM each. Separation voltage: 10 kV. 133 Figure 3.18 Electropherograms obtained from varying the buffer pH. Injection buffer:
50 mMNa2B4O7·10H2O solution. The running buffer was similar
to the injection buffer with an injection time of 5 s. Concentration of analytes: 600 μM each. Separation voltage: 10 kV. 134
xvi
Figure 3.19 Electropherograms obtained from varying the buffer concentration. Injection buffer: varied concentration Na2B4O7·10H2O solution, pH 9.5,
and the running buffer was similar to the injection buffer with an injection time of 5 s. Concentration of analytes: 600μM each.
Separation voltage: 10kV. 135
Figure 3.20 Electropherograms obtained from the plasma sample spiked with 1 mM TA, DA, Ep and NEP Injection buffer: 25 mM Na2B4O7·10H2O
solution, pH 9.5, and the running buffer was similar to the injection buffer with an injection time of 5 s. Separation voltage: 10 kV.
Order of elution; TA, DA, Ep and NEP. 138 Figure 3.21 Electropherograms obtained from the separation of a standard sample
(A) using the conventional 3-electrode system and
(B) using the acetate microelectrode. Analyte concentrations are 500 µM TA and 200 µM DA, Ep and NEP. Injection buffer: 50 mM Na2B4O7·10H2O solution, pH 9.5, and the running buffer
was similar to the injection buffer with an injection time of 5 s. Separation voltage: 10 kV. Order of elution; TA, DA, Ep and NEP. 139 Figure 4.1 Experimental Apparatus which includes the Chi1040A with monitor attached
to a 3-electrode system, SPE, Ag/AgCl electrode and platinum wire. 150 Figure 4.2 SPE design and layer development 151 Figure 4.3 The SEM images (A) of the SPE, (B) of the bare surface with Au
nanoparticles, (C) of the bare surface with Au nanoparticles magnified.154 Figure 4.4 Images of water droplet on surface of (A) SPE (CA = 118.7º) and
(B) SPE/Au (CA = 95º) 155
Figure 4.5 Cyclic Voltammograms obtained at the (A) SPE/Au and (B) SPE 156 in 0.1 M PB solution pH 5 at scan rate 100 mV/s.
Figure 4.6 Cyclic Voltammograms obtained at the (A) SPE and (B) the SPE/Au in 5 mM [Fe(CN)6]3-/4- in 0.1 M KCl solution at scan rate 50 to 400 mV/s.
Below the scan rates: the plot of the redox peak currents versus square
root of the scan rate. 158
Figure 4.7 (A) Nyquist plots of [Fe(CN)6]3-/4- in 0.1 M KCl solution with (A) a SPE, and (B) a SPE/Au. The frequency range is from 1 Hz
xvii
Figure 4.8 Effect of buffer pH on the peak current for the oxidation of (A) DA and (B) UA. Concentrations: DA, 0.08 mM; UA, 0.2 mM.
Scan rate 50 mV/s. 161
Figure 4.9 Effect of buffer pH on the peak oxidation potential for the oxidation of AA and UA. Concentrations: DA, 0.08 mM; UA, 0.2 mM.
Scan rate 50 mV/s. 161
Figure 4.10 Effect of deposition time on the peak current for the oxidation of DA and UA. Concentrations: DA, 0.08 mM; UA 0.2 mM. Scan rate 50 mV/s. 162 Figure 4.11 (A) CV of DA 0.17 mM and UA 0.3 mM at the (a) SPE and
(b) SPE/Au in 0.1 M PB solution pH 5.0. (B) CVs of various DA and UA concentrations at the SPE/CM/Au in 0.1 M PB solution pH 5.0. Concentrations of analytes (a-g); 0.05, 0.07, 0.09, 0.11, 0.13, 0.15 and 0.17 mM for DA and 0.12, 0.15, 0.18, 0.21, 0.24, 0.27 and 0.3 mM for UA. (C) Calibration plot for DA obtained from the CV’s shown in (B). (D) Calibration plot for UA obtained from the CV’s
shown in (B). Scan rate: 50 mV/s. 163 Figure 4.12 A typical current-time response of the SPE/CM/Au upon the
successive additions of (A) 8 µM DA and (B) 40 µM UA in 0.1 M
PB solution pH 5, E=0.2 V. 164
Figure 4.13 The SEM images (A) of the SPE and (B) of the SPE surface
with Pd nanoparticles. 166
Figure 4.14 Images of water droplet on surface of (A) SPE (CA = 118.7º) and
(B) SPE/Pd (CA = 79º) 167
Figure 4.15 Cyclic voltammograms obtained at the (A) SPE and (B) SPE/Pd in 0.1 M PB solution pH 4 at scan rate 50 mV/s. 168 Figure 4.16 Cyclic voltammogram and the plot of the redox peak currents versus
square root of the scan rate obtained at the SPE/Pd in 5 mM
[Fe(CN)6]3-/4- in 0.1 M KCl solution at scan rate 50 to 400 mV/s. 169
Figure 4.17 Nyquist plots of [Fe(CN)6]3-/4- in 0.1 M KCl solution with (A) a SPE, and (B) a SPE/Pd. The frequency range is from 1 Hz to 100 kHz. 171 Figure 4.18 Effect of buffer pH on the peak current for the oxidation of (A) AA
and (B) UA. Concentrations: AA, 0.5 mM; UA, 0.5 mM.
xviii
Figure 4.19 Effect of buffer pH on the peak oxidation potential for the oxidation of AA and UA. Concentrations: AA, 0.5 mM; UA, 0.5 mM.
Scan rate 50 mV/s 172
Figure 4.20 Effect of deposition time on the peak current for the oxidation of (A) AA and (B) UA. Concentrations: AA, 0.5 mM; UA, 0.5 mM.
Scan rate 50 mV/s. 173
Figure 4.21 (A) CVs of various AA and UA concentrations at the SPE/Pd in 0.1 M PB solution pH 4.0. Concentration of analytes; 0.03, 0.06, 0.09, 0.12, 0.15, 0.18 and 0.21 mM for both AA and UA.
(B) Calibration plot for AA obtained from the CV’s shown in (A). (C) Calibration plot for UA obtained from the CV’s shown in (A).
Scan rate: 50 mV/s. 174
Figure 4.22 A typical current-time response of the SPE/Pd upon the successive additions of (A) 20 µM AA and (B) 30 µM UA in 0.1M PB solution
pH 4, E= 0.2V. 175
Figure 4.23 The SEM images (A) of the SPE, (B) of the CM surface, (C) of the magnified CM surface and (D) of the magnified CM with
Au nanoparticles. 178
Figure 4.24 Images of water droplet on surface of (A) SPE (CA = 118.7º),
(B) SPE/CM (CA = 132.8º) and (C) SPE/CM/Au (CA = 106.5º). 179 Figure 4.25 Cyclic voltammograms obtained at the (A) SPE, and (B) SPE/CM/Au
in 0.1 M PB solution pH 5 at scan rate 50 mV/s. 180 Figure 4.26 Cyclic voltammograms and the plot of the redox peak currents
versus square root of the scan rate obtained at the (A) SPE and (B) SPE/CM/Au in 5 mM [Fe(CN)6]
in 0.1 M KCl solution at
scan rate 50 to 400 mV/s. 181
Figure 4.27 (A) Nyquist plots of [Fe(CN)6]3-/4- in 0.1 M KCl solution with (a) a SPE, (b) a SPE/CM, and (c) a SPE/CM/Au. The frequency range is from 1 Hz to 100 kHz. (B) Nyquist plot of [Fe(CN)6]3-/4- in 0.1 M KCl
solution with a SPE/CM/Au. 183
Figure 4.28 Effect of buffer pH on the peak current for the oxidation of (A) DA and (B) UA. Concentrations: DA, 0.128 mM; UA, 0.64 mM.
xix
Figure 4.29 Effect of buffer pH on the peak oxidation potential for the oxidation of (A) DA and (B) UA. Concentrations: DA, 0.128 mM;
UA, 0.64 mM. Scan rate 50 mV/s. 185 Figure 4.30 Effect of deposition time on the peak current for the oxidation of
(a) UA and (b) DA. Concentrations: UA, 0.64 mM; DA, 0.128 mM.
Scan rate 50 mV/s. 186
Figure 4.31 (A) CV of DA 0.06 mM and UA 0.593 mM at the (a) SPE and
(b) SPE/CM/Au in 0.1 M PB solution pH 5.0. (B) CVs of various DA and UA concentrations at the SPE/CM/Au in 0.1 M PB solution pH 5.0. Concentrations of analytes (a-e); 0.03, 0.06, 0.09, 0.12, 0.15 and 0.18 mM for DA and 0.298, 0.446, 0.593, 0.739, 0.884 and 1.028 mM for UA. (C) Calibration plot for DA obtained from the CV’s shown in (B). (D) Calibration plot for UA obtained from the CV’s shown in (B). Scan rate: 50 mV/s. 187 Figure 4.31 A typical current-time response of the SPE/CM/Au upon the successive
additions of (A) 6 µM DA and (B) 30 µM UA in 0.1 M PBS solution
pH 5, E= 0.2V. 188
Figure 4.33 The SEM images (A) of the SPE, (B) of the CM surface, (C) of the CM surface with Pd nanoparticles and (D) of the magnified CM with
Pd nanoparticles. 190
Figure 4.34 Images of water droplet on surface of (A) SPE (CA = 118.7º),
(B) SPE/CM (CA = 132.8º) and (C) SPE/CM/Au (CA = 116.7º). 191 Figure 4.35 Cyclic Voltammogram obtained at the (A) SPE and (B) SPE/CM/Pd
in 0.1 mol L-1 PB solution pH 4 at scan rate 50 mV/s. 192 Figure 4.36 Cyclic Voltammogram and the plot of the redox peak currents versus
square root of the scan rate obtained at the SPE/CM/Pd in 5 mM
[Fe(CN)6]3-/4- in 0.1M KCl solution at scan rate 10 to 100 mV/s. 193
Figure 4.37 Nyquist plots of [Fe(CN)6]3-/4- in 0.1 M KCl solution with a SPE, a SPE/CM, and a SPE/CM/Pd. The frequency range is from 1 Hz
to 100 kHz. 195
Figure 4.38 Effect of buffer pH on the peak oxidation potential for the oxidation of AA and UA. Concentrations: AA, 0.787 mM; UA, 1.27 mM.
Scan rate 50 mV/s. 196
Figure 4.39 Effect of buffer pH on the peak current for the oxidation of AA and UA. Concentrations: AA, 0.787 mM; UA, 1.27 mM. Scan rate 50 mV/s. 196
xx
Figure 4.40 Effect of deposition time on the peak current for the oxidation of AA and UA. Concentrations: AA, 0.787 mM; UA, 1.27 mM.
Scan rate 50 mV/s. 197
Figure 4.41 (A) CV of AA 0.787 mM and UA 1.27 mM at the (a) SPE/CM/Pd and (b) SPE in 0.1 M PB solution pH 4.0. (B) CVs of various AA
and UA concentrations at the SPE/CM/Pd in 0.1 M PB solution pH 4.0. Concentrations of analytes (a-e); 0.495, 0.787, 1.076, 1.362, 1.644, 1.923 and 2.199 mM for AA and 0.98, 1.267, 1.456, 1.737, 2.015, 2.29 and 12.562 mM for UA. (C) Calibration plot for AA obtained from the CV’s shown in (B). (D) Calibration plot for UA obtained
from the CV’s shown in (B). Scan rate: 50 mV/s. 198 Figure 4.42 A typical current-time response of the SPE/CM/Pd upon the successive
additions of (A) 50 µM AA and (B) 70 µM UA in 0.1 M PB solution pH 4,
xxi
List of Tables
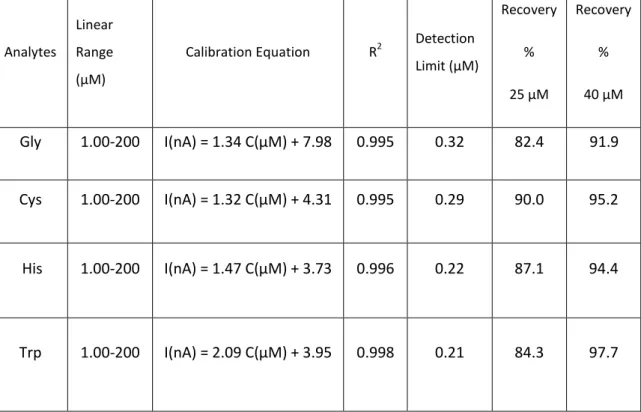
Table 1.1 Examples of different types of transducers 37 Table 1.2 Types of microelectrodes and their diffusion field geometry 52 Table 1.3 Different modes of CE available 65 Table 1.4 Different modes of luminescence available 70 Table 1.5 Table of validation characteristics 72 Table 1.6 Table of validation characteristics 75 Table 2.1 Linear ranges and detection limits of the amino acids using PT
microchips 99
Table 2.2 Linear ranges and detection limits of the chiral compounds using PT
microchips 104
Table 2.3 Comparison of PT microchip with glass chip and other polymeric
microchips 105
Table 3.1 The recovery of UA in real-sample for the proposed method using the acetate microelectrode configuration 130 Table 3.2 Linear ranges and detection limits of the analytes using acetate
microelectrode 136
Table 4.1 The anodic (Ipa) and catodic (Ipc) peak currents versus the square root of the scan rate (V1/2) for SPE and SPE/Au 159 Table 4.2 The recovery of DA and UA for the proposed method using SPE/Au 165 Table 4.3 The anodic (Ipa) and catodic (Ipc) peak currents versus the square root of the
scan rate (V1/2) for SPE and SPE/Pd 170 Table 4.4 The recovery of AA and UA for the proposed method using SPE/Pd 176 Table 4.5 The anodic (Ipa) and catodic (Ipc) peak currents versus the square root of the
scan rate (V1/2) for SPE and SPE/CM/Au 182 Table 4.6 The recovery of DA and UA for the proposed method using the
SPE/CM/Au 189
Table 4.7 The anodic (Ipa) and catodic (Ipc) peak currents versus the square root of the scan rate (V1/2) for SPE and SPE/CM/Pd 194
xxii
Table 4.8 The recovery of AA and UA for the proposed method using
xxiii List of Abbreviations AA AC ascorbic acid alternating current AD Ag Ag/AgCl Au amperometric detection silver silver/silver chloride gold
AuNPs gold nanoparticles
BGE background electrolyte
CE capillary electrophoresis CL CM Cys chemiluminescence carbon monolith L-cysteine CV cyclic voltammetry
CZE capillary zone electrophoresis DA
DMF DPV
dopamine
dimethylformamide
differential pulse voltammetry EC
EIS
electrochemical
electrochemical impedance spectroscopy
EOF electroosmotic flow
EP EtOH FeCl3 FET FI Gly H2O H2O2 H2SO4 H3PO4 HCl epinephrine ethanol ferric chloride field effect transistor flow injection glycine water hydrogen peroxide sulphuric acid phosphoric acid hydrochloric acid
xxiv His histidine HPLC Hz IUPAC K3Fe(CN)6 K4Fe(CN)6 KCl
high performance liquid chromatography hertz
International Union of Pure and Applied Chemistry potassium ferricyanide potassium ferrocyanide potassium chloride LOD LSV M ME limit of detection
linear sweep voltammetry molar microchip electrophoresis MEKC MeOH mM MS NaCl NaH2PO4 Na2HPO4 NaOH
micellar electrokinetic capillary chromatography methanol milli Molar mass spectrometry sodium chloride monosodium phosphate disodium phosphate sodium hydroxide NEP OFN PDDA PDMS PdNPs Pt PT norepinephrine oxygen free nitrogen
Poly (diallyl dimethylammonium) Chloride
Polydimethylsiloxane palladium nanoparticles platinum polyester-toner TA tryptamine Trp Tryptophan UA UV ΔEp uric acid ultra-violet Peak-to-peak separation
xxv
Objectives and Thesis Overview
The work described in this thesis focuses on the development of inexpensive sensors for health applications. Chapter one is an introduction into the principles of electrochemistry, and an introduction to the work outlined involved in this thesis. Chapter 2 investigates the use of toner-based microchips for the separation and determination of amino acids and chiral compounds. This microfluidic device is based on the lamination of laser-printed polyester films using a computer, printer and laminator. The advantages of these microchips are numerous and include fast analysis times, minute consumption of samples and reagents, as well as the low-cost and rapid fabrication. The resulting toner-based microchips demonstrated a potential viability for chemical assays, coupled with several detection methods, particularly Chip-Electrophoresis-Chemiluminescence (CE-CL) detection.
Chapter 3 involves the fabrication of micro-electrodes which are made of gold, silver and platinum by means of patterning and deposition techniques onto acetate using the central fabrication facilities in Tyndall National Institute. These electrodes have been designed to facilitate the integration of a 3-electrode configuration as part of the fabrication process. Since the electrodes are on acetate the dicing step can automatically be eliminated. This gives more control and flexibility to tailor the size and shape of the acetate electrode depending on what detection method you are coupling them with. The stability of these sensors has been investigated using cyclic voltammetry and potentiometry with excellent outcomes. Following on from the generalised testing of the electrodes coupling these sensors was performed with capillary electrophoresis.
Chapter 4 involves working and modifying in-house fabricated screen-printed electrodes (SPE) and is divided into two parts. These electrodes are generally seen to be far less sensitive than the more expensive electrodes including the gold, boron-doped diamond and glassy carbon electrodes. The first part of this work involved electro-depositing metal nanoparticles directly onto the SPE. The second part involved first modifying the SPE with carbon monolith material and then to electrodeposit metal nano-particles onto the carbonaceous material. Both of these types of modification allowed for simultaneous determination of multiple analytes
xxvi
which was not possible using the bare electrode initially. Chapter 5 discusses the general conclusions of the work in this thesis and possible future work. Chapter 6 represents the lists of published papers, awards, oral and poster presentations achieved during the period of study.
1
Chapter 1
2
1 General Introduction 1.1 Sensors and Separation
Separation science involves using the physical properties and molecular interactions of chemical and biological compounds to move them between gaseous, liquid or solid phases. The ultimate aim of separation science often involves separating out the chemical and/or biological components in mixtures such as pharmaceuticals, wastewater, blood or food ingredients. Separation science is typically coupled with sensitive detection methods to measure the amounts or concentrations of chemical or biological compounds present. The work presented in this thesis develops new platforms and sensor technologies to help address the separation and measurement needs of global industry and wider society at a relatively low-cost.
A sensor is a signal which can be read by an observer or by an (today mostly instrument [1]. We can divide sensors into three types, namely;
• Physical sensors -for measuring distance, mass, temperature, pressure etc. • Chemical sensors – which measure chemical substances by chemical or
physical responses and
• Biosensors which measure chemical substances by using a biological sensing element.
All of these devices have to be connected to a transducer of some sort, so that a visibly observable response occurs. I will further discuss transducers in section 1.4. Chemical sensors and biosensors are generally concerned with sensing and measuring particular chemicals which may or may not be biological themselves [2]. These chemicals are usually given the general term analyte. Figure 1.1 shows the general schematic arrangement of a sensor.
3
Figure 1.1: Schematic layout of a sensor
The development of instrumentation, microelectronics and computers makes it possible to design sensors utilizing most of the known chemical, physical and biological principles that have been used in chemistry.
The work in this thesis focuses on chemical sensors. Chemical sensors may be classified according to the operating principle of the transducer:
1. Optical devices transform changes of optical phenomena, which are the result of an interaction of the analyte with the receptor part. This group may be further subdivided according to the type of optical properties which have been applied in chemical sensors:
• Absorbance, measured in a transparent medium, caused by the absorptivity of the analyte itself or by a reaction with some suitable indicator.
• Reflectance, is measured in non-transparent media, usually using an immobilized indicator.
• Luminescence, based on the measurement of the intensity of light emitted by a chemical reaction in the receptor system.
• Fluorescence, measured as the positive emission effect caused by irradiation. Also, selective quenching of fluorescence may be the basis of such devices.
4
• Refractive Index, measured as the result of a change in solution composition. This may also include a surface plasmon resonance effect. • Optothermal Effect, based on a measurement of the thermal effect caused
by light absorption.
• Light Scattering, based on effects caused by particles of definite size present in the sample.
2. Thermometric devices are based on the measurement of the heat effects of a specific chemical reaction or adsorption which involve the analyte. In this group the heat effects may be measured in various ways, for example in the so called catalytic sensors, the heat of a combustion reaction or an enzymatic reaction is measured by use of a thermistor.
3. Magnetic devices are based on the change of paramagnetic properties of a gas being analysed. These are represented by certain types of oxygen monitors.
4. Mass sensitive devices transform the mass change at a specially modified surface into a change of a property of the support material. The mass change is caused by accumulation of the analyte.
a) Piezoelectric devices used mainly in gaseous phase, but also in solutions, are based on the measurement the frequency change of the quartz oscillator plate caused by adsorption of a mass of the analyte at the oscillator.
b) Surface acoustic wave devices depend on the modification of the propagation velocity of a generated acoustical wave affected by the deposition of a definite mass of the analyte.
5. Electrical devices are based on measurements, where no electrochemical processes take place, but the signal arises from the change of electrical properties caused by the interaction of the analyte.
a) Metal oxide semiconductor sensors used principally as gas phase detectors, based on reversible redox processes of analyte gas components.
b) Organic semiconductor sensors are based on the formation of charge transfer complexes, which modify the charge carrier density.
5
c) Electrolytic conductivity sensors. d) Electric permittivity sensors.
6. Electrochemical devices transform the effect of the electrochemical interaction analyte - electrode into a useful signal. Such effects may be stimulated electrically or may result in a spontaneous interaction at the zero-current condition. The following subgroups may be distinguished:
a) Voltammetric sensors, including amperometric devices, in which current is measured in the D.C. or A.C. mode. This subgroup may include sensors based on chemically inert electrodes, chemically active electrodes and modified electrodes. In this group sensors are included with and without (galvanic sensors) external current source.
b) Potentiometric sensors, in which the potential of the indicator electrode (ion-selective electrode, redox electrode, metal/meta1 oxide electrode) is measured against a reference electrode.
c) Chemically sensitised field effect transistor (CHEMFET) in which the effect of the interaction between the analyte and the active coating is transformed into a change of the source-drain current. The interactions between the analyte and the coating are, from the chemical point of view, similar to those found in potentiometric ion-selective sensors.
d) Potentiometric solid electrolyte gas sensors work in high temperature solid electrolytes and are usually applied for gas sensing measurements.
The work in this thesis focuses on electrochemical devices, in particular voltammetric sensors. Before the principles behind these sensors can be explained, the basic fundamentals of electrochemistry must first be discussed.
6
1.2 An Introduction to Electro-Analytical Principles
1.2.1 General Introduction
Electrochemistry is the area of chemistry dealing with the interconversion of electrical energy and chemical energy. It may be defined as the branch of chemistry that is concerned with electrolysis and other similar phenomena that occurs when a current is passed through a solution of an electrolyte, or with the behaviour of ions in solution and the properties shown by these solutions [3]. Electrochemistry was discovered in the mid-1780s by anatomist Luigi Galvani (Bologna, Italy) whilst he was studying the effects of atmospheric electrical discharge. One day, he fastened brass hooks between the spinal cord of a dissected frog and an iron railing. To his amazement the frog's legs began twitching wildly, not only when lightning flashed, but also when the sky was calm. The most significant consequence of Galvani's discovery was the concept of Galvanism which refers to the production of electrical current from the contact of two metals in a moist environment [4].
Alessandro Giuseppe Volta (Como, Italy), made another important discovery following on from Galvani’s work. According to Volta's interpretation, the muscle twitches were induced by current flowing between two dissimilar metals connected by the moist flesh of the frog's leg. This led him to develop the first device which demonstrated chemical production of electric current [5]. Other particular early events in the development of electrochemistry included Humphrey Davy (1778-1829), who utilised the recently discovered voltaic pile to lay the qualitative foundations of electrochemistry. Davy isolated elemental potassium which was soon followed by sodium, barium, calcium, strontium, magnesium and later isolated boron and silicon [6].
Michael Faraday (1791-1867), who began his career as Davy’s laboratory assistant, achieved scientific prominence of his own for the First Law of Electrochemistry, developed in 1834: ‘The chemical power of a current of electricity is in direct proportion to the absolute quantity of electricity which
7
passes’. The Second Law of Electrochemistry, also defined by Faraday, states: ‘Electrochemical equivalents coincide, and are the same, with ordinary chemical equivalents’. The work that led to these two laws also resulted in many of the modern electrochemical terms such as electrode, electrolyte, and ion [7].
In 1905 Julius Tafel discovered that electric current passing across metal-solution interfaces could be made to increase exponentially by changing the electric potential of the electrode across the surface of which they passed. He is now known for the Tafel equation which is an equation i
relating the rate of an
ΔV = A x ln ( i / i0), where ΔV is the overpotential, A is the so-called "Tafel slope", I is the current density and i0 is the so-called exchange current density [8]. Other more recent advances in the last century include the introduction of cyclic voltammetry by Hickling (1940’s) and the invention of the operational amplifier (1950’s). During the 1960’s and 70’s quantum electrochemistry was developed by Revaz Dogonadze and his pupils. Other advances include chemically modified electrodes and photoelectrochemistry in the 70’s and the introduction of microelectrodes in the 90’s [7]. This has allowed electrochemistry to become an extremely broad subject encompassing such various areas as batteries, fuel cells, corrosion studies, hydrogen energy conversion, and bioelectricity [9].
Electroanalysis has many advantages including selectivity and sensitivity as well as its inexpensive equipment, ample choice of working electrode materials and direct accessibility, especially to electronic and hence automatic control, automated data treatment and simple insertion. Although there may be circumstances in which an electroanalytical method, as a consequence of the additional chemicals required, has disadvantages in comparison with instrumental techniques of analysis, the above-mentioned advantages often make electroanalysis the preferred approach for chemical control in industrial and environmental studies. Without a doubt electroanalysis has generated a vast range of applications including; environmental monitoring, biomedical analysis and industrial quality control [10]. This chapter will focus on the basic electrochemical principles in relation to electroanalytical chemistry, as well as a
8
range of commercially available electrodes with particular emphasis on screen-printed electrodes. The chapter will also target the possibilities for chemical modification of these screen-printed electrodes and finally some insight into microelectrode configurations.
1.3 Fundamentals of Electroanalytical Chemistry
1.3.1 Introduction
Electrochemical processes take place at the electrode-solution interface. The type of electrical signal used for quantitation differentiates the various electroanalytical techniques. In principle there are two types of electroanalytical measurements: potentiometric and potentiostatic [10]. Both require at least two electrodes and an electrolyte solution which make up the electrochemical (voltammetric) cell. The electrochemical cell and the processes involved with the electrode reactions will be further discussed in the forthcoming sections.
1.3.2 Electrochemical Cell
Electrochemical cells are categorised as either galvanic or electrolyte cells. Both cells have faradaic currents flowing through them, however a galvanic cell experiences spontaneous reactions at the electrodes by an oxidation-reduction couple and are often used in converting chemical energy into electrical energy. It is for this reason that galvanic cells are commonly used as batteries [11]. An electrolyte cell is one where the reactions are non-spontaneous and are induced by an external voltage greater than the open circuit potential of the cell. The electrolyte cells are regularly used to carry out desired chemical reactions by burning up electrical energy.
The term electrolysis is defined as: the passage of a direct electric current through an ion-containing solution, which produces chemical changes at the electrodes [4]. It can also be broadly classified as chemical changes that accompany faradaic reactions at electrodes in contact with an electrolyte solution. The electrode at
9
which oxidations occur is called the anode whilst the electrode where reductions exist is termed a cathode. A cathodic current occurs when a current in which electrons move across the interface from the electrode to a species in solutions, while electron flow from the species in solution into the electrode is termed anodic current.
The electrochemical cell can be defined as a device that generates a potential difference between electrodes using chemical reactions. In general, there is a measureable difference in potential between the two electrodes whether a current is present in the cell or not. The overall chemical reaction taking place in a cell is made up of two half reactions which are independent to each other [12]. Most of the time only one of these reactions is of interest, and the electrode at which it occurs is termed the working electrode. The purpose of this electrode, which is in contact with the species in solution, is to execute the required amount of potential in an orderly manner and promote the two-way electron transmission to and from the species. In order to focus on the working electrode, it is necessary to standardise the other half of the cell by using an electrode made up of phases of constant composition, the reference electrode. As the reference electrode is of stable composition its potential value is fixed and hence can be employed for the measurement of the potential of the working electrode. Thus one can state that one observes the potential of the working electrode with respect to the reference electrode. Equalising the current measured at the working electrode is the duty of the counter (or auxiliary) electrode. To achieve this task, the counter electrode may frequently move back and forth between the severe potentials found at the boundaries of the solvent window, where it undergoes oxidation while forcing the solvent or counter electrolyte to suffer reduction [13]. A typical three-electrode electrochemical cell is shown in Figure 1.2.
10
Figure 1.2: Simple schematic of a three-electrode electrochemical cell, showing the working electrode, reference electrode and counter electrode immersed in solution. The electrodes are all connected to a potentiostat so that the potential differences between the electrodes can be measured.
Working electrodes come in a range of designs and sizes but in general it is a small sphere, a wire or a small disk with an area of ˂0.25 cm 2, although microelectrodes which will be discussed later are substantially smaller than this [13]. The electrode surface needs to be clean and smooth to ensure the geometry and mass transport are well defined [13]. It is also important that the working electrode should not react chemically with the solvent or the species in solution. There are multiple types of working electrodes including gold, silver, boron doped diamond, mercury, platinum, glassy carbon, carbon paste and screen printed. The screen printed electrodes will be discussed in more detail in Section 1.5.1.5. There are also several types of reference electrodes such as the mercury-mercurous chloride, also known as the calomel electrode which were widely used up until about 1960. However, a big problem with this type of reference electrode presents
11
itself when the electrode is exposed to temperatures greater than 50 degrees Celsius. The mercurous chloride element of the electrode breaks down under this kind of heat, which will cause unreliable readings [14]. Another common type of reference electrode is the silver/silver chloride electrode which is the most common type of reference electrode. They are very easy to manufacture and are able to function in a wide variety of ambient temperatures. The maximum temperature at which this type of electrode can function is about 130 degrees Celsius [14]. The most common counter electrode material is platinum, usually a wire or a coil [13].
An electrolyte is a compound which produces an ionic solution when dissolved in an aqueous solution; this ionic solution is called the electrolyte solution. The electrolyte solution is the medium between the electrodes in the cell. This solution which also incorporates the species of interest may also contain other compounds such as buffer or complexing agents. The choice of the solvent depends on a number of factors which include the solubility of the species in solution, its redox activity and on solvent properties such electrochemical and chemical activities as well as electrical conductivity [10]. It is important that the solution does not react with the species in solution and should be stable over a wide potential range, see typical three-electrode electrochemical cell in Figure 1.2. In certain electrochemical experiments a Faraday cage is used. A Faraday cage is a metallic enclosure that prevents the entry or escape of an electromagnetic field (EM field). An ideal Faraday cage consists of an unbroken, perfectly conducting shell. This ideal cannot be achieved in practice, but can be approached by using fine-mesh copper screening. For best performance, the cage should be directly connected to an earth currents in the cell from nearby electromagnetic sources in the laboratory. This cage should be used when working with microelectrodes or electrodes with very weak current measurements (˂1 pA).
12
1.3.3 Electrochemical Measurements
Any process measured in electroanalytical chemistry occurs at the surface of the electrode. Therefore electrochemical measurements reflect a surface process rather than a solution process. Thus the surface of the electrode itself, the distance of the analyte from the surface, the rate at which the analyte reaches the surface and interactions of analyte with the surface will all affect the measurement. The type and scale of the effect depends on the type of measurement performed.
The measurement types are:
I. Conductimetric: is the measure of a material's ability to carry one the charge is obtained through measurement of the solutions resistance.
II. Amperometric: is where a constant potential is applied to the working electrode and the current is measured as a function of time.
III. Voltammetric: is a time-dependent potential to an electrochemical cell and measures the resulting current as a function of that potential.
IV. Potentiometric: is where a potentiometer is used to determine the difference between the potential of two electrodes. The potential of one electrode, the working or indicator electrode, responds to the analyte’s activity, and the other electrode - the counter or reference electrode, has a known, fixed potential [15].
Electrochemical methods can be classified as ‘bulk’ or ‘interfacial’. Interfacial techniques are the ones that consider the occurrences at the interface of electrode and solution, whereas bulk techniques are concerned with the occurrences at the solution level only. Interfacial techniques are further classified as potentiometric or voltammetric processes. Voltammetric processes are also sub-divided into
13
controlled-potential and controlled-current techniques. Controlled-potential techniques are deemed effective due to their high sensitivity, selectivity, transportability and economical installation. Examples include methods like voltammetry and chronoamperometry. In such techniques the current is quantified while potential is regulated.
The principle behind controlled potential electrolysis (CPE) experiments involves controlled-potential electroanalytical tests to receive a current reading that corresponds with the presence of the analyte under consideration. In order to achieve this, the electron transmission that takes place during the redox reaction of the analyte is observed:
O + ne- R
Equation 1.1: Representation of oxidised and reduced entities that make up redox pair
Where, O and R represent the oxidised and the reduced entities that make up the redox pair, respectively [10]. These reactions are known as faradaic processes, since they involve the transfer of electrons across the electrode-solution interface. If only the oxidised species is initially present, then the potential is set at a constant value sufficiently negative to cause rapid reduction and is maintained at this value until only the reduced species is present in solution. The total charge passed during the CPE experiment (Q) is calculated by integrating the current and is related to the number of electrons transferred per molecule (n) and the number of moles of the oxidised species initially present (N) through Faraday's law:
Q = nFN
Equation 1.2: Faraday’s Law
Where; F is Faraday's constant (96500 C mol-1). Therefore, if one of n or N is known, the other can be calculated.
14
The current which results from a change in oxidation state of the analyte is termed the ‘faradaic current’ because it obeys Faraday’s law. This current is a direct measure of the rate of the redox reaction and the resulting current-potential plot is called a voltammogram. The shape of the voltammogram depends on the processes involved in the electrode reaction, and the total current is the sum of the faradaic currents for the analyte and blank solutions, and the non-faradaic charging background current which is the current that results from the electrical double-layer. The non-Faradaic process refers to the process in which no electron transfer takes place across the electrode-solution interface. When phenomena like adsorption and desorption takes place, the structure of the electrode-solution interface experiences a change that corresponds with the variation in potential or in the composition of the solution. To direct the non-Faradaic process, ‘transient current’ needs to be controlled while varying the potential, solution composition or electrode area.
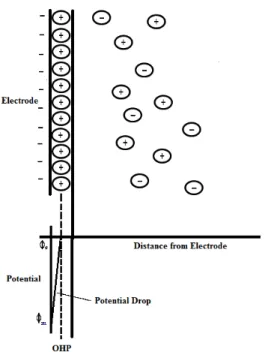
The model which gave rise to the term 'electrical double layer' was first put forward in the 1850's by Helmholtz [16]. In this model he assumed that no electron transfer reactions occur at the electrode and the solution is composed only of electrolyte. The interactions between the ions in solution and the electrode surface were assumed to be electrostatic in nature and resulted from the fact that the electrode holds a charge density (qm) which arises from either an excess or deficiency of electrons at the electrode surface. In order for the interface to remain neutral the charge held on the electrode is balanced by the redistribution of ions close to the electrode surface. Helmholtz's view of this region is shown in Figure 1.3 below:
15
Figure 1.3: Schematic representation of the electrical double layer put forward by Helmholtz.
The attracted ions are assumed to approach the electrode surface and form a layer balancing the electrode charge; the distance of approach is assumed to be limited to the radius of the ion and a single sphere of solvation round each ion. The overall result is two layers of charge (the double layer) and a potential drop which is confined to only this region (termed the outer Helmholtz Plane, OHP) in solution. The result is absolutely analogous to an electrical capacitor which has two plates of charge separated by some distance (d) with the potential drop occurring in a linear manner between the two plates.
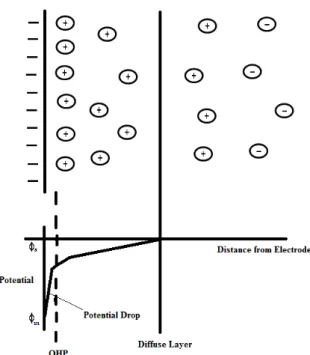
The model of Helmholtz while providing a basis for rationalising the behaviour of this region does not account for many factors such as diffusion/mixing in solution, the possibility of absorption on to the surface and the interaction between solvent dipole moments and the electrode. A later model put forward by Stern begins to address some of these limitations now the ions are assumed to be able to move in solution and so the electrostatic interactions are in competition with Brownian motion. This model can be seen in Figure 1.4. The result is still a region close to
16
the electrode surface (100x10-10 m) containing an excess of one type of ion but now the potential drop occurs over the region called the diffuse layer.
Figure 1.4: Schematic representation of the electrical double layer put forward by Stern.
Many modifications and improvements have been made to these early models with the latest approaches using numerical modelling to follow the redistribution effects as the electrode potential is varied [17-19].
When the overall reaction is controlled only by the rate at which the electroactive species reach the surface, the current is deemed mass transport limited, and is known as a Nernstian or reversible reaction because it obeys thermodynamic conditions. In potentiometry, information on the species in solution can be obtained by the potential appearing between two electrodes. This potential can be used to calculate the concentration of the electroactive species at the surface [Co and Cr] using the Nernst equation:
Ecell = E0cell - (RT/nF)ln[Co/Cr]
Equation 1.3: The Nernst Equation Where;
17
Ecell = cell potential under nonstandard conditions (V) E0cell = cell potential under standard conditions
R = gas constant, which is 8.31 (volt-coulomb)/(mol-K) T = temperature (K)
n = number of moles of electrons exchanged in the electrochemical reaction (mol) F = Faraday's constant, 96485 C mol-1
[Co/Cr] = concentration of electroactive species
The logarithmic term in the Nernst equation is the reaction quotient, Q.
Q = [Co/Cr]
Equation 1.4: Reaction Quotient, Q Thus the equation can also be written as:
Ecell = E0cell - (RT/nF)lnQ
Equation 1.5: Alternative Nernst Equation using reaction quotient, Q Where;
Q = reaction quotient, which is the equilibrium expression with initial concentrations rather than equilibrium concentrations.
All other terms are previously described in Equation 1.3.
Q has the same form as the equilibrium constant, but the activities need not have their equilibrium values. Pure solids, pure liquids and solvents are omitted from Q because their activities are unity (or close to unity); concentrations of solutes are expressed as moles per litre and concentrations of gases are expressed as pressures in atmospheres.
18
When all activities are unity, Q = 1 and lnQ = 0, thus giving E = E0.
Sometimes it is helpful to express the Nernst equation differently, converting the natural logarithm in Equation 1.5 to the base 10 logarithm gives:
Ecell = E0cell - (2.303*RT/nF)logQ
Equation 1.6: Alternative Nernst Equation using reaction quotient, Q and converting the natural logarithm in Equation 1.5 to the base 10 logarithm.
and inserting T = 298.15 K (25.00 ºC) gives the most useful form of the Nernst equation:
Ecell = E0cell - (0.05916 V/n)log Q
Equation 1.7: Alternative Nernst Equation using reaction quotient, Q and converting the natural logarithm in Equation 1.5 to the base 10 logarithm and inserting T = 298.15 K (25.00 ºC).
By expressing the Nernst Equation in this form the potential changes by 59.16/n mV for each factor of 10 change in the value of Q.
These descriptions of the electrode reaction are in fact quite simplified, as the pathway can actually be quite complicated and take place in several steps. The simplest reactions involve only mass transfer of the electroactive species to the electrode surface, electron transfer across the interface, and transfer of the product back to the bulk solution [10]. In more complex reactions, additional chemical and surface reactions may occur either before or after the actual electron transfer. The slower process will then, obviously, be the rate-determining step. Mass transport to the electrode proceeds by three different processes:
19
(a) Diffusion
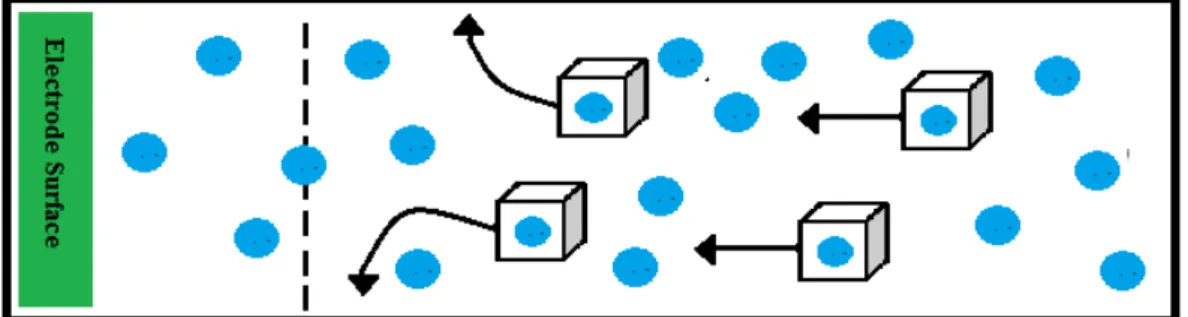
Diffusion is a process in which a body travels from a region of higher concentration to a region of lower concentration in order to reduce the concentration gradient [20]. In other words, it is an impulsive motion instigated by the concentration differences. When the electrode is oxidised while reducing the analyte, it will result in a reduced concentration of the analyte at the area of the electrode. To compensate for this reduction in the concentration, more analyte travels towards the electrode from the solution phase. This makes it the most substantial current-controlling feature in voltammetric method. During the electrochemical reaction, although the current is transmitted to the bulk solution by movement, still one should not overlook the possibility of diffusion because the concentration difference near the electrodes and the electroactive entities increase when the product is formed at the electrode, at the expense of the reagent. Also, in certain cases, diffusion is the only phenomenon that drives the electroactive species towards the electrode. This movement of a chemical species under the influence of a concentration gradient is described by Fick’s first law [20]. A particle i will diffuse through a cross-sectional area as a function of the concentration gradient across the selected area. Flux, as particles per unit time across the given segment, is expressed as Ji according to:
Ji = -Di(∂Ci/ ∂x) Equation 1.8: Fick’s First Law
Where; ∂Ci/ ∂x expresses the concentration gradient and Di is the diffusion coefficient for particle i.
20
Figure 1.5: Schematic representation of diffusion where a body travels from a region of higher concentration to a region of lower concentration in order to reduce the concentration gradient.
(b) Migration
The process of transmission of charges in which charged particles move along an electrical field (the ions transmit the charge through the solution on the basis of their transference number) is known as migration [10].
An auxiliary electrolyte is required during controlled-potential tests for the reduction of the solution resistance and eradication of electromigration effects. This helps sustain a stable ionic strength. In the present study, a large quantity of inert salt, like KCl was added to eradicate or restrain electromigration. When it comes to investigative purposes, the existence of auxiliary electrolyte with a concentration that is hundred times higher than the concentration of electroactive ions implies that the role of the studied ions is below one percent in the migration transport. In such a case, it will be appropriate to believe that the analytes under study are transmitted to the electrode only because of diffusion.
When cations undergo oxidation or reduction, the current flux near the electrode can be controlled by the migration of electroactive entities. It facilitates the minimisation of the electrical field by amplifying the conductivity of the solution. Moreover, it causes the decrement or removal of sample matrix effects. The thinness of the double layer with regard to the diffusion layer is maintained with the help of the auxiliary electrolyte. In addition, a constant ionic strength is instigated all through the solution. Nevertheless, the gauging of the current flow