Volume 23 Volume 23, 2018 Article 17
2018
The Ensemble and Model Comparison Approaches for Big Data
The Ensemble and Model Comparison Approaches for Big Data
Analytics in Social Sciences
Analytics in Social Sciences
C. H. YuH. S. Lee E. Lara S. Gan
Follow this and additional works at: https://scholarworks.umass.edu/pare Recommended Citation
Recommended Citation
Yu, C. H.; Lee, H. S.; Lara, E.; and Gan, S. (2018) "The Ensemble and Model Comparison Approaches for Big Data Analytics in Social Sciences," Practical Assessment, Research, and Evaluation: Vol. 23 , Article 17.
DOI: https://doi.org/10.7275/chaw-y360
Available at: https://scholarworks.umass.edu/pare/vol23/iss1/17
This Article is brought to you for free and open access by ScholarWorks@UMass Amherst. It has been accepted for inclusion in Practical Assessment, Research, and Evaluation by an authorized editor of ScholarWorks@UMass Amherst. For more information, please contact [email protected].
A peer-reviewed electronic journal.
Copyright is retained by the first or sole author, who grants right of first publication to Practical Assessment, Research & Evaluation. Permission is granted to distribute this article for nonprofit, educational purposes if it is copied in its entirety and the journal is credited. PARE has the right to authorize third party reproduction of this article in print, electronic and database forms.
Volume 23 Number 17, November 2018 ISSN 1531-7714
The Ensemble and Model Comparison Approaches for Big
Data Analytics in Social Sciences
Chong Ho Yu, Azusa Pacific University
Hyun Seo Lee, Azusa Pacific University Emily Lara, Azusa Pacific University
Siyan Gan, Pepperdine University
Big data analytics are prevalent in fields like business, engineering, public health, and the physical sciences, but social scientists are slower than their peers in other fields in adopting this new methodology. One major reason for this is that traditional statistical procedures are typically not suitable for the analysis of large and complex data sets. Although data mining techniques could alleviate this problem, it is often unclear to social science researchers which option is the most suitable one to a particular research problem. The main objective of this paper is to illustrate how the model comparison of two popular ensemble methods, namely, boosting and bagging, could yield an improved explanatory model.
With the rise of big data, data scientists have acknowledged the importance of big data analysis and developed a new set of tools to handle them. One such effective tools is data mining. It is so named because this process is data-driven, rather than hypothesis-driven. Due to its exploratory character, data mining is also named “knowledge discovery in databases” (KDD) (Larose, 2014; Han & Kamber 2011). The objective of this article is to illustrate how different data mining tools can be utilized for social science research, using an archival data set as an example.
Experts on data science predict that the size of digital data will double every two years; this indicates a 50-fold growth from 2010 to 2020. Human- and machine-generated data are increasing ten times faster than traditional data, in which its future implications are hard to ignore (Ffoulkes, 2017). These ever-expanding data are characterized by high volume, high velocity, and high variety (Laney, 2001). While there is not a clear boundary used to define big data, a typical high-volume data set carries thousands of rows or columns, which can often result in problems with data storage, management, and analysis. A high velocity data stream is an ongoing
data feed that has the potential to overwhelm a conventional database server. Finally, a data set of high variety contains different types of data (e.g. numbers, texts, images, audio files, video clips…etc.). Data sets of
this nature may present challenges to traditional data analysts, who are often exclusively accustomed to the analysis of structured data.
Although the trend of big data is most prevalent in business settings, social scientists may also benefit from this movement involving big data. An apparent example is the availability of unstructured data and structured archival data on the Internet. Unstructured data are referred to as Webpages and digital footprints on social media, such as Facebook and Twitter. Collecting these data necessitates Web content mining, also known as
Web scraping, which involves automated “crawling” the
Internet and extracting data from Websites (Landers, Brusso, Cavanaugh, & Collmus, 2016). Needless to say, data collection, data management, and data analysis of this form of unstructured data is extremely challenging. However, social science researchers could also utilize structured archival data for nationwide or cross-cultural studies. This kind of data is usually survey data, which
are stored in a conventional row X column matrix, such as Programme for International Student Assessment (PISA) and Trends for International Math and Science Study (TIMSS). Additional examples are listed in the appendix. As mentioned before, Web content mining of unstructured data requires additional procedures and resources whereas archival data are more accessible and manageable. Thus, this article focuses on archival data only.
In recent years, social scientists have started to realize that most traditional statistical procedures might not be suitable for the analysis of big data. For example, if one runs a regression analysis using 5,000 subjects, it is likely that most of the regressors in this analysis would yield statistically significant results even though the relationships might be trivial. Second, traditional parametric models, including regression and structural equation models, impose strong assumptions on the data structure and the distribution (Miller, Lubke, McArtor, & Bergeman, 2016). The founder of exploratory data analysis, John Tukey (1996), found that researchers often conduct analysis without examining the underlying data structure. To rectify this situation he endorsed using data visualization tools for checking parametric assumptions, spotting outliers, and evaluating model adequacy (Tukey, 1986). Nonetheless, today most data mining techniques are non-parametric.
It is important to emphasize that traditional statistical procedures and big data analytical methods can work hand in hand, rather than being at odds with each other. For example, in big data analytics, principal component analysis and cluster analysis are frequently employed for data reduction so that big data can be more manageable. Further, classification and regression tree (CART) and time-series forecasting are built upon classical regression modeling (Loh, 2011; Shen, 2018; Shmueli, Bruce, Stephens, & Patel, 2016).
Ensemble Methods in Big Data
Analytics
One of the assets of big data analytics is that it is resilient to lack of replicability: big data analytics involves partitioning of a big data set into many subsets, on which multiple analyses are run. In each run, the model is refined by previous "training.” As such, results of big
data analyses are considered the product of replicated studies. The process of learning from previous analysis is called “machine learning,” whereas the process of
merging multiple analyses is known as, “the ensemble method.” To be more specific, the ensemble approach compares, complements, and combines multiple methods in the analysis, enabling one to generate a better model than what the analyst could have obtained, using just one solitary analysis (Chen, Lin, & Chou, 2011; Polikar, 2006; Rokach, 2010; Skurichina & Duin, 2002).
Precursor of Ensemble Methods: Resampling
Indeed, this idea is not entirely new. The aforementioned techniques are similar to cross-validation and bootstrapping in resampling. Simple cross-validation was invented by Kurtz (1948) to examine psychometric properties. Later simple cross-validation was extended to double cross-cross-validation and multicross-validation (Mosier, 1951; Krus & Fuller, 1982). Bootstrapping was invented by Bradley Efron (1979, 1981, 1982) and further developed by Efron and Tibshirani (1993). In classic procedures, the test statistic is compared against the sampling distribution. In other words, the decision relies on an external reference. However, this reliance on supposedly known distributions was criticized by Tukey (1986) because we are usually uncertain about the underlying distribution. As a remedy, bootstrapping creates an empirical distribution by repeated sampling of the data. In this sense, "bootstrap" is a concept reminiscent of pulling yourself up by your own bootstrap. However, data scientists go one step further: in the ensemble method the procedure does not merely repeat itself; rather, machine learning algorithms improve the model through repeated analyses.
Machine Learning as a Remedy to Bias and Variance
Given the emergence and advancement of machine learning algorithms in the field of predictive analytics, an ensemble approach of several different machine learning methods has received its due importance. In the field of statistical analysis, the trade-off of bias and variance is a well-known problem. The bias is quantified by the error which results from missing a target. For example, if an estimated mean is 3, but the actual population value is 3.5, then the bias value is 0.5. The variance is the error which results from noise or random fluctuation. When the variance of a model is high, this model is considered unstable. A complicated model tends to have low bias but high variance. Conversely, a simple model is more likely to have a higher bias and a lower variance.
Among many machine learning methods, bagging is popularly utilized to decrease the variance whereas boosting is widely used to weaken the bias in the process of building a predictive model. Bagging, which stands for Bootstrap Aggregation, creates multisets of additional training data from the original sample repeatedly (Breiman, 1996; Büchlmann & Yu, 2002). Hence, bagging increases the size of these generated data and effectively minimizes the variance by decreasing the influence of extreme scores (Miller, Lubke, McArtor, & Bergeman, 2016). In contrast, boosting serves a different purpose: increasing predictive accuracy. The boosting method first creates a working model from the subsets of the original data set and then augments the performances of weak models so that they are eventually combined to be a strong model (Breiman, 1998; Schapire, Freund, Bartlett, & Lee, 1998). Depending on the characteristics of the data and the specific aim (e.g. generate a predictive model), these two methods show varying degrees of suitability. Thus, a visual representation of information is conducive to optimizing accessibility to and communication of quantitative message: Data visualization is a powerful method that aids in the detection and meaningful interpretation of certain distribution, pattern, and/or relation found in the data (Aparicio & Costa, 2015). The ensemble approach of bagging, boosting, and data visualization in efforts to synthesize the results significantly, which enhances the overall accuracy and understanding of the analyzed material (Skurichina & Duin, 2002).
This study demonstrated how one could utilize a variety of data mining techniques, including bootstrap forest, boosted tree, and data visualization, to unveil patterns in the large-scaled and imbalanced data set of Programme for the International Assessment of Adult Competencies (PIAAC). Developed by Organization for Economic and Cooperation and Development (OECD), this international assessment measures and evaluates the basic skills and competencies of adults around the globe. The results of the latest PIAAC (OECD, 2016), collected from 33 participating nations in 2014, indicated that the U.S. adults were falling behind their international counterparts in all three test categories, namely, literacy, numeracy, and problem-solving in technology-rich environments. This alarming if not disturbing report gave an impetus to probe the U.S sample exclusively. In addition to test items which measured literacy, numeracy, and problem-solving in
technology-rich environments, PIAAC also comprised multiple survey items believed to be relevant to learning and therefore supposedly conducive to test outcomes. In the analysis, this study purposefully took account of several of those related items, which are a readiness to learn, cultural engagement, political efficacy, and social trust.
Method
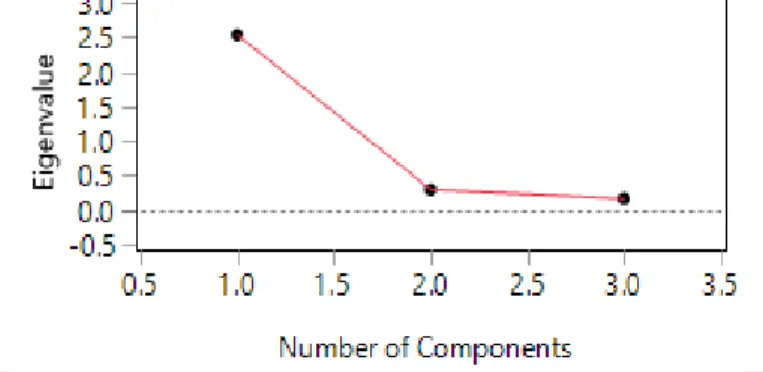
VariablesThe learning outcomes recorded in PIAAC were literacy, numeracy, and technology-based problem-solving scores. The scores of these three domains in the U.S. sample are strongly correlated (Figure 1). Further, as shown by the scree plot (Figure 2), a principal component analysis indicated that all three skills can be combined into one component (eigenvalue = 2.54). Taking all of the above into consideration, the composite score of literacy, numeracy, and problem-solving (the overall learning outcomes) was treated as the dependent variable.
Figure 1. Correlation matrix of literacy, numeracy, and problem-solving.
Figure 2. Scree plot of PCA of literacy, numeracy, and problem-solving.
Data analysis
Because OECD utilized multi-stage sampling, sample weights were used in all analyses. Two ensemble methods, the bootstrap forest and the boosted tree, were run with the U.S. data. The rationale of choosing the ensemble approach is simple. As mentioned before, numerous studies have confirmed that the ensemble approach outperforms any single modeling method (Dietterich, 2000; Freund & Schapire, 1997; Lemmens & Croux, 2006; Meir & Ra ̈tsch, 2003; Optiz & Maclin, 1999; Schapire et al., 1998).
Bagging and boosting are the two most popular ensemble methods. Both methods are built on machine learning, in which data sets are partitioned and analyzed by different models. Each model is considered a weak learner as well as a weak classifier, and the final solution is a synthesis of all these weak learners. A weak learner is defined as a model in which the error rate is slightly better than random guessing (Hastie, Tibshirani, & Friedman, 2016). Both bagging and boosting are also resampling methods because the large sample is partitioned and re-used in a strategic fashion. When different models are generated by resampling, inevitably some are high bias model (underfit) while some are high variance model (overfit). In the end, the ensemble cancels out these errors. In addition, it can also account for sample variation. Specifically, each model carries a certain degree of sampling bias, but finally the errors also cancel out each other (Wujek, 2016).
Bagging
Bagging, also known as the bootstrap forest, is a parallel method: in the first stage all resamples are generated independently by sampling with replacement and these replicates do not inform each other (Breiman, 1996). Additionally, in each bootstrap sample about 30% of the observations are set aside for later model
validation. These observations are grouped as the out of bag sample (OOBS) (Zaman & Hirose, 2011). At the second stage, the computer algorithm converges these resampled results together by averaging them out. Consider this metaphor: After 100 independent researchers conducted his/her own analysis; this research assembly combines their findings as the best solution.
No double counting on this type of collective wisdom is better than relying on one-person’s decision.
However, it is important to note that the bootstrap method works best when each model yielded from resampling is independent and thus these models are truly diverse. If all researchers in the assembly think in the same way, then no one is thinking. By the same token, if the bootstrap replicates are not diverse, the result might not be as accurate as expected. Putting it bluntly, if there is a systematic bias and the classifiers are bad, bagging these bad classifiers can make the end model worse (Hastie, Tibshirani, & Friedman, 2016). As mentioned before, in theory, an ensemble method should suppress both bias and variance by merging overfitted and underfitted models. However, Kotsiantis (2013) found that bagging tends to generate less heterogeneous models than its boosting counterpart. Additionally, Fumera, Roli, and Serrau (2005) found that the misclassification rate of bagging has the same bias as a single bootstrap though the variance is reduced by increasing the number of resamples. This can be explained by the disposition of overfitting in bagging. When these overfitted models are averaged, the same bias is retained while the variance is canceled out.
Boosting
Boosting, also known as the boosted tree, is a sequential and adaptive method because the previous model informs the next model so that improvement can be made through subsequent modeling (Breiman, 1998; Freund & Schapire, 1997; Optiz &Maclin, 1999). Initially, all observations are assigned the same weight. If the model fails to classify certain observations correctly, then these cases are assigned a heavier weight so that they are more likely to be selected in the next model. In the subsequent steps, each model is constantly revised in an attempt to classify those observations successfully. Boosting is so named because of gradient improvement by learning mistakes in previous steps. Ultimately, the final model is created by a majority vote as the best solutions are kept and the worst ones are eliminated.
While bagging requires many independent models for convergence, boosting reaches a final solution after a few iterations. Hence, boosting is much less computing-intensive than bagging. The differences between bagging and boosting is summarized in Table 1.
Debate on Bagging and Boosting
Whether bagging or boosting is better has been an ongoing debate for nearly two decades. It is not surprising to see that in some situations, bagging outperforms boosting whereas in others the outcomes are reversed (Chandrahasan, Christobel, Sridhar, & Arockiam, 2011; Dietterich, 2000; Khoshgoftaar, van Hulse, & Napolitano, 2011; Kotsiantis, 2013; Wang, Zhang, & Guo, 2015; Zaman & Hirose, 2011). Many studies concluded that boosting outperforms bagging in most cases, specifically when the analyst works with a noisy data set. On the other hand, bagging is a suitable option in data environment with less noise (Dietterich, 2000; Khoshgoftaar et al., 2011). Nonetheless, it is impractical for the researcher to analyze how noisy the data set is before choosing a particular ensemble approach. In addition, the bias–variance tradeoff is a central but insurmountable problem in machine learning. Ideally, the analyst hopes to obtain a model that can accurately detect the patterns in the data set and also generalize the finding to unseen data. As aforementioned, bagging is good at minimizing variance whereas boosting is capable of reducing bias, but none can accomplish both simultaneously.
The authors are convinced that there is no single best ensemble method applicable to analyze all
situations. One strategy is to run both analysis and select the better fitting one by model comparison. In model comparison, there are several criteria for assessing the goodness of a model, namely, the R2, the Root Average Squared Error (RASE), the Average Absolute Error (ASE), Akaike's information criterion (AIC), and Bayesian Information Criterion (BIC). The R2 is the variance explained whereas ASE is the average error rate of the model. RASE is the same as RMSE except that RMSE adjusts for degrees of freedom but RASE does not. AIC developed by Hirotsugu Akaike (1973) is in
alignment with Ockham’s razor: Given all things being
equal, the simplest model tends to be the best one, and simplicity is a function of the number of adjustable parameters. BIC is similar to AIC, but its penalty against complexity is heavier than that of AIC (Burnham & Anderson, 2004; Yang, 2005). Once again, there is no single best criterion. If the researcher would like to obtain an explanatory model that can retrospectively illuminate the relationship between the variables, then variance explained and error rates should be taken into account. If the project aims to generate a predictive model that can inform decision makers about what output is expected given certain input, then the misclassification rate or the hit rate should be the primary criterion. If the research objective is to find a compact model that yields practical and manageable action items, then AIC or BIC should be considered. The diverse and even contradictory results in comparing various ensemble methods is due to the fact that different criteria could lead to different conclusions. For example, in a recent study Hamori, Kawai, Kume, Murakami, and Watanabe (2018) found that boosting is Table 1. Comparison of bagging and boosting
Bagging Boosting
Sequent Two-step Sequential
Partitioning data into subsets Random Give misclassified cases a heavier weight Sampling method Sampling with replacement Sampling without replacement
Relations between models Parallel ensemble: Each model is
independent Previous models inform subsequent models Goal to achieve Minimize variance Minimize bias, improve predictive
power Method to combine models Weighted average Majority vote
superior to all other machine-learning methods, including neural networks. However, it is noteworthy that this conclusion is based on the criterion of predictive accuracy, not variance explained or simplicity. Further, in model comparison, the values in the final model (i.e. the validation model), instead of the training model, were evaluated because the training model is always overfitted. Unlike classical hypothesis testing, which relies on a cut-off for decision-making, the data mining method aims to recognize the data pattern, without a rigid cut-off for variable selection.
After identifying the best model and the most important predictors, median smoothing was utilized to examine the relationship of the predictors and the learning outcomes. In this large-scale assessment, the sample size of each OECD member nation was around 5,000. When thousands of data points generate a noisy scatterplot, detecting a pattern within the sample becomes challenging. This problem, called overplotting, is resolved by dividing the data into several portions along the x–dimension, computing the median of y in each portion, and looking at the trend after connecting the medians (Tukey, 1977; Yu, 2014).
Results
Bagging, Boosting, and Model Comparison
Table 2 shows the descriptive statistics of the U.S. test scores. For inferential statistics, variables related to readiness to learn, cultural engagement, political efficacy, and social trust were input into bagging and boosting as predictors of composite learning outcomes, respectively. The OLS regression, bagging, and boosting results were evaluated by model comparison criteria and the best one was retained (see Table 3). The primary goal of this project is an explanation, rather than prediction or simplification (selecting the most compact model), and therefore R2, RASE, and AAE are taken into account for model comparison. It is evident that both bagging
and boosting outperformed OLS regression in terms of variance explained and the error rate. More importantly, as shown in Table 4, in OLS regression almost every predictor is found to be significant in a two-tailed test (p < .05). If a one-tailed test is used, then every predictor is significant. This result is partly due to collinearity (the inter-relationships among the predictors influence the magnitude of the regression estimates). However, decision tree, which is the building block of bootstrap forest, is immune to multicollinearity (Fielding, 2007). Further, it is important to re-emphasize that no cross-validation (CV) by subsetting the data was done for
regression modeling and thus stability of this “good”
result is in question. On the other hand, subsetting was used in both bagging and boosting. In training the bootstrap method yielded overfitted models because the R2 is unreasonably high. Therefore, a proper comparison should be based on the validation results only. Using the criteria of R-square, RASE, and AAE, the boosted tree model slightly outperformed the bagging approach (higher variance explained and lower error).
Table 5 shows the ranking of predictors in relation to the overall learning outcomes. The top three predictors were cultural engagement (voluntary work for non-profit organizations), social trust (other people take advantage of you), and readiness to learn (like learning new things).
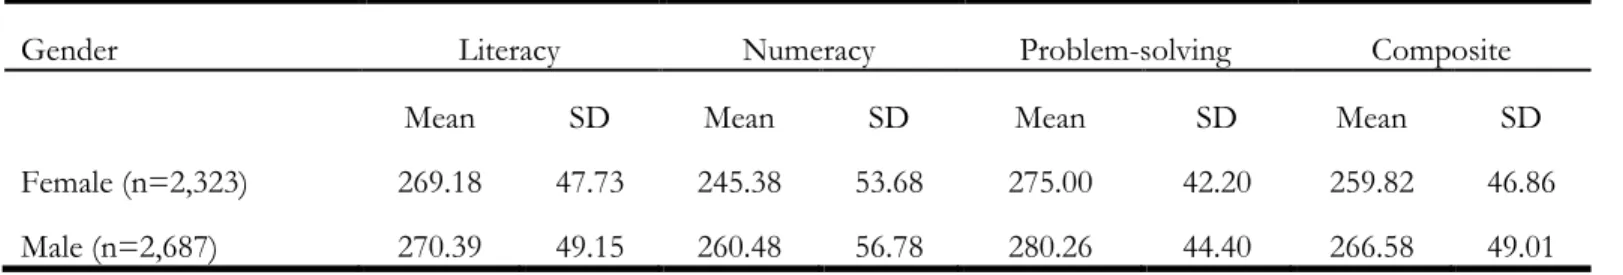
Table 2. Descriptive statistics of test scores of the USA
Gender Literacy Numeracy Problem-solving Composite Mean SD Mean SD Mean SD Mean SD Female (n=2,323) 269.18 47.73 245.38 53.68 275.00 42.20 259.82 46.86 Male (n=2,687) 270.39 49.15 260.48 56.78 280.26 44.40 266.58 49.01
Table 3. Model comparison
Subset
type Method R2 RASE AAE No subset regression OLS 0.1647 43.692 34.603 Training Boosting 0.2058 42.708 34.031 Training Bagging 0.4813 34.515 26.979 Validation Boosting 0.1791 43.488 34.597
Validation Bagging 0.1685 43.768 34.689
Table 4. OLS regression result
Predictor Estimate ErrorStd. Ratiot p
Relate new ideas
into real-life 13.07 0.85 15.32 <.0001* Like learning new
things 1.93 1.02 1.89 0.0595 Attribute
something new 1.54 0.98 1.56 0.1180 Get to the bottom
of difficult things 1.80 0.91 1.96 0.0497* Figure out how
different ideas fit
together -3.46 0.96 -3.61 0.0003* Looking for additional info 0.56 0.95 0.59 0.5576 Voluntary work for non-profit organizations 4.50 0.56 7.97 <.0001* No influence on the government -3.08 0.53 -5.85 <.0001* Trust only few
people -3.57 0.61 -5.84 <.0001* Other people take
advantage of you -3.28 0.73 -4.50 <.0001*
Table 5. The final boosted tree model for the USA sample
Variable Number of Splits Sum of squares
Voluntary work for non-profit
organizations 17 1.1594e+11 Other people take advantage of
you 29 8.5015e+10
Like learning new things 23 7.687e+10 Figure out how different ideas fit
together 20 4.5563e+10 Attribute something new 22 3.86e+10 Get to the bottom of difficult
things 16 3.6352e+10 No influence on the government 17 3.2498e+10 Relate new ideas to real life 29 2.499e+10 Looking for additional info 16 1.7984e+10 Trust only few people 12 1.5299e+10
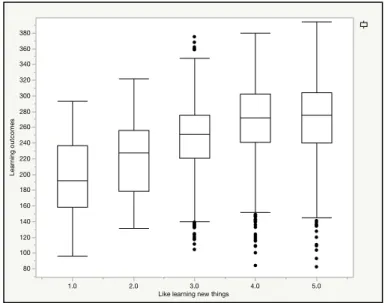
The relationship between readiness to learn and learning outcomes were positive and linear. However, non-linear patterns were detected when social trust and cultural engagement regressed against learning outcomes. Because the sample size was considerably large, median smoothing was employed for each level of the X variable. By doing so, the X-Y association could be detected by the trend of the medians.
Figure 3. Median smoothing plot of learning outcomes and cultural engagement in the U.S. sample.
Figure 4. Median smoothing plot of learning outcomes and social trust in the U.S. sample.
Figure 5. Median smoothing plot of learning outcomes and readiness to learn in the U.S. sample.
Conclusion
GeneralizabilityDue to the large sample size and use of multi-stage sampling scheme, the findings based upon this sample could be well-generalized to the entire U.S. population. If a simple random sampling method is applied to the nation, participants from bigger cities and states (e.g. New York, NY; Los Angeles, CA) might be over-represented. As a remedy, in this multi-stage sampling scheme, the population is partitioned into 50 segments (states) and demographic information of each state was sourced from the Census Bureau. In the subsequent stages, participants were selected from every corner of the country while non-citizens were excluded (OECD, 2016). Additionally, many social science studies are conducted with samples that are small and disproportionally drawn from Western, educated, industrialized, rich, and democratic populations (WEIRD; Henrich, Heine, & Norenzayan, 2010). This nationwide sample alleviates the problem of WEIRD.
Discussion
Analyzing archival data are challenging to psychological researchers because conventional statistical procedures might be inappropriate to big data analytics. One potential shortcoming is that with a huge sample size the statistical power of a parametric test would approach 99%, and therefore even trivial effects might be misidentified as significant. Furthermore, this
overfitted model might yield a high error rate (i.e. “miss rate”) and a low accuracy rate (i.e. “hit rate”) in
prediction. On the contrary, a bootstrap forest model typically yields a higher hit rate (Cutler, 2017).
Although big data analytics has become well established in business, public health, physical science, technology, and engineering, some researchers rarely use this emerging methodology (Cheung & Jak, 2016; Dede, Ho, & Mitros, 2016; Sinharay, 2016). One possible reason is that big data analytics may be confusing to many. Like any other statistical methods, there are pros and cons in different data mining techniques, leading to difficulty in deciding which method is more appropriate than another at different times. Some researchers count on simulation methods to examine the robustness of various techniques based on the assumption that real-world data are usually messy. However, it is unlikely for simulators to generate all possible scenarios and
therefore advice like “in most cases” one particular
method is superior to another is not helpful. Hence, it is the conviction of the authors that method choice and model goodness should be assessed on a case-by-case basis. Despite the fact that bagging is relatively resource-demanding, most mid-range computers are capable of performing a bootstrap forest in a short time. It is advisable to run both bagging and boosting, and then choose the best result according to the criteria of model comparison. In addition, the developers go even one step further by creating an ensemble of models yielded from different modeling techniques, such as regression,
neural networks, decision tree, boosting, bagging…etc. (Dean, 2018). Discussion of “the ensemble of ensembles” is out of the scope of this paper;
nonetheless, this emerging trend is promising and thus awaits further investigation in the future.
In hypothesis testing, decisions are based on certain cut-off points (e.g. p < .05, RMSEA < .1) whereas data mining emphasizes pattern recognition (Bishop, 2006; Kosinski, Wang, Lakkaraju, & Leskovec, 2016). In big data analytics, the picture is quite different. As shown in the results section, the output tables show the rank order of predictors yielded by bagging or boosting. Although this ranking mechanism may seem unfamiliar, it offers accuracy and efficiency when dealing with big data. Big data analytics utilizes both model building and data visualization, which greatly aid unveiling patterns that might go undetected.
In conclusion, it is the conviction of the authors that while the ensemble method, model comparison, and data visualization are employed side by side, interesting patterns and meaningful conclusions could be extracted
from a big data set. Psychological researchers are encouraged to consider these promising methodologies.
References
Akaike, Hirotsugu. (1973). Information theory and an extension of the maximum likelihood principle. In B. N. Petrov and F. Csaki (Eds.), International Symposium on Information Theory (pp. 267-281). Budapest: Akademia Kiado.
Aparicio, M., & Costa, C. J. (2015). Data visualization.
Communication Design Quarterly Review, 3, 7-11.
Bishop, C. M. (2006). Pattern recognition and machine learning. New York, NY: Springer.
Breiman, L. (1996). Bagging predictors. Machine Learning, 24, 123–140.
Breiman, L. (1998). Arcing classifiers. Annals of Statistics, 26, 801–849.
Büchlmann, P., & Yu, B. (2002). Analyzing Bagging. The Annals of Statistics, 30, 927-961.
Burnham, K. P., and Anderson, D.R. (2004), Multimodel inference: Understanding AIC and BIC in model selection. Sociological Methods and Research, 33, 261-304. Chandrahasan, R. K., Christobel, A., Sridhar, U. R., &
Arockiam, L. (2011). An empirical comparison of boosting and bagging algorithms. International Journal of Computer Science and Information Security, 9(11), 147-152. Chen, S. C., Lin, S. W., & Chou, S. Y. (2011). Enhancing the
classification accuracy by scatter-search-based ensemble approach. Applied soft computing, 11, 1021-1028.
Cheung M. L., & Jak, S. (2016) Analyzing big data in psychology: A split/analyze/meta-analyze approach.
Frontiers in Psychology, 7, Article 738. doi: 10.3389/fpsyg.2016.00738
Cutler, R. (2017). What statisticians should know about machine learning? Proceedings of 2017 SAS Global Forum.
Retrieved from
http://support.sas.com/resources/papers/proceedings 17/0883-2017.pdf
Dean, J. (2018). Exploring SAS Enterprise Miner: Special collection. Cary, NC: SAS Institute Inc.
Dede, C., Ho, A., & Mitros, P. (2016, September/October). Big data analysis in higher education: Promises and pitfalls. Educause Review, 23-34.
Dietterich, T. (2000). An experimental comparison of three methods for constructing ensembles of decision trees:
Bagging, boosting and randomization. Machine Learning, 40(2), 139–157.
Efron, B. (1979). Bootstrap methods: Another look at the jackknife. The Annals of Statistics, 7, 1-26.
Efron, B. (1981). Nonparametric estimates of standard error: The jackknife, the bootstrap and other methods.
Biometrika, 63, 589-599.
Efron, B. (1982). The jackknife, the bootstrap, and other resampling plans. Society of Industrial and Applied Mathematics CBMS-NSF Monographs, 38.
Efron, B., & Tibshirani, R. J. (1993). An introduction to the bootstrap. New York, NY: Chapman & Hall.
Fielding, A. H. (2007). Cluster and classification techniques for the biosciences. New York, NY: Cambridge University Press.
Ffoulkes, P. (2017). insideBIGDATA: Guide to use of big data on an industrial scale. Retrieved from
https://insidebigdata.com/white-paper/guide-big-data-industrial-scale/
Freund, Y., & Schapire, R. (1997). A decision-theoretic generalization of on-line learning and an application to boosting. Journal of Computer and System Sciences, 55(1), 119–139.
Fumera, G., Roli, F. & Serrau, A. (2005). Dynamics of variance reduction in bagging and other techniques based on randomisation. Lecture Notes in Computer Science, 3541, 316–325.
Hamori, S., Kawai, M., Kume, T., Murakami, Y., & Watanabe, C. (2018). Ensemble learning or deep learning? Application to default risk analysis. Journal of Risk Financial Management, 11(1), 1-14.
https://doi.org/10.3390/jrfm11010012
Han, J., & Kamber, M. (2011). Data mining: Concepts and techniques (2nd ed.). Boston, MA: Elsevier.
Hastie, T., Tibshirani, R., & Friedman, J. (2016). The elements of statistical learning: Data mining, inference, and prediction. New York, NY: Springer.
Henrich, J., Heine, S. J., & Norenzayan, A. (2010). The weirdest people in the world? Behavioral and Brain Sciences, 33, 61–135.
http://dx.doi.org/10.1017/S0140525X0999152X Khoshgoftaar, T. M., Van Hulse, J. & Napolitano, A. (2011).
Comparing boosting and bagging techniques with noisy and imbalanced data. IEEE Transactions on Systems, Man and Cybernetics, Part A: Systems and Humans, 41, 552–568.
Kosinski, M., Wang, Y., Lakkaraju, H., & Leskovec. J. (2016). Mining big data to extract patterns and predict real-life outcomes. Psychological Methods, 21, 493–506. Kotsiantis, S. (2013). Bagging and boosting variants for
handling classifications problems: A survey. Knowledge Engineering Review, 29(1), 78–100.
doi:10.1017/S0269888913000313.
Krus, D. J. & Fuller, E. A. (1982). Computer-assisted multicross-validation in regression analysis. Educational and Psychological Measurement, 42, 187-193.
Kurtz, A. K. (1948). A research test of Rorschach test.
Personnel Psychology, 1, 41-53.
Landers, R. N., Brusso, R., Cavanaugh, K. J., & Collmus, A. B. (2016). A primer on theory-driven Web scraping: Automatic extraction of big data from the Internet for use in psychological research. Psychological Methods, 21, 475–492.
Laney, D. (2001). 3D data management: Controlling data volume, velocity, and variety. Retrieved from
https://blogs.gartner.com/doug- laney/files/2012/01/ad949-3D-Data-Management-Controlling-Data-Volume-Velocity-and-Variety.pdf Larose, D. (2014). Discovering knowledge in data: An introduction
to data mining. NJ: Wiley-Interscience.
Lemmens, A., & Croux, C. (2006). Bagging and boosting classification trees to predict churn. Journal of Marketing Research, 63, 276–286.
Loh, W. Y. (2011). Classification and regression trees. WIREs Data Mining and Knowledge Discovery, 1, 14-23. DOI: 10.1002/widm.8
Meir, R., & Rätsch, G. (2003). An introduction to boosting and leveraging. In: Advanced Lectures on Machine Learning. Lecture Notes in Computer Science, 2600, 118–
183.
Miller, P., Lubke, G. H., McArtor, D. B., & Bergeman, C. S. (2016). Finding structure in data using multivariate tree boosting. Psychological Methods, 21, 583–602.
Mosier, C. I. (1951). Problems and designs of cross-validation. Educational and Psychological Measurement, 11, 5-11.
Optiz, D., Maclin, R. (1999). Popular ensemble methods: An empirical study. Journal of Artificial Intelligence Research, 11, 169–198.
Organization for Economic Co-operation and Development [OECD]. (2016). Technical report of the survey of adult skills (PIAAC). Retrieved from
https://www.oecd.org/skills/piaac/_Technical%20Re port_17OCT13.pdf
Polikar, R. (2006). Ensemble based systems in decision making. IEEE Circuits and systems magazine, 6(3), 21-45. Rokach, L. (2010). Ensemble-based classifiers. Artificial
Intelligence Review, 33(1-2), 1-39.
Rosnow, R.L. & Rosenthal, R. (1989). Statistical procedures and the justification of knowledge in psychological science. American Psychologist, 44, 1276-1284.
Schapire, R. E., Freund, Y., Bartlett, P., & Lee, W. S. (1998). Boosting the margin: A new explanation for the effectiveness of voting methods. Annals of Statistics, 26, 1651–1686.
Sedgwick, M. (2016). How will big data affect evolution of social science? Social Science Space. Retrieved from
http://www.socialsciencespace.com/2016/12/will-big-data-affect-evolution-social-science/
Shen, W. N. (2018, October). When classical statistics meet modern data science. Paper presented at 2018 IDEAS SoCal AI & Data Science Conference, Los Angeles, CA.
Shmueli, G., Bruce, P. C., Stephens, M. L., & Patel. N. R. (2016). Data mining for business analytics: Concepts, techniques, and applications with JMP Pro. New York, NY: Wiley.
Sinharay, S. (2016). An NCME instructional module on data mining methods for classification and regression.
Educational Measurement: Issues and Practice, 35(3), 38-54. Skurichina, M., & Duin, R. P. (2002). Bagging, boosting and
the random subspace method for linear classifiers.
Pattern Analysis & Applications, 5, 121-135. Sotys, M., Jaroszewicz, S., & Rzepakowski, P. (2015).
Ensemble methods for uplift modeling. Data Mining and Knowledge Discovery, 29, 1531-1559. doi:
http://dx.doi.org.contentproxy.phoenix.edu/10.1007/s 10618-014-0383-9
Tukey, J. W. (1977). Exploratory data analysis. Reading, MA: Addison–Wesley Publishing Company.
Tukey, J. W. (1986). The collected works of John W. Tukey, Volume III: Philosophy and principles of data analysis: 1965– 1986. L. V. Jones (Ed.). Pacific Grove, CA: Wadsworth. Wang, G. W., Zhang, C. X., & Guo, G. (2015). Investigating
the effect of randomly selected feature subsets on bagging and boosting. Communications in Statistics— Simulation and Computation, 44, 636–646.
Wujek, B. (2016, September). Practical guidance for machine learning applications. Paper presented at SAS Analytics Experience Conference, Las Vegas, NV.
Yang, Y. (2005). Can the strengths of AIC and BIC be shared? Biometrika, 92, 937-950.
Yu, C. H. (2014). Dancing with the data: The art and science of data visualization. Saarbrucken, Germany: LAP.
Zaman, M. F., & Hirose, H. (2011). Classification
performance of bagging and boosting type ensemble methods with small training sets. New Generation Computing, 29, 277-292.
Appendix
Websites for archival data:• Center for Collegiate Mental Health (CCMH): http://ccmh.psu.edu/
• European Values Survey (EVS): http://www.europeanvaluesstudy.eu/
• Gallup Global Wellbeing (GGW): http://www.gallup.com/poll/126965/gallup-global-wellbeing.aspx
• Happy Planet Index (HPI): http://www.happyplanetindex.org/
• Inter-university Consortium for Political and Social Research (ICPSR):
https://www.icpsr.umich.edu/icpsrweb/
• National Opinion Survey Center (NORC): https://gssdataexplorer.norc.org/
• Programme for International Student Assessment (PISA): https://www.oecd.org/pisa/pisaproducts/
• Programme for the International Assessment of Adult Competencies (PIAAC):
http://www.oecd.org/site/piaac/publicdataandanalysis.htm
• Trends for International Math and Science Study (TIMSS): http://timssandpirls.bc.edu/
• United Nations Human Development Programme (UNDP): http://hdr.undp.org/en/data
• World Values Survey (WVS): http://www.worldvaluessurvey.org/wvs.jsp
• US Government's open data: http://data.gov
Citation:
Yu, C H., Lee, H S., Lara, E., & Gan, S. (2018). The Ensemble and Model Comparison Approaches for Big Data Analytics in Social Sciences. Practical Assessment, Research & Evaluation, 23(17). Available online:
http://pareonline.net/getvn.asp?v=23&n=17
Corresponding Author
Chong Ho Yu Associate Professor Azusa Pacific University