Programmed death ligand 1 expression and tumor-infiltrating
lymphocytes in glioblastoma
Anna Sophie Berghoff, Barbara Kiesel, Georg Widhalm, Orsolya Rajky, Gerda Ricken, Adelheid Wo¨hrer,
Karin Dieckmann, Martin Filipits, Anita Brandstetter, Michael Weller, Sebastian Kurscheid, Monika E. Hegi,
Christoph C. Zielinski, Christine Marosi, Johannes A. Hainfellner, Matthias Preusser, and Wolfgang Wick
Institute of Neurology, Medical University of Vienna, Vienna, Austria (A.S.B., G.R., A.W., J.A.H.); Department of Medicine I, Medical University of Vienna, Vienna, Austria (A.S.B., O.R., M.F., A.B., C.C.Z., C.M., M.P.); Comprehensive Cancer Center, Medical University of Vienna, Vienna, Austria (A.S.B., B.K., G.W., O.R., G.R., A.W., K.D., M.F., A.B., C.C.Z., C.M., J.A.H., M.P.); Department of Neurosurgery, Medical University of Vienna, Vienna, Austria (B.K., G.W.); Department of Radiotherapy, Medical University of Vienna, Vienna, Austria (K.D.); Department of Neurology, University Hospital Zurich, Zurich, Switzerland (M.W.); Laboratory of Brain Tumor Biology and Genetics, Service of Neurosurgery, Department of Clinical Neurosciences, University Hospital Lausanne (CHUV), Lausanne, Switzerland (S.K., M.E.H.); Neurology Clinic and National Center for Tumor Disease, University of Heidelberg, Heidelberg, Germany (W.W.); Clinical Cooperation Unit Neurooncology, German Cancer Consortium (DKTK) and German Cancer Research Center (DKFZ), Heidelberg, Germany (W.W.)Corresponding Author:Matthias Preusser, MD, Department of Medicine I and Comprehensive Cancer Center CNS Unit (CCC-CNS), Medical University of Vienna, Waehringer Guertel 18-20, 1090 Vienna, Austria (matthias.preusser@meduniwien.ac.at).
See the editorial by Vlahovic et al., on pages 1043–1045.
Background.Immune checkpoint inhibitors targeting programmed cell death 1 (PD1) or its ligand (PD-L1) showed activity in sev-eral cancer types.
Methods.We performed immunohistochemistry for CD3, CD8, CD20, HLA-DR, phosphatase and tensin homolog (PTEN), PD-1, and PD-L1 and pyrosequencing for assessment of the O6-methylguanine-methyltransferase (MGMT) promoter methylation status in 135 glioblastoma specimens (117 initial resection, 18 first local recurrence). PD-L1 gene expression was analyzed in 446 cases from The Cancer Genome Atlas.
Results.Diffuse/fibrillary PD-L1 expression of variable extent, with or without interspersed epithelioid tumor cells with membranous PD-L1 expression, was observed in 103 of 117 (88.0%) newly diagnosed and 13 of 18 (72.2%) recurrent glioblastoma specimens. Sparse-to-moderate density of tumor-infiltrating lymphocytes (TILs) was found in 85 of 117 (72.6%) specimens (CD3+78/117, 66.7%; CD8+52/117, 44.4%; CD20+27/117, 23.1%; PD1+34/117, 29.1%). PD1+TIL density correlated positively with CD3+(P ,.001), CD8+(P,.001), CD20+TIL density (P,.001), and PTEN expression (P¼.035). Enrichment of specimens with low PD-L1 gene expression levels was observed in the proneural and G-CIMP glioblastoma subtypes and in specimens with high PD-L1 gene expression in the mesenchymal subtype (P¼5.966e-10). No significant differences in PD-L1 expression or TIL density between initial and recurrent glioblastoma specimens or correlation of PD-L1 expression or TIL density with patient age or outcome were evident.
Conclusion.TILs and PD-L1 expression are detectable in the majority of glioblastoma samples but are not related to outcome. Because the target is present, a clinical study with specific immune checkpoint inhibitors seems to be warranted in glioblastoma.
Keywords:glioblastoma, immune checkpoint, programmed death 1, programmed death ligand 1.
Glioblastoma is the most common primary brain tumor in adults and is associated with high morbidity and poor median overall survival of14 –17 months across contemporary stud-ies.1The current treatment standard for newly diagnosed glio-blastoma comprises maximal safe resection followed by combined radiochemotherapy with temozolomide. So far,
experimental treatments with a number of biologicals such as anti-invasive (eg, cilengitide) and antiangiogenic (eg, cedira-nib, bevacizumab) agents or inhibitors of specific oncogenic sig-naling pathways (eg, erlotinib, gefitinib, imatinib, temsirolimus, everolimus, enzastaurin) have failed to show overall survival benefits in glioblastoma.2–6Novel treatment concepts based
Received 30 July 2014; accepted 4 October 2014
#The Author(s) 2014. Published by Oxford University Press on behalf of the Society for Neuro-Oncology. All rights reserved.
For permissions, please e-mail: journals.permissions@oup.com.
Neuro-Oncology
Neuro-Oncology17(8), 1064–1075, 2015doi:10.1093/neuonc/nou307
on biological insights are urgently needed to improve patient outcomes.
Glioblastoma has long been recognized as an immunosup-pressive neoplasm characterized by activation of various im-mune escape mechanisms including upregulation of transforming growth factor-b(TGF-b), indoleamine 2,3 dioxyge-nase (IDO), and programmed death ligand 1 (PD-L1, also known as B7-H1).7–9Emerging evidence suggests differential
immuno-geneity of molecular glioblastoma subtypes with the mesenchy-mal subtype showing more prominent infiltration by tumor-associated lymphocytes (TILs) and expression of immune inhibitory molecules.10,11Furthermore, loss of phosphatase and
tensin homolog (PTEN), a recurring molecular alteration in glio-blastoma, has been postulated to induce PD-L1 expression.9
Recently, a novel class of immune modulatory antineoplas-tic agents, the so-called immune checkpoint inhibitors, has shown impressive activity with high response rates and durable tumor remissions in several cancer types including melanoma, lung cancer, renal cell carcinoma, bladder cancer, and head and neck cancer.12,13These agents act by blocking immuno-suppressive receptors that inhibit effector T-cells and thus facil-itate the antitumor immune response. Currently, immune checkpoint inhibitors targeting the programmed death 1 (PD-1) molecule and its ligand PD-L1 are in advanced clinical development and show compelling activity and favorable tox-icity profiles across tumor types. PD-1 is a cell surface co-inhibitory receptor that is expressed on CD3+/CD8+T-cells after activation and limits immune response, thus resulting in functionally “exhausted” T cells.14Importantly, tumoral ex-pression of PD-L1, as assessed by immunohistochemistry, seems to correlate with response to PD-1/PD-L1 inhibitors and may emerge as a clinically relevant biomarker.13,15
Cumu-lating evidence, mostly from preclinical studies and experimen-tal models, indicates a prominent activation of PD-L1 in glioblastoma.9,16–22However, systematic studies on the ex-pression of PD-L1 in human tissue samples are lacking so far. Thus, we set out to characterize PD-L1 expression and its asso-ciation with other tissue-based and clinical parameters in a well-annotated retrospective series of human glioblastoma samples, including matched recurrent tumors to provide a basis for clinical trials and translational biomarker research. We also investigated PD-L1 gene expression and its correlation with patient outcome and molecular glioblastoma subtypes in the dataset of The Cancer Genome Atlas (TCGA).
Methods
Patients and Materials
Vienna Retrospective Cohort
We retrospectively identified formalin-fixed and paraffin-embed-ded (FFPE) tumor tissue specimens of 117 adult patients who underwent neurosurgical resection of newly diagnosed glioblas-toma at the Department of Neurosurgery, Medical University of Vienna, between 2006 and 2012 from the Neuro-Biobank of the Institute of Neurology, Medical University of Vienna. An addition-al FFPE tumor specimen from the neurosurgicaddition-al resection of the first local recurrence was available for 18 patients. Therefore, a total of 135 specimens (117 newly diagnosed glioblastomas
and 18 matched local recurrences) were used for this study. His-tological diagnosis of glioblastoma was performed according to current WHO classification.23Clinical data were extracted by
chart review, and survival data were retrieved from the Austrian Brain Tumor Registry.24,25The ethics committee at Medical Uni-versity of Vienna approved the study (Vote 078/2004).
The Cancer Genome Atlas Dataset
We obtained clinical and glioblastoma gene expression data for a cohort of 446 patients available at TCGA (https://tcga-data.nci. nih.gov/tcga/). Expression levels of the PDL-1 (CD274) gene were derived from TCGA Agilent custom design platform and were represented by a single probe (A_23_P338479). The clinical data and annotation for MGMT promoter methylation and other molecular annotation were taken from Brennan et al 2013.26
MGMT Pyrosequencing
For determination of theMGMTpromoter methylation status, six 10mm sections of newly diagnosed glioblastoma FFPE tis-sue blocks from the Vienna cohort were cut into an Eppendorf tube. DNA isolation was performed using the EpiTect FFPE Lysis Kit (Qiagen), and bisulfite modification was performed using the EpiTect Fast FFPE Bisulfite Kit (Qiagen). Pyrosequencing analysis was performed on a PyroMark Q24 MDx (Qiagen) sys-tem with the therascreen MGMT Pyro Kit (Qiagen).27In line with
previous publications, specimens with a mean methylation per-centage ,8% were regarded as MGMT promoter unmethy-lated, and specimens with a mean methylation percentage
≥8% were regarded as MGMT promoter methylated.27,28
Immunohistochemical Staining
For immunohistochemical staining, FFPE blocks from the Vien-na cohort were cut into serial 3mm slices with a microtome. Immunohistochemistry for CD3, CD8, PD-1, CD20, HLA-DR, GFAP, and PTEN was performed with a Ventana Benchmark Ultra immunostaining system, and immunohistochemistry for PD-L1 was performed using a Dako AutostainerPlusLink immu-nostaining system. Immuimmu-nostaining was performed on adja-cent sections to facilitate comparison of regional distributions of PD-L1 and PTEN expression and TIL infiltration. Antibodies and immunostaining protocols are listed in Supplementary Table S1. FFPE tissue blocks of human non-neoplastic lymph nodes (TILs) and human placenta (PD-L1) were used as positive controls. Endothelial cells within the tumor tissue served as in-ternal positive control for PTEN immunostaining.
Evaluation of Immunohistochemistry
PD-L1 and PTEN Expression
PD-L1 expression was descriptively recorded according to the cellular and topographical localization, distribution, and inten-sity of the immunohistochemical signal.
The extent of diffuse/fibrillary PD-L1 and PTEN expression throughout the tumor tissue was semiquantitatively assessed according to the following criteria18,29: (i) no positive tumor areas; (ii) expression in,25% of non-necrotic tumor area; (iii)
expression in.25% and,50% of non-necrotic tumor area; (iv) expression in.50% and,75% of non-necrotic tumor area; (v) expression in.75% of non-necrotic tumor area.
Presence of epithelioid tumor cells with distinct membra-nous anti-PD-L1 labeling was recorded only if they constituted .5% of all tumor cells by semiquantitative assessment in order to comply with the cutoff used in previous publications.13
Tumor-infiltrating Lymphocyte Density
Density of CD3+, CD8+, PD1+, and CD20+TIL subsets was evaluated by overall impression at low microscopic magnifica-tion (100×). Furthermore, the densities were separately scored at higher magnification (200x – 400x) in predefined regions of interest, namely: (i) within the glioblastoma tissue; (ii) in peri-vascular regions; and (iii) in the infiltration zone to the brain pa-renchyma. Previously published semiquantitative evaluation criteria were used to describe TIL infiltration density, and TIL density was judged to be sparse, moderate, or dense.30The re-gional distributions of the various TIL subset infiltrates and PD-L1-positive and PTEN-positive tumor areas were compared on adjacent tissue sections.
Statistical Analyses
Spearman correlation was applied to analyze correlation of 2 or-dinal parameters. The chi-square test was used to assess group differences as appropriate. Overall survival from diagnosis of glioblastoma to death or last follow-up was estimated using the Kaplan-Meier limit method. The log-rank test was used to as-sess group differences. A Cox regression model was used to an-alyze the association of continuous variables with survival. A 2-tailed significance level (Pvalue) of .05 was applied. Because of the exploratory and hypothesis-generating design of the pre-sent study, no adjustment for multiple testing was applied.31All statistical analysis was performed with a statistical package for the social sciences (SPSS) 20.0 software (SPSS Inc).
Results
Vienna Retrospective Cohort
Patients
The patients’ characteristics including clinical baseline parame-ters, details on administered therapies, and results of MGMT promoter methylation status testing are listed in Table1.
PD-L1 Expression
We found prominent PD-L1 staining of variable extent in glioblas-toma tissues, while the surrounding CNS tissue generally showed no or only very faint and diffuse focal labeling of the neuropil and occasional light staining of single and dispersed parenchymal cells, such as neurons and microglia/macrophages (Fig.1).
The majority of glioblastoma cases, 103 of 117 (88.0%) newly diagnosed and 13 of 18 (72.2%) recurrent cases showed a prominent diffuse/fibrillary expression pattern of variable ex-tent (Fig.2). Diffuse/fibrillary PD-L1 expression was typically found in a patchy distribution throughout the tumor tissue without accentuation in the perivascular or perinecrotic areas.
Interspersed singular or focally aggregated epithelioid tumor cells with distinct and strong membranous PD-L1 immu-nolabeling were found in 44 of 117 (37.6%) newly diagnosed and 3 of 18 (16.7%) recurrent glioblastomas (Fig.2). Some faint diffuse or granular cytoplasmic staining was also observed in some of these tumors in addition to the membranous signal. Epithelioid PD-L1+tumor cells were found exclusively in spec-imens with diffuse/fibrillary PD-L1 expression.
Table2details the results of semiquantitative evaluation of tumoral PD-L1 expression.
Surrounding brain parenchyma was present and thus evalu-able for PD-L1 expression in 48 of 117 (41.0%) specimens with newly diagnosed glioblastoma. Among these, we found some faint anti-PD-L1 staining of neurons in 32 of 48 (66.7%) speci-mens, while no neuronal PD-L1 expression was detected in 16 of 48 (33.3%) specimens.
Tumor-infiltrating Lymphocytes and Microglia/
Macrophages
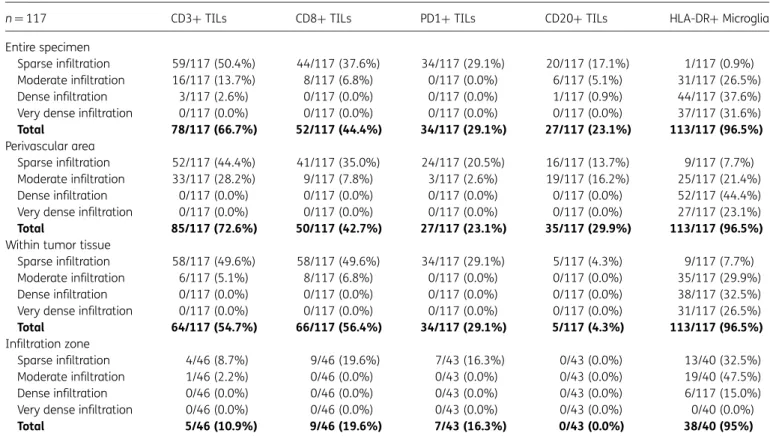
TIL infiltration of variable density was observed in 85 of 117 (72.6%) newly diagnosed and 15 of 18 (83.3%) recurrent glio-blastoma specimens. TIL infiltration was generally of sparse-to-moderate density, and TILs were mainly located in perivascular areas and zones of tumor invasion into the sur-rounding brain parenchyma (Fig.3). TILs were only found infre-quently within the tumor tissue and in perinecrotic areas. HLA-DR+microglia/macrophages were distributed diffusely throughout the tumor tissue. Table3shows the results of semi-quantitative evaluation of the density and distribution of CD3+, CD8+, CD20+, PD1+, and HLA-DR+cells.
PTEN Expression
Anti-PTEN immunostaining distinctly labeled the endothelial cells. Diffuse/fibrillary and membranous PTEN expression of tumor tissue was variably detected in a patchy pattern throughout the tumor tissue, without clear-cut accentuation around necrotic areas or vascular structures.
The semiquantitative distribution of tumoral PTEN expres-sion was as follows in the newly diagnosed glioblastoma spec-imens: negative in 27 of 117 (23.1%) specimens;,25% of tumor tissue positive in 33 of 117 (28.2%) specimens;.25% and,50% of tumor tissue positive in 20 of 117 (17.1%) spec-imens;.50% and,75% of tumor tissue positive in 22 of 117 (18.8%) specimens; and.75% of tumor tissue positive in 15 of 117 (12.8%) specimens.
Among recurrent glioblastoma specimens, the semiquantita-tive distribution of tumoral PTEN expression was as follows: neg-ative in 8 of 18 (44.4%) specimens; ,25% of tumor tissue positive in 2 of 18 (11.1%) specimens;.25% and ,50% of tumor tissue positive in 2 of 18 (11.1%) specimens;.50% and ,75% of tumor tissue positive in 4 of 18 (22.2%) specimens; and .75% of tumor tissue positive in 2 of 18 (11.1%) specimens.
Comparison of the Spatial Distribution of Tissue-based
Parameters
Comparative evaluation of the spatial distribution of the various TIL subsets on adjacent sections showed regional overlap of TIL
infiltration as CD3+, CD8+, and PD1+TILs were evident in the same areas in consecutive sections (51/117 [43.6%] newly di-agnosed and 12/18 [66.7%] recurrent). Regional overlap of TIL
infiltration and PD-L1 expression was infrequently observed (18/117 [15.4%] newly diagnosed and 6/18 [33.3%] recurrent). No clear-cut accumulation of PD1+TILs was observed in the Table 1. Patient characteristics (Vienna retrospective cohort)
Entire Population (n¼117)
n %
Median age at diagnosis of glioblastoma, years (range) 60 (21– 80)
Extent of resection
Complete resection of contrast enhancement 58 49.6
Subtotal resection 59 50.4
Median Karnofsky performance score (range) 80% (10%– 100%)
MGMTpromoter status
Methylated 37 31.6
Unmethylated 62 53.0
Unknown 18 15.4
Steroids before glioblastoma resection
Yes 50 42.7
No 34 29.1
Unknown 33 28.2
Type of postoperative first-line therapy
EORTC/NCIC chemoradiotherapy regimen 93 79.5
EORTC/NCIC chemoradiotherapy regimen plus investigational agent 9 7.7
Other 10 8.5
Unknown 5 4.3
Neurosurgical resection at recurrence
Yes 18 15.4
No 99 84.6
Alive at last follow-up
Yes 37 31.6
No 80 68.4
Median overall survival in months (range) 12 (0–86)
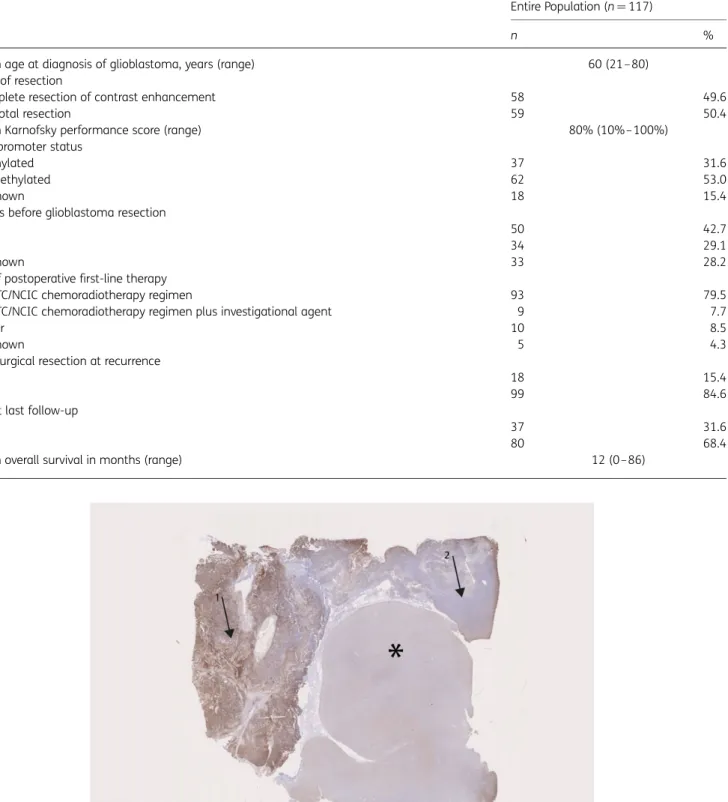
Fig. 1. Low-magnification overview (anti-PD-L1 immunostaining, original magnification×2) showing prominent and patchy PD-L1 expression (arrow 1: positive area, arrow 2: negative area) in tumor tissue of a glioblastoma and lack of PD-L1 expression in the adjacent brain parenchyma (asterisk).
immediate proximity to PD-L1+glioblastoma cells or PD-L1+ macrophages.
In most cases, we found no regional overlap of PTEN-negative and PD-L1 positive areas on adjacent sections. Only in a minority of specimens (31/117 [26.5%] newly diagnosed and 6/18 [33.3%] recurrent) did we find discordant expression profiles with PD-L1 positive areas lacking PTEN expression.
Statistical Analyses
Correlation of Tissue-based Parameters. PD1+TIL density correlated positively with CD3+ TIL density (P,.001, chi-square test), CD8+TIL density (P,.001, chi-square test), CD20+TIL density (P,.001, chi-square test), and PTEN expres-sion (P¼.035, chi-square test) but not with density of HLD-DR+
microglia/macrophages (P¼.215, chi-square test), MGMT pro-moter methylation status (P¼.195, chi-square test), membra-nous PD-L1 expression on epithelioid tumor cells (P¼.808, chi-square test), or diffuse/fibrillary PD-L1 expression (P¼ .766, chi-square test).
Diffuse/fibrillary PD-L1 expression was not correlated with CD3+TIL density (P¼.168, chi-square test), CD8+TIL density (P¼.068, chi-square test), CD20+ TIL density (P¼.516, chi-square test) or HLA-DR+microglia/macrophages (P¼.897, chi-square test), PTEN expression (P¼.232, chi-square test), or MGMT promoter methylation status (P¼.335, chi-square test). Furthermore, there was no correlation between presence of ep-ithelioid tumor cells with membranous PD-L1 expression and CD3+TIL density (P¼.555, chi-square test), CD8+TIL density (P¼.380, chi-square test), CD20+ TIL density (P¼.093, chi-square test), HLA-DR+microglia/macrophages (P¼.512, chi-square test), PTEN expression (P¼.329, chi-square test), or MGMT promoter methylation status (P¼.181, chi-square test).
Correlation of Tissue-based Parameters With Clinical Charac-teristics. There was no correlation between presurgical treat-ment with corticosteroids and membranous PD-L1 expression (P¼.283, chi-square test), diffuse/fibrillary PD-L1 expression (P¼.513, chi-square test), density of PD1+TILs (P¼.534, chi-square test), CD3+TILs (P¼.889, chi-square test), CD8+ TILs (P¼.190, chi-square test), CD20+ TILs (P¼.917, chi-square test), or density of HLA-DR+microglia/macrophages (P¼.542, chi-square test). Further, there was no evident corre-lation of age (,65 years vs.65 years) and membranous PD-L1 expression (P¼.612, chi-square test), diffuse/fibrillary PD-L1 expression (P¼.383, chi-square test), density of PD1+TILs (P¼.945, chi-square test), density of CD3+TILs (P¼.418, chi-square test), density of CD8+TILs (P¼.376; chi-square test), or density of HLA-DR microglia/macrophages (P¼.758; chi-square test). However, younger patients (aged,65 years) Fig. 2. Diffuse/fibrillary and membraneous PD-L1 expression in glioblastoma. (A – D) (adjacent sections of the same tissue specimen): In glioblastoma areas with diffuse/fibrillary histomorphology (A: hematoxylin and eosin (H&E) staining, original magnification×200; Aa: H&E staining, original magnification×800) and expression of glial fibrillary acidic protein (GFAP; B: anti-GFAP, original magnification×200) we found prominent diffuse/fibrillary PD-L1 expression (C and D: anti-PD-L1; C: original magnification×200, D: original magnification×400). (E – H) (adjacent sections of the same tissue specimen): In glioblastoma areas with epithelioid tumor cells (E: H&E staining, original magnification
×200; Ee: H&E staining, original magnification×800) and expression of glial fibrillary acidic protein (GFAP; F: anti-GFAP, original magnification
×200) we found prominent membranous PD-L1 expression and some faint diffuse or granular cytoplasmic staining (G and H: anti-PD-L1; C: original magnification×200, D: original magnification×400).
Table 2. Programmed death ligand 1 expression in the Vienna retrospective glioblastoma cohort
Newly Diagnosed Glioblastoma (n¼117) Recurrent Glioblastoma (n¼18) n % n % Diffuse/fibrillary PD-L1 expression None 18/117 15.4 5/18 27.8 ≤25% 18/117 15.4 3/18 16.7 .25%,≤50% 30/117 25.6 2/18 11.1 .50%,≤75% 39/117 33.3 6/18 33.3 .75% 12/117 10.3 2/18 11.1 Membranous PD-L1 expression
Positive (≥5% of tumor cells) 44/117 37.6 3/18 16.7 Negative (,5% of tumor cells) 73/117 62.4 15/18 83.3 Abbreviation: PD-L1, programmed death ligand 1.
presented more frequently with sparse and moderate density of CD20+TILs than patients aged≥65 years at diagnosis of glioblastoma (P¼.043, chi-square test).
Comparison Between Specimens of First and Second Resec-tion. The extent of diffuse/fibrillary PD-L1 expression did not differ between newly diagnosed and recurrent glioblastoma specimens (P¼.411, chi-square test; Table 4). Epithelioid tumor cells with anti – PD-L1 membrane labeling were more common in initial tumors (9/18, 50%) than in recurrent tumors (3/18, 16.7%;P¼.034, chi-square test).
There were no differences between the first and second re-section for PD1+TIL density (P¼.070, chi-square test), CD3+
TIL density (P¼.237, chi-square test), CD8+TIL density (P¼ .103, chi-square test), CD20+TIL density (P¼.122, chi-square test), HLA-DR+ microglia/macrophage density (P¼.085, chi-square test), or PTEN expression (P¼.289, chi-square test).
Survival Analyses. Young patient age at diagnosis of glioblas-toma (16 months for,65 years vs 11 months for≥65 years; P¼.034, log-rank test), high KPS (4 months for KPS,70% vs 17 months for KPS.70%;P,.001, log-rank test), greater ex-tent of resection (12 months for subtotal vs 18 months for total;P¼.003, log-rank test), and MGMT promoter hyperme-thylation (,8% for 11 months vs.8% for 18 months; P¼ .002, log-rank test) correlated with overall survival, while den-sity of PD1+TILs (15 months for absent vs 15 months for pre-sent;P¼.981, log-rank test), presence of diffuse/fibrillary PD-L1 expression (absent 15 months vs present 15 months;P¼.921, log-rank test), and presence of epithelioid tumor cells with
membranous PD-L1 expression (15 months for,5% vs 14 months for .5%; P¼.724, log-rank test), or presence of PD-L1- neurons (15 months for negative vs 12 months for pos-itive;P¼.533, log-rank test) showed no impact on survival times (Fig.4).
TCGA Dataset
Correlation of PD-L1 Gene Expression With Molecular
Glioblastoma Subtypes
In order to see if there was an association between PD-L1 ex-pression levels and known exex-pression subtypes, we classified samples into PD-L1 high/low based on median PD-L1 expres-sion levels. The results in Table5showed that there is a statisti-cally significant difference in the distribution of expression subtypes between PD-L1 high and low samples (P¼ 5.966e-10, Pearson’ chi-square test), with a particularly evident enrichment of proneural and G-CIMP expression subtypes in the PD-L1 low group, while the mesenchymal expression subtype is overrepresented in the PD-L1 high group.
Survival Analyses
Survival analysis using Cox proportional hazard (CPH) regression was performed in 2 separate subsets of the data. The first sub-set comprised a total of 446 patients. TheMGMTpromoter methylation status was excluded as a covariate because it was not complete for the 446 patients, and only age and PD-L1expression levels were included. PD-L1had no statisti-cally significant association with overall survival of patients by Fig. 3. (A) Dense CD3+TIL infiltration (magnification×200). (B) PD1+TILs infiltrating glioblastoma (magnification×400). (C) Perivascular infiltration with CD3+TILs (magnification×200). (D) CD3+TILs at the infiltration zone (magnification×200).
both univariate and multivariate CPH regression (Fig. 4H, Table6).
Discussion
PD/PD-L1 interactions are now considered central to the immu-nological control of cancer. Here we show prominent expres-sion of PD-L1 by tumor cells in a majority of human glioblastoma samples. We observed 2 main staining patterns, which likely relate to the particular and heterogeneous
microarchitecture of glioblastoma as captured in the widely used descriptive addendum “multiforme.” First, we detected clear membranous PD-L1 expression with distinct highlighting of tumor cell surfaces, as seen in epithelial cancers and mela-noma.15This expression pattern was mainly found on roundish,
nonfibrillar glioblastoma cells with well-delineated cytoplasm and cell membranes having some histological similarities with epithelial cells. Such epithelioid tumor cells are a well-recognized histological feature of glioblastomas and, in our se-ries, were interspersed within the tumor tissue as single cells or focal tumor cell aggregates in 37.6% of newly diagnosed and Table 3. Density of tumor-infiltrating lymphocytes and microglia/macrophage infiltration per tumor area in newly diagnosed glioblastoma samples in the Vienna retrospective cohort
n¼117 CD3+TILs CD8+TILs PD1+TILs CD20+TILs HLA-DR+Microglia
Entire specimen
Sparse infiltration 59/117 (50.4%) 44/117 (37.6%) 34/117 (29.1%) 20/117 (17.1%) 1/117 (0.9%) Moderate infiltration 16/117 (13.7%) 8/117 (6.8%) 0/117 (0.0%) 6/117 (5.1%) 31/117 (26.5%) Dense infiltration 3/117 (2.6%) 0/117 (0.0%) 0/117 (0.0%) 1/117 (0.9%) 44/117 (37.6%) Very dense infiltration 0/117 (0.0%) 0/117 (0.0%) 0/117 (0.0%) 0/117 (0.0%) 37/117 (31.6%)
Total 78/117 (66.7%) 52/117 (44.4%) 34/117 (29.1%) 27/117 (23.1%) 113/117 (96.5%)
Perivascular area
Sparse infiltration 52/117 (44.4%) 41/117 (35.0%) 24/117 (20.5%) 16/117 (13.7%) 9/117 (7.7%) Moderate infiltration 33/117 (28.2%) 9/117 (7.8%) 3/117 (2.6%) 19/117 (16.2%) 25/117 (21.4%) Dense infiltration 0/117 (0.0%) 0/117 (0.0%) 0/117 (0.0%) 0/117 (0.0%) 52/117 (44.4%) Very dense infiltration 0/117 (0.0%) 0/117 (0.0%) 0/117 (0.0%) 0/117 (0.0%) 27/117 (23.1%)
Total 85/117 (72.6%) 50/117 (42.7%) 27/117 (23.1%) 35/117 (29.9%) 113/117 (96.5%)
Within tumor tissue
Sparse infiltration 58/117 (49.6%) 58/117 (49.6%) 34/117 (29.1%) 5/117 (4.3%) 9/117 (7.7%) Moderate infiltration 6/117 (5.1%) 8/117 (6.8%) 0/117 (0.0%) 0/117 (0.0%) 35/117 (29.9%) Dense infiltration 0/117 (0.0%) 0/117 (0.0%) 0/117 (0.0%) 0/117 (0.0%) 38/117 (32.5%) Very dense infiltration 0/117 (0.0%) 0/117 (0.0%) 0/117 (0.0%) 0/117 (0.0%) 31/117 (26.5%)
Total 64/117 (54.7%) 66/117 (56.4%) 34/117 (29.1%) 5/117 (4.3%) 113/117 (96.5%)
Infiltration zone
Sparse infiltration 4/46 (8.7%) 9/46 (19.6%) 7/43 (16.3%) 0/43 (0.0%) 13/40 (32.5%) Moderate infiltration 1/46 (2.2%) 0/46 (0.0%) 0/43 (0.0%) 0/43 (0.0%) 19/40 (47.5%) Dense infiltration 0/46 (0.0%) 0/46 (0.0%) 0/43 (0.0%) 0/43 (0.0%) 6/117 (15.0%) Very dense infiltration 0/46 (0.0%) 0/46 (0.0%) 0/43 (0.0%) 0/43 (0.0%) 0/40 (0.0%)
Total 5/46 (10.9%) 9/46 (19.6%) 7/43 (16.3%) 0/43 (0.0%) 38/40 (95%)
Abbreviations: PD1, programmed death 1; TIL, tumor-infiltrating lymphocyte.
Table 4.Comparison of tumor-infiltrating lymphocyte density and programmed death ligand 1expression between newly diagnosed and matched recurrent glioblastoma specimens (Vienna retrospective cohort)
n¼18 Initial Tumor1, Recurrence1 Initial Tumor2 Recurrence2 Initial Tumor1 Recurrence -Initial Tumor2 Recurrence1 Diffuse/fibrillary tumoral PD-L1 expression 12/18 (66.7%) 1/18 (5.6%) 4/18 (22.2%) 1/18 (5.6%) PD-L1+epitheloid tumor cells 3/18 (16.7%) 15/18 (83.3%) 0/18 (0.0%) 0/18 (0.0%)
PD1+TILs 0/18 (0.0%) 15/18 (83.3%) 3/18 (16.7%) 0/18 (0.0%)
CD3+TILs 10/18 (55.6%) 3/18 (16.7%) 1/18 (5.6%) 4/18 (22.2%)
CD8+TILs 10/18 (55.6%) 2/18 (11.1%) 4/18 (22.2%) 2/18 (11.1%)
Fig. 4. A– G: Kaplan-Meier curves in the Vienna retrospective cohort. (A) Overall survival according to age. (B) Overall survival according to Karnofsky performance status. (C) Overall survival according to extent of resection. (D) Overall survival according to MGMT methylation status. (E) Overall survival according to membranous PD-L1 expression. (F) Overall survival according to diffuse/fibrillary PD-L1 expression. (G) Overall survival according to PD-L1 expression in neuron. (H) Kaplan-Meier curve in the TCGA cohort showing overall survival according to PD-L1 gene expression. AllPvalues are according to the log-rank test.
16.7% of recurrent glioblastoma specimens.23,32Second, in some of these tumor cells, we observed some faint diffuse or granular cytoplasmic staining in addition to the membranous signal. This may relate to internalized surface PD-L1 molecules, as PD-L1 storage and degradation in lysosomes have been de-scribed in lymphoma models.33In many cases (88.0% of newly diagnosed and 72.2% of recurrent glioblastoma cases), a prominent diffuse/fibrillary PD-L1 immunostaining pattern of variable extent was seen throughout the tumor tissue. Due to the intensity of this staining pattern, we believe it likely relates to membrane-bound PD-L1 on the delicate and intermingled tumor cell processes that form the pathognomic neurofibrillary matrix of diffuse astrocytic gliomas. However, distinct labeling of tumor cell membranes cannot be appreciated in this partic-ular histological presentation due to the limited spatial resolu-tion at the light microscopic level. We did not have the opportunity to investigate the subcellular distribution of PD-L1 (ie, by transmission electron microscopy with immunolabeled particles). Notably, we observed very faint (or absent) focal and diffuse staining in the neuropil in tumor-surrounding CNS tissue parts with occasional light labeling of parenchymal cell elements. Glial cells (astrocytes, microglia, oligodendrocytes) and neurons have been shown to express low or undetectable PD-L1 under basal conditions, but are able to upregulate PD-L1 in response to cytokine release in neuroinflammatory processes.34,35
The rate of PD-L1-positive cases in glioblastoma found in our study seems high in comparison with other solid tumor types, in which30% of melanoma cases and 25% – 36% of non – small cell lung cancer cases have been found to express PD-L1 by immunohistochemistry.36,37Our findings clearly cor-roborate previous studies in experimental models, suggesting a prominent involvement of the PD-1/PD-L1 axis in creating an immunosuppressive microenvironment in glioblastoma. Taken together, our data and the experimental evidence pro-vide a strong rationale for clinical trials investigating immune checkpoint inhibitors in this indication. Of particular interest in
this context are recent reports showing durable therapeutic ef-ficacy of immune checkpoint inhibition in animal models of glial brain tumors.8,22The high prevalence also allows clinical stud-ies without pretesting the PD-L1 status in the tumor tissue, al-though post hoc correlation of the extent of PD-L1 expression with response to treatment may be of interest. Of note, thera-peutic efficacy of the CTLA4 antibody ipilimumab against mel-anoma brain metastases has been documented, showing the feasibility of antibody-mediated immune-checkpoint inhibition in intraparenchymal CNS lesions.38,39However, further studies
will be important to investigate in detail the role of the blood-brain/blood-tumor barrier in drug penetration and intracerebral efficacy of immune checkpoint inhibitors. Given this uncertainty and the availability of PD1/PD-L1 inhibitors, these may also be an option for trials in patients with gliomas.
TIL infiltrates were generally sparse, with some concentra-tion in the perivascular areas rather than in the tumor tissue. This finding is well in line with previous observations on the dis-tribution of TILs in glioblastoma and suggests that TILs might not be able to readily migrate into the immunosuppressive tumor microenviroment and arrest in the perivascular space.40,41
Comparative analysis of newly diagnosed and 18 matched recurrent glioblastomas showed no clear upregulation or downregulation of PD-L1 and no significant changes in the den-sity of PD1+, CD3+, CD8+, or CD20+TILs over time. Diffuse/ fibrillary PD-L1 expression was common in both newly diag-nosed and recurrent specimens. Interspersed epithelioid cells with distinct membranous PD-L1 staining were more common-ly found in newcommon-ly diagnosed glioblastoma specimens than in re-current cases. However, this finding may be influenced by sampling error and does not necessarily indicate a clinically rel-evant dynamic in PD-L1 expression.
In our study, we used the noncommercial PD-L1 anti-body 5H1, which was kindly provided by Dr. Lieping Chen (Yale University). Specificity of this antibody was confirmed in a recent publication, while some commercially available Table 5. Link between expression subtypes and programmed death ligand 1 high/low patients (based on median PDL-1 expression levels) in The Cancer Genome Atlas dataset (n¼446)
Total Molecular Subtype Unknown
Classical G-CIMP Mesenchymal Neural Proneural
Total 446 16 127 31 126 62 84
PDL-1 high 223/446 (50%) 10/16 (62.5%) 68/127 (53.4%) 7/31 (22.6%) 85/126 (67.5%) 34/62 (54.8%) 19/84 (22.6%) PDL-1 low 223/446 (50%) 6/16 (37.5%) 59/127 (46.6%) 24/31 (77.4%) 41/126 (32.5%) 28/62 (45.2%) 65/84 (77.4%)
Table 6. Univariate and multivariate survival analyses in 446 TCGA patients
Covariate Univariate Analysis Multivariable Analysis
Coefficient HR 95% CI PValue Coefficient HR 95% CI PValue Age (continuous) 0.036842 1.038 1.028 –1.047 4.88e-15 0.036628 1.037 1.0277–1.047 1.07e-14
PDL-1 expression (continuous) 0.13397 1.143 0.9553– 1.368 .144 (NS) 0.034886 1.036 0.8702–1.232 .694 (NS) Abbreviations: CI, confidence interval; HR, hazard ratio.
antibodies failed to show reliable PD-L1 labeling.36Using the 5H1 antibody, a correlation of immunohistochemically detect-ed PD-L1 expression with response to PD1/PD-L1 inhibition has been shown in metastatic melanoma.13,15,42However, re-sponses to PD-1/PD-L1 inhibitors are observed in a significant fraction of patients with PD-L1 negative tumor samples, and the true predictive value of PD-L1 expression is under intense investigation in ongoing clinical trials.15,37
An association of PD-L1 expression and PTEN loss via PI3K/ AKT pathway signaling has been shown in several studies in squamous cell cancer, triple-negative breast cancer, pancreatic cancer, colorectal cancer, and glioblastoma.9,18,20,43–45
How-ever, we did not find a correlation of PD-L1 expression and lack of PTEN expression at the protein level in our study on human glioblastoma samples, and this lack of correlation is consistent with a recent study on melanoma.46PTEN protein expression has been shown to correlate poorly with (epi-) genetic PTEN aberrations in glioblastoma, and further studies may address whether PTEN methylation, PTEN mutations or PTEN deletions correlate with PD-L1 expression in glioblastoma tissue samples.29
Interestingly, we found a highly significant association of PD-L1 gene expression with molecular glioblastoma subtypes, with an enrichment of PD-L1 low specimens in the proneural and G-CIMP subtypes and PD-L1 high specimens in the mesen-chymal subtype. These results are well in line with some previ-ous studies showing evidence for increased immunological activity in mesenchymal glioblastomas and may be explained by an interaction of PD-L1 with signal transducer and activator of transcription 3 (STAT3). STAT3 has been shown to be a major promoter of PD-L1 expression that is upregulated in mesenchy-mal glioblastomas.11,47–50Based on our findings, clinical
stud-ies with PD1/PD-L1 inhibitors need to include investigation of differential response patterns across molecular glioblastoma subtypes.
Studies on the prognostic impact of tumoral PD-L1 expres-sion have shown inconsistent results across tumor types.20,51–53In our series including a total of 563 glioblastoma
cases from 2 independent cohorts, there was no association of PD-L1 expression with patient outcome. In particular, the prog-nostic impact of neuronal PD-L1 protein expression recently, which was described in a very small series of 17 glioblastoma cases, was not corroborated in our series of 117 specimens from the Vienna retrospective cohort.19We acknowledge that the power of survival analyses in our series is limited by the sample size and the retrospective study design, and our results surely need confirmation in larger and prospectively collected cohorts. However, the known prognostic factors of patient age, Karnofksy performance status, extent of resection, and MGMT promoter methylation status showed the expected sep-aration of prognostic groups and thus validate the suitability of our cohort for exploratory survival analyses.
In conclusion, this analysis shows that PD1 and/or PD-L1 are immunohistochemically detectable in a majority of glioblasto-ma samples, thus suggesting that the immunosuppressive PD1/PD-L1 axis is active in glioblastoma. A clinical study with specific immune checkpoint inhibitors is warranted in glioblas-toma, and it remains to be seen whether PD-L1 expression pat-terns or molecular glioblastoma subtypes will correlate with response to such treatments.
Supplementary Material
Supplementary material is available atNeuro-Oncology Journal online (http://neuro-oncology.oxfordjournals.org/).
Funding
The costs for this project were in part covered by the research budget of the Medical University of Vienna and the University of Heidelberg and were supported by the Medical Scientific Fund of the Mayor of the City of Vienna (project number 13082) and the Austrian Science Fund (clin-ical research program, project KLI 394).
Acknowledgements
We thank Dr. Lieping Chen (Yale University) for providing antihuman B7H1 antibody 5H1. We thank Elisabeth Dirnberger, Irene Leisser, and Cansu Ilhan for their excellent technical assistance.
The results published here are in part based upon data generated by TCGA pilot project established by the NCI and NHGRI. Information about TCGA and the investigators and institutions constituting TCGA research network can be found at http://cancergenome.nih.gov/.
The contents of this manuscript were partly presented during a Poster Highlight Session at the Annual Meeting of the American Society of Clinical Oncology on May 30, 2014.
Conflict of interest statement.The authors declare no conflicts of interest.
References
1. Preusser M, de Ribaupierre S, Wohrer A, et al. Current concepts and management of glioblastoma.Ann Neurol. 2011;70(1):9 –21. 2. Chinot OL, Wick W, Mason W, et al. Bevacizumab plus
radiotherapy-temozolomide for newly diagnosed glioblastoma.
N Engl J Med. 2014;370(8):709– 722.
3. Butowski N, Chang SM, Lamborn KR, et al. Phase II and pharmacogenomics study of enzastaurin plus temozolomide during and following radiation therapy in patients with newly diagnosed glioblastoma multiforme and gliosarcoma. Neuro Oncol. 2011;13(12):1331 –1338.
4. Wen PY, Yung WK, Lamborn KR, et al. Phase I/II study of imatinib mesylate for recurrent malignant gliomas: North American Brain Tumor Consortium Study 99 – 08.Clin Cancer Res. 2006;12(16): 4899–4907.
5. Wen PY, Chang SM, Lamborn KR, et al. Phase I/II study of erlotinib and temsirolimus for patients with recurrent malignant gliomas: North American Brain Tumor Consortium trial 04 – 02. Neuro Oncol. 2014;16(4):567– 578.
6. Kreisl TN, Lassman AB, Mischel PS, et al. A pilot study of everolimus and gefitinib in the treatment of recurrent glioblastoma (GBM).J Neurooncol. 2009;92(1):99 –105.
7. Tran TT, Uhl M, Ma JY, et al. Inhibiting TGF-beta signaling restores immune surveillance in the SMA-560 glioma model.Neuro Oncol. 2007;9(3):259– 270.
8. Wainwright DA, Chang AL, Dey M, et al. Durable therapeutic efficacy utilizing combinatorial blockade against IDO, CTLA-4 and PD-L1 in mice with brain tumors.Clin Cancer Res. 2014; 20(20):5290–5301.
9. Parsa AT, Waldron JS, Panner A, et al. Loss of tumor suppressor PTEN function increases B7-H1 expression and immunoresistance in glioma.Nat Med. 2007;13(1):84– 88. 10. Prins RM, Soto H, Konkankit V, et al. Gene expression profile
correlates with T-cell infiltration and relative survival in glioblastoma patients vaccinated with dendritic cell immunotherapy.Clin Cancer Res. 2011;17(6):1603– 1615. 11. Doucette T, Rao G, Rao A, et al. Immune heterogeneity of
glioblastoma subtypes: extrapolation from the cancer genome atlas.Cancer Immunol Res. 2013;1(2):112–122.
12. Wolchok JD, Kluger H, Callahan MK, et al. Nivolumab plus ipilimumab in advanced melanoma.N Engl J Med. 2013;369(2): 122– 133.
13. Topalian SL, Hodi FS, Brahmer JR, et al. Safety, activity, and immune correlates of anti-PD-1 antibody in cancer.N Engl J Med. 2012;366(26):2443–2454.
14. McDermott DF, Atkins MB. PD-1 as a potential target in cancer therapy.Cancer Med. 2013;2(5):662 – 673.
15. Taube JM, Klein AP, Brahmer JR, et al. Association of PD-1, PD-1 ligands, and other features of the tumor immune microenvironment with response to anti-PD-1 therapy. Clin Cancer Res. 2014;20(19):5064–5074.
16. Jackson CM, Lim M, Drake CG. Immunotherapy for brain cancer: recent progress and future promise.Clin Cancer Res. 2014;0(0): 0 –00.
17. Bloch O, Crane CA, Kaur R, et al. Gliomas promote immunosuppression through induction of B7-H1 expression in tumor-associated macrophages.Clin Cancer Res. 2013;19(12): 3165–3175.
18. Han SJ, Ahn BJ, Waldron JS, et al. Gamma interferon-mediated superinduction of B7-H1 in PTEN-deficient glioblastoma: a paradoxical mechanism of immune evasion.Neuroreport. 2009; 20(18):1597– 1602.
19. Liu Y, Carlsson R, Ambjorn M, et al. PD-L1 expression by neurons nearby tumors indicates better prognosis in glioblastoma patients.J Neurosci. 2013;33(35):14231–14245.
20. Song M, Chen D, Lu B, et al. PTEN loss increases PD-L1 protein expression and affects the correlation between PD-L1 expression and clinical parameters in colorectal cancer.PLoS One. 2013;8(6):e65821.
21. Wintterle S, Schreiner B, Mitsdoerffer M, et al. Expression of the B7-related molecule B7-H1 by glioma cells: a potential mechanism of immune paralysis. Cancer Res. 2003;63(21): 7462– 7467.
22. Zeng J, See AP, Phallen J, et al. Anti-PD-1 blockade and stereotactic radiation produce long-term survival in mice with intracranial gliomas.Int J Radiat Oncol Biol Phys. 2013;86(2): 343– 349.
23. Louis DN, Ohgaki H, Wiestler OD, et al. The 2007 WHO classification of tumours of the central nervous system.Acta Neuropathol. 2007;114(2):97– 109.
24. Woehrer A. Brain tumor epidemiology in Austria and the Austrian Brain Tumor Registry.Clin Neuropathol. 2013;32(4):269–285. 25. Wohrer A, Waldhor T, Heinzl H, et al. The Austrian Brain Tumour
Registry: a cooperative way to establish a population-based brain tumour registry.J Neurooncol. 2009;95(3):401–411. 26. Brennan CW, Verhaak RG, McKenna A, et al. The somatic genomic
landscape of glioblastoma.Cell. 2013;155(2):462– 477.
27. Preusser M, Berghoff AS, Manzl C, et al. Clinical Neuropathology practice news 1 – 2014: pyrosequencing meets clinical and
analytical performance criteria for routine testing of MGMT promoter methylation status in glioblastoma.Clin Neuropathol. 2014;33(1):6 –14.
28. Reifenberger G, Hentschel B, Felsberg J, et al. Predictive impact of MGMT promoter methylation in glioblastoma of the elderly.Int J Cancer. 2012;131(6):1342–1350.
29. Baeza N, Weller M, Yonekawa Y, et al. PTEN methylation and expression in glioblastomas. Acta Neuropathol. 2003;106(5): 479– 485.
30. Dahlin AM, Henriksson ML, Van Guelpen B, et al. Colorectal cancer prognosis depends on T-cell infiltration and molecular characteristics of the tumor.Mod Pathol. 2011;24(5):671– 682. 31. Bender R, Lange S. Adjusting for multiple testing--when and how?
J Clin Epidemiol. 2001;54(4):343– 349.
32. Rodriguez FJ, Scheithauer BW, Giannini C, et al. Epithelial and pseudoepithelial differentiation in glioblastoma and gliosarcoma: a comparative morphologic and molecular genetic study.Cancer. 2008;113(10):2779– 2789.
33. Durand-Panteix S, Farhat M, Youlyouz-Marfak I, et al. B7-H1, which represses EBV-immortalized B cell killing by autologous T and NK cells, is oppositely regulated by c-Myc and EBV latency III program at both mRNA and secretory lysosome levels.J Immunol. 2012; 189(1):181 –190.
34. Schachtele SJ, Hu S, Sheng WS, et al. Glial cells suppress postencephalitic CD8T lymphocytes through PD-L1.Glia. 2014; 62(10):1582 –1594.
35. Pittet CL, Newcombe J, Antel JP, et al. The majority of infiltrating CD8T lymphocytes in multiple sclerosis lesions is insensitive to enhanced PD-L1 levels on CNS cells.Glia. 2011;59(5):841– 856. 36. Velcheti V, Schalper KA, Carvajal DE, et al. Programmed death
ligand-1 expression in non-small cell lung cancer.Lab Invest. 2014;94(1):107– 116.
37. Weber JS, Kudchadkar RR, Yu B, et al. Safety, efficacy, and biomarkers of nivolumab with vaccine in ipilimumab-refractory or -naive melanoma.J Clin Oncol. 2013;31(34):4311– 4318. 38. Margolin K, Ernstoff MS, Hamid O, et al. Ipilimumab in patients
with melanoma and brain metastases: an open-label, phase 2 trial.Lancet Oncol. 2012;13(5):459 –465.
39. Queirolo P, Spagnolo F, Ascierto PA, et al. Efficacy and safety of ipilimumab in patients with advanced melanoma and brain metastases.J Neurooncol. 2014;118(1):109– 116.
40. Yang I, Han SJ, Sughrue ME, et al. Immune cell infiltrate differences in pilocytic astrocytoma and glioblastoma: evidence of distinct immunological microenvironments that reflect tumor biology.J Neurosurg. 2011;115(3):505– 511.
41. Rutledge WC, Kong J, Gao J, et al. Tumor-infiltrating lymphocytes in glioblastoma are associated with specific genomic alterations and related to transcriptional class. Clin Cancer Res. 2013; 19(18):4951– 4960.
42. Brahmer JR, Drake CG, Wollner I, et al. Phase I study of single-agent anti-programmed death-1 (MDX-1106) in refractory solid tumors: safety, clinical activity, pharmacodynamics, and immunologic correlates.J Clin Oncol. 2010;28(19):3167–3175.
43. Xu C, Fillmore CM, Koyama S, et al. Loss of Lkb1 and Pten Leads to Lung Squamous Cell Carcinoma with Elevated PD-L1 Expression.
Cancer Cell. 2014;25(5):590 –604.
44. Mittendorf EA, Philips AV, Meric-Bernstam F, et al. PD-L1 expression in triple-negative breast cancer.Cancer Immunol Res. 2014;2(4): 361–370.
45. Zhang Y, Zhang J, Xu K, et al. PTEN/PI3K/mTOR/B7-H1 signaling pathway regulates cell progression and immuno-resistance in pancreatic cancer. Hepatogastroenterology. 2013;60(127): 1766– 1772.
46. Atefi MS, Avramis E, Lassen A, et al. Effects of MAPK and PI3K Pathways on PD-L1 Expression in Melanoma.Clin Cancer Res. 2014;20(13):3446– 3457.
47. Carro MS, Lim WK, Alvarez MJ, et al. The transcriptional network for mesenchymal transformation of brain tumours. Nature. 2010;463(7279):318–325.
48. Doucette TA, Kong LY, Yang Y, et al. Signal transducer and activator of transcription 3 promotes angiogenesis and drives malignant progression in glioma. Neuro Oncol. 2012;14(9): 1136 – 1145.
49. Marzec M, Zhang Q, Goradia A, et al. Oncogenic kinase NPM/ALK induces through STAT3 expression of immunosuppressive protein
CD274 (PD-L1, B7-H1).Proc Natl Acad Sci U S A. 2008;105(52): 20852–7.
50. Wolfle SJ, Strebovsky J, Bartz H, et al. PD-L1 expression on tolerogenic APCs is controlled by STAT-3.Eur J Immunol. 2011; 41(2):413–424.
51. Muenst S, Soysal SD, Gao F, et al. The presence of programmed death 1 (PD-1)-positive tumor-infiltrating lymphocytes is associated with poor prognosis in human breast cancer.Breast Cancer Res Treat. 2013;139(3):667–676.
52. Boland JM, Kwon ED, Harrington SM, et al. Tumor B7-H1 and B7-H3 expression in squamous cell carcinoma of the lung.Clin Lung Cancer. 2013;14(2):157 –163.
53. Mu CY, Huang JA, Chen Y, et al. High expression of PD-L1 in lung cancer may contribute to poor prognosis and tumor cells immune escape through suppressing tumor infiltrating dendritic cells maturation.Med Oncol. 2011;28(3):682– 688.