ScholarWorks
Walden Dissertations and Doctoral Studies Walden Dissertations and Doctoral StudiesCollection
2019
Pull and Push Factors That Influence a Student's
Decision to Drop Out of School
Monica Ruth Rouse
Walden University
Follow this and additional works at:https://scholarworks.waldenu.edu/dissertations Part of theEducational Administration and Supervision Commons
This Dissertation is brought to you for free and open access by the Walden Dissertations and Doctoral Studies Collection at ScholarWorks. It has been accepted for inclusion in Walden Dissertations and Doctoral Studies by an authorized administrator of ScholarWorks. For more information, please [email protected].
Walden University
College of EducationThis is to certify that the doctoral study by Monica Ruth Rouse
has been found to be complete and satisfactory in all respects, and that any and all revisions required by
the review committee have been made. Review Committee
Dr. Kimberley Alkins, Committee Chairperson, Education Faculty Dr. Mary Givens, Committee Member, Education Faculty Dr. Charlotte Redden, University Reviewer, Education Faculty
Chief Academic Officer Eric Riedel, Ph.D.
Walden University 2019
Pull and Push Factors That Influence a Student’s Decision to Drop Out of School by
Monica Ruth Rouse
EdS, Western Illinois University, 2006 MS, Western Illinois University, 1996 BA, Northern Illinois University, 1987
Dissertation Submitted in Partial Fulfillment of the Requirements for the Degree of
Doctor of Education
Walden University June 2019
The high school dropout rate in the United States has historically been and continues to remain a persistent concern. The dropout epidemic has primarily been studied through a quantitative lens focused on the final decision to dropout rather than the complex
sequence of events that factor into the dropout decision. The purpose of this study was to explore the pull/push factors that influenced a student’s decision to drop out of high school. In this qualitative study, attention was given to both understanding how students described their reasons for dropping out of school and identification of any factors that could have led them to remain in school and earn a diploma. The conceptual framework was based on pull/push factors related to students dropping out. Through a case study design, 10 participants, classified as dropouts by the selected research site, were interviewed about the influence of the push/pull factors of poverty, absence, and engagement in their decision to drop out of school. Data were analyzed through an iterative process wherein patterns were discerned appropriately. The findings support 4 central influences that serve as both pull and push factors in the decision to drop out: disinterest/disengagement, teacher connection, a sense of hopelessness, and an end to any desire to succeed in school. Furthermore, the findings support the development of school and district-wide identification and intervention programs that make relationships with students the foundation and guide educators and local policy makers in making decisions that support student success and increase the likelihood a student at risk for dropping out would remain in school and earn a high school diploma.
by
Monica Ruth Rouse
EdS, Western Illinois University, 2006 MS, Western Illinois University, 1996 BA, Northern Illinois University, 1987
Dissertation Submitted in Partial Fulfillment of the Requirements for the Degree of
Doctor of Education
Walden University June 2019
I dedicate this project to many of my teachers who helped nurture the love of learning that led me to this culminating point in my formal academic pursuits: Mrs. Hardy (Kindergarten), Mrs. Brown (first grade), Mrs. Haberle (second grade), Mrs. Selmi (third grade), Mrs. Downey (fourth grade), Mrs. Hinuebar (fifth grade), Mrs. Dillon (sixth grade), Mr. Chapman (seventh/eighth grade), Mrs. J. Thome and Mr. J. Newton (high school English), Mr. R. Deibert (high school social studies), and Mr. M. Baker and Mr. C. Lee (high school science).
I further dedicate this study to my husband and two adult children for their continued encouragement and support and reminders about the importance of this focus to the students who have dropped out.
It seems to go without saying that without the support of my family and friends, remaining committed to the journey of earning this degree would not, in all likelihood, have happened. There are so many life events that have attempted to thwart my efforts to finish my program of study. Each time a major event happened I stopped to reassess my decision to take this journey in the first place. A revelation I experienced on this journey is that I had nothing to prove to anyone, except myself. It was at this juncture that I realized a release of pressure and a different motivation to finish this journey. It is my fervent hope that the voices of the students contained in this research will be the impetus for further research that will continue to bridge the gap between theory and practice and continue to lower the dropout rate in this country. Every student has a story about what happened that caused him/her to leave school without a certification. Within each story are insights for bridging the gap. We must listen for the sake of our country’s economic future.
i
Table of Contents
List of Tables ...v
List of Figures ... vi
Chapter 1: Introduction to the Study ...1
Introduction ...1
Background ...3
Problem Statement ...8
Purpose of the Study ...12
Research Question ...13
Conceptual Framework ...13
Nature of the Study ...14
Definitions ...15
Assumptions ...16
Scope and Delimitations ...17
Limitations ...18
Significance ...18
Summary ...19
Chapter 2: Literature Review ...21
Introduction ...21
Literature Search Strategy ...21
ii
Literature Review Related to Key Concepts ...26
Pull/Push Factors ... 26
Access to Resources as a Pull Factor of SES ... 27
Cognitive Ability as a Pull Factor of SES ... 28
Health as a Pull Factor of SES ... 28
Poverty as a Push Factor ... 29
Teacher Attitudes About Poverty ... 29
Institutional Discrimination and Poverty ... 30
Chronic Absenteeism ... 31
Mobility as a Pull Factor ... 31
Homelessness as a Pull Factor ... 32
Prevalent Chronic Illnesses as Pull Factors ... 33
Chronic Absenteeism as a Push Factor ... 34
School Punishment as a Push Factor in Chronic Absenteeism ... 34
Zero-Tolerance in Philosophy and Practice ... 35
Zero-Tolerance Effect ... 35
School-to-Prison Pipeline ... 36
Motivation ... 37
Motivation as a Pull Factor ... 37
Motivation as a Push Factor ... 38
iii
Summary and Conclusions ...40
Chapter 3: Research Method ...42
Introduction ...42
Research Design and Rationale ...42
Other Approaches Considered ... 44
Role of the Researcher ...45
Methodology ...48
Participant Selection ... 48
Instrumentation ... 50
Procedures for Recruitment, Participation, and Data Collection ... 51
Data Analysis Plan ... 54
Trustworthiness ...55 Ethical Procedures ...56 Summary ...58 Chapter 4: Results ...59 Introduction ...59 Setting ...59 Data Collection ...62 Data Analysis ...65 Results ...75
iv
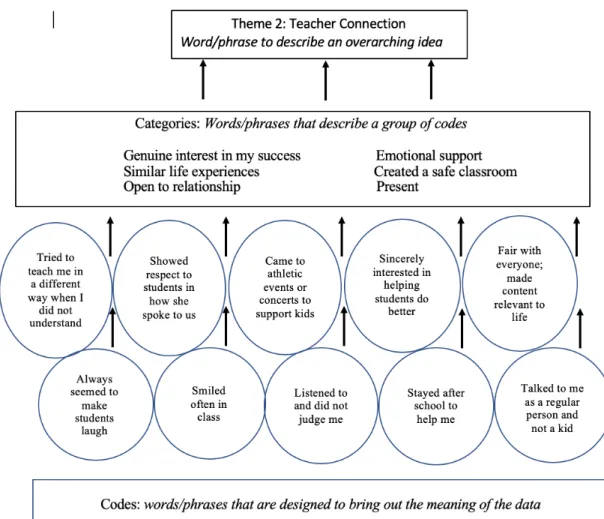
Theme 2: Teacher Connection ... 79
Theme 3: Sense of Hopelessness ... 83
Relationship of Theme 3 to RQ1 and RQ2 ... 85
Theme 4: Desire to Succeed ... 86
Relationship of Theme 4 to RQ1 and RQ2 ... 87
Evidence of Trustworthiness ...87
Summary ...91
Chapter 5: Discussion, Conclusions, and Recommendations ...94
Interpretation of the Findings ...94
Interpretation of the Findings in the Context of the Conceptual Framework ... 95
Interpretation of the Findings in the Context of the Prior Research ... 96
Limitations of the Study ...100
Recommendations for Further Research ...102
Recommendations for Practice ...103
Early-Warning Systems ... 104
Focus on the Student-Teacher Relationships Through Advisory Programs ... 107
Implications ...110
Conclusion ...113
References ...114
v List of Tables
vi List of Figures
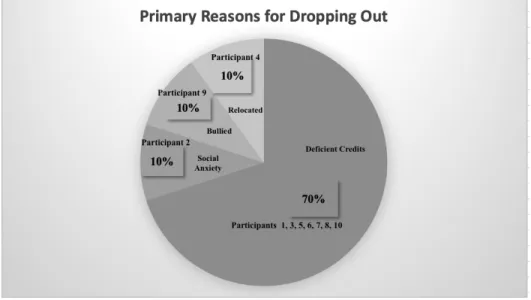
Figure 1. Graphical representation of the number and percentage of participants for the grade level at which they dropped out of school ...61 Figure 2. Identify primary reason each participant dropped out ...61 Figure 3. Participant 1’s condensed computer-created concept map ...68 Figure 4. Comprehensive concept map created for interview questions directly related to
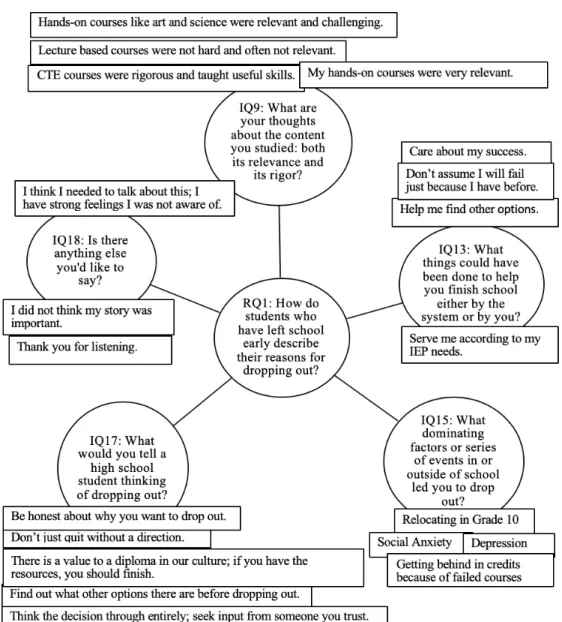
RQ1. ...70 Figure 5. Comprehensive concept map created for interview questions directly related to
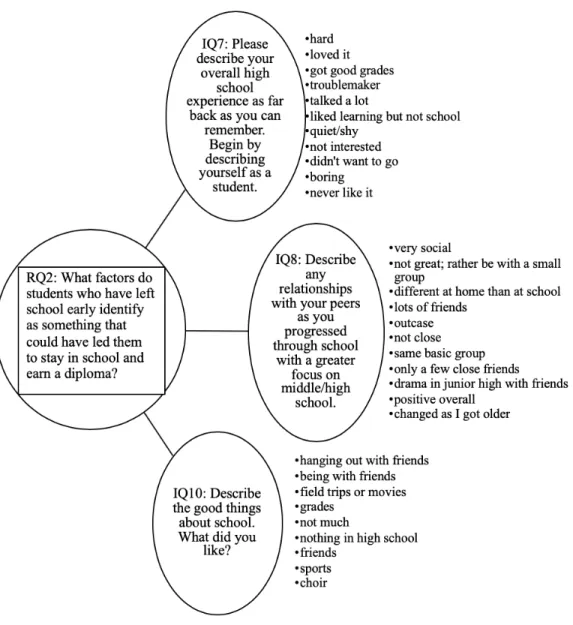
RQ2, specifically interview questions 7, 8, & 10 ...71 Figure 6. Comprehensive concept map created for interview questions directly related to
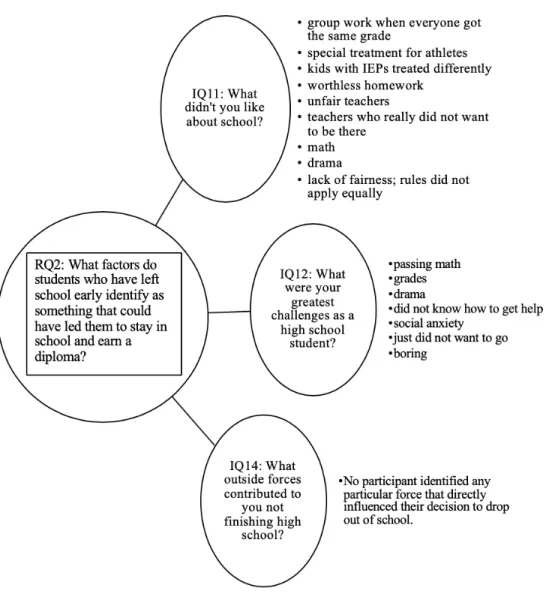
RQ2, specifically interview questions 11, 12, & 14 ...72 Figure 7. Progression from general data codes to more specific categorical labels to a
single overarching theme ...73 Figure 8. Word cloud generated from all participants’ descriptions of a teacher they made
Chapter 1: Introduction to the Study Introduction
Graduation and dropout rates in the United States have been a concern for decades (DePaoli, Balfanz, Bridgeland, Atwell, & Ingram, 2017). Between 1970 and 2002, graduation rates remained stagnant while the dropout statistics revealed that more than 1 million students dropped out of school each year during that same 30-year period (DePaoli et al., 2017). As recently as 2015, the status dropout rate hovered at 5.9%. This statistic represented the percentage of all people, ages 16 to 24 years, who were neither enrolled in school nor had they earned a high school diploma or equivalency credential, such as the general equivalency diploma (GED; Stark & Noel, 2015). In the fall of 2017, it was estimated that 4 million public school students would enroll in ninth grade, which means that approximately 236,000 of those same ninth graders would drop out of school before the end of that academic year (McFarland et al., 2017).
My purpose in this study was to gain an increased understanding about the factors that prompted students to drop out of high school and those factors that could have led to them remaining in school and earning their diploma. Although no one definitive reason exists for students dropping out of school, patterns for such a decision have emerged and point to a process of disengagement from school that occurs over many years and leads to early leaving. Engagement is thought to be a key variable in both the prediction and prevention of perpetuating the dropout epidemic (Landis & Reschly, 2013). Additional
critical factors that emerged as indicators of dropout include poverty and chronic
absences (McConnell & Kubina, 2014; Schoenberger, 2012; Wexler, Pyle, & Fall, 2015). For a shift to occur in these key variables, thereby discouraging further dropouts, there must be a clear understanding of how societal views about education and education policies converge (Al-Hattami & Al-Ahdal, 2014; Patil, 2012; Turkkahraman, 2012). This understanding can best be reached by hearing the views of those who made the decision to drop out and have experienced the consequences of such a decision. Because education has always been a means for preparing for the future, practitioners can benefit from the lessons learned from past practices and implement changes in practice that will positively affect the dropout rate. To the extent that education advances and strengthens the developmental abilities of individuals, groups, institutions, communities, and
countries, it is important for practitioners to listen to the views of dropouts to continue to be a tool of individual and social transformation (Patil, 2012; Turkkahraman, 2012).
In this chapter, I focus on U.S. history of education concerning the purpose of tracking the nation’s graduation rate. In addition, I highlight the distinction between graduation rate and dropout rate. I make this distinction in tandem with the emphasis on a consistent graduation tracking method to increase the accuracy of the dropout trajectory. I feature statistics regarding the disaggregation of data related to race and students with special needs. In this chapter, I also include a review of the problem statement, the research questions, and an in-depth examination of the conceptual framework supporting
this study. Information on the nature of the study, definitions, assumptions, scope and delimitations, limitations, and the significance of the study complete this chapter.
Background
Although the history of education in the United States can be traced back prior to 1867, the history of education addressed in this chapter begins in 1867, when U.S.
Congress established the national department of education charged with keeping statistics and facts that reflected the condition and progress of education in the states and
surrounding territories (Snyder, 1993). It was in 1870 that the first condition and progress of education report reflected only 2% of all 17-year-olds had a secondary education (Snyder, 1993). Further, this same report indicated that 20% of the adult population was illiterate as well as 80% of the Black population (Snyder, 1993). The turn of the 21st century brought much change economically and socially in education and, in 1947, slightly more than half of all students completed high school (Ryan & Siebens, 2012). Formally, high school graduation became the norm in the 1950s, and the U.S. graduation rate peaked at 77% in 1969, shortly after the passage of the Elementary and Secondary Education Act (ESEA) in 1965 (Ryan & Siebens, 2012). The graduation rate remained consistent until the 1980s when contemporary data became available on the nation’s public schools.
The historical Nation at Risk report brought needed attention to educational reform at all levels, but an intense focus on high school students stemmed from data that reflected 13% of all 17-year-olds were functionally illiterate, with the figure as high as
40% for minority youth (Gardner, 1983). High school students were leaving school underprepared for postsecondary education or the work force. Graduation rates continued to decline throughout the 1980s and early 1990s until they stabilized at 66% in the latter part of that decade (Snyder, 1993). Gradual but steady improvements were reflected in the early decade of 2000, and the reauthorized ESEA transitioned into No Child Left Behind (NCLB; 2002). Graduation rates reached 69% in 2005, and by 2012, using a universal federal reporting formula, graduation rates were at 80%. Finally, in 2014, the United States reached a historical graduation rate of 82.3% (DePaoli, Balfanz, & Bridgeland, 2016). In 2015, NCLB was, again, reauthorized under the Every Student Succeeds Act (ESSA; 2015).
Rising graduation rates represent progress among U.S. high school students. However, climbing graduation rates of this magnitude have come under scrutiny, and the possibility that schools have gotten creative about reporting their graduation rates has been suspect (Snyder, de Brey, & Dillow, 2016). Also expressed were concerns about students being pushed out of school and encouraged to seek alternative methods, such as credit recovery programs that subscribe to a lower level of rigor, to earn a high school diploma (DePaoli et al., 2016). Data continue to reflect that a disproportionate number of students of color leave school early. In the United States, 22% of White students and 17% of Asian students dropped out of school in 2011, in stark contrast to 42% of Hispanic students, 43% of African American students, and 46% of Native American Indian students (American Psychological Association, 2012; Kena et al., 2016). An additional
subgroup that reflects lower graduation rates is low-income families in which a reported third of the nation’s states graduated less than 70% of students from such families. Considering that 47% of the nation’s 2014 graduating cohort came from low-income families this clearly highlights a problem that warrants further study (DePaoliet al., 2016). Furthermore, 33 states graduated less than 70% of students with disabilities (SWD), and less than 50% of these students graduated in six of those states. In 35 states, English language learners (ELLs) graduated at rates less than 70%, and seven of those states had ELL graduation rates less than 50%. Finally, a new subgroup to be measured under the new ESSA was the nation’s homeless population, and historical evidence reflects this subgroup may have graduated the lowest percentage of students of any subgroup (DePaoli et al., 2016).
As the need to address the dropout crisis has evolved, graduation rates have become an element of study. Historically, inconsistent reporting of graduation rates led to unreliable data, and the introduction of the Adjusted Cohort Graduation Rate (ACGR) in 2010 was purposed to add consistency, accuracy, and integrity to the data (DePaoli et al., 2016). The ACGR for a district is established by identifying incoming ninth graders and then tracking them as a cohort as they progress, annually, through high school from grade level to grade level. This number is adjusted according to the addition or subtraction of students who transfer in or out of the cohort. The ACGR is the percentage of the students in the cohort who graduate within 4 years (McFarland et al., 2017). As of 2014, all states began using this formula to report data (DePaoli et al., 2016; Kena et al., 2016). This
formula supports the nation’s commitment to raising the graduation rate by promoting accuracy and serving as the lens through which efforts are made to reduce the dropout rate. Furthermore, as the nation has committed to look closely at the graduation rate, a more thorough analysis has been made to identify and understand the gaps that have existed among students who identify with a racial minority, have a disability, are from a low socioeconomic status (SES), or are ELLs (Balfanz et al., 2014; DePaoli et al., 2016; McMurray, 2014; Rumberger, 2015).
Racially, although the dropout rates of Latino and African American students have declined since 2002, there has continued to be a differential of 11.4 and 18.0 percentage points between Latino and African American students and White and Asian students (Balfanz et al., 2014; Kena et al., 2016). This differential has been an important factor in light of the fact that, since 2001, Hispanic enrollments in public schools have been rising, African American enrollments have been steady, and White enrollments have been declining (Balfanz et al., 2014). One explanation for these data may rest with
districts who have engaged zero tolerance policies to combat discipline challenges. Such policies have been suspected as having a disproportionate effect on minority students (Balfanz et al., 2014). The premise behind a zero-tolerance policy is to remove a student for disruptive behavior to deter others from like behavior and not only reduce disruptions but also improve the climate for other students (Balfanz et al., 2014). Historically, zero tolerance policy addressed the most disruptive student behavior, such as drug-related or violent behaviors. However, in more recent years, districts have exercised a more liberal
application of the zero-tolerance practice (Balfanz et al., 2014). With the explosion of suspensions as a primary disciplinary tool, roughly a 40% increase in as many years, disaggregating the data to study any link of suspensions to the dropout crisis may be a tool in reducing the dropout rate for minority students (Balfanz et al., 2014).
In addition, nearly two-thirds of U.S. states have shown student populations that are at least 40% low income (DePaoli et al., 2016; Kena et al., 2016). In 2012-2013, the ACGR for low-income students reached 73.3% (DePaoli et al., 2016). This is a
significant statistic considering U.S. public schools became majority low income in 2013 at 51% (Balfanz et al., 2014).
Furthermore, as the population of ELLs in the United States has continued to rise providing help for these students has reflected a need for strong instructional supports (Balfanz et al., 2014). As with the ELL population, SWDs, who make up approximately 13% of all public education students, have experienced a low graduation rate at 61.9% (Balfanz et al., 2014). With the right supports, it has been estimated that approximately 85% to 90% of SWDs could meet regular diploma requirements (Balfanz et al., 2014). Research in the last several decades has reflected studies identifying the factors that push students out of school as a result of adverse situations within the school environment that lead to consequences and, ultimately, student dropout. In addition, researchers have cited factors that pull students out of school system. Such factors are those that lie within the student and divert him or her from finishing school (Doll, Eslami, & Walters, 2013; Rumberger, 2015). Also confirmed through research is that the decision
to drop out of school is a gradual process that, despite the common indicators of poverty, chronic absence, and a lack of engagement, cannot be presented as a causal relationship (De Witte, Cabus, Thyssen, Groot, & Massen van den Brink, 2013). Further, these three observable indicators are interconnected to the point that studying them in isolation is sure to be met with challenges of a significant nature (De Witte et al., 2013). What has been documented has supported educational efforts to put into place practices that help reduce the dropout rate. What has not been thoroughly documented in research, however, is the insight from the students who, themselves, have dropped out of school. I found one study in which the researchers cited personal insights from students in regard to the pull/push factors that influenced their decision to drop out of school. Without such information to guide the practices of educators within the classroom, it seems inevitable that the dropout epidemic will persist. Students will continue to drop out, and educators will continue to miss opportunities to put targeted interventions in place that may reverse the direction toward dropout in which a student is headed.
Problem Statement
The district I selected for this study is one that has devoted much effort to address the dropout crisis. During the last 8 years, state education data reflected the research site’s dropout data for Grades 7 to 12 to range from its lowest in 2014 to 2015 at 2.61% to its highest in 2011 to 2012 at 6.04%. The most recent data in 2017 to 2018 showed the district’s dropout rate for all students to be 3.88% for Grades 7 to 12. In addition,
attention included dropout rates for students with individual education plans (IEPs) at 17.4%, students on free/reduced lunch at 60.5%, English language learners at 5.56%, students identified as African American at 19%, and those students identified as Latino at 13.9% (Iowa Department of Education, 2018). This district’s certified enrollment, Grades PK-12, was slightly more than 15,500 for the 2017-2018 school year. This district has, historically, served four individual communities: one large/main community and three outlying and significantly smaller communities. The district covers approximately 110 square miles. In addition, the district’s financial experts maintain a budget of more than $200 million. This district employs more than 1,400 teachers. The diversity of the district includes 55.3% White, 19.1% Black/African American, 13.9% Hispanic, and 12.6% multiracial/other students (Iowa Department of Education, 2018).
In 2016, the research district put into place a teaching and learning plan that promoted high expectations for instructional practices that could translate into
improvement in the graduation rate over the next 5 years. According to the 2017 teaching and learning plan for the research school district, the goals of the plan included teaching and learning supports for advancement in four major areas:
● Multitiered system of support for students (MTSS), which was intended to
provide additional time and support to each child as needed to learn at high levels. This system addressed both the academic and behavioral needs of students.
● Standards-based assessment and reporting (SBAR), which is a system that depends on standards-based assessment and reporting in a clearly defined K-12
curriculum. This focused instructional efforts in the district on a demonstration of skills by students as opposed to the typical Carnegie unit of time still used by many districts.
● A unique plan that was relevant to district demographics and purposed providing instruction, resources, and support to aid students with social, emotional, and behavioral needs. This element of the plan focused on a schoolwide system of positive behavior supports, intended to increase student engagement, and the awareness of mental health issues in the district’s respective schools.
● Instructional practices that focused on the growth and development of the teachers who served the district. The focus of this element was research-based best
practices in instruction.
This same teaching and learning plan also set goals regarding the graduation dropout rate; the more specific goals included increasing the graduation rate in Years 4 and 5 by 1% each year as well as realizing a decrease in the dropout rate by 0.25% each year.
Achieving both of these goals would ensure this district was in line with the state dropout rate of 2.5%. Further, this district set a goal to boast that 95% of all high school students would be on target for graduation by 2021.
Although my focus in this study was a single district, the dropout epidemic has been a national concern for decades in districts of all sizes across the United States (DePaoli et al., 2017). Because of the broad scope of the dropout problem, research abounds and can be used to guide efforts to further reduce the effects of this epidemic.
The plethora of research during the past several decades has enlightened educators and policymakers alike about the reason(s) students leave school early and fail to earn a diploma. As a result of research, policies that have pushed students out of school, such as zero-tolerance for specific disciplinary violations or requiring high-stakes testing to graduate, have been under a high level of scrutiny (Simson, 2014). A focus has been on supports that have been put in place to help struggling students succeed and stay in school. One such support strategy is response to intervention (RTI). RTI is a system constructed of three distinct levels or tiers designed to offer individualized support for students who have been identified as struggling either with learning or behavior
challenges through a respective school process (Howell & Patton, 2013). Each stage of the RTI process, and there are three in total, offers more intensive supports (Howell & Patton, 2013). Another such strategy that has been implemented is check and connect. Check and connect is based on monitoring school performance, mentoring students, and advocating through personalized and individualized support services (U.S. Department of Education, 2014). Research revealed that these strategies provide prime opportunities for interventions that can be implemented right in the classroom (Lamote, Speybroeck, Van Den Noortgate, & Van Damme, 2013).
Yet, the dropout crisis has continued, and the effects of school dropout have not been confined to educational institutions. These effects have extended beyond these institutions. Dropouts cost society billions of dollars in lost economic productivity, increased risk of health problems, a more apathetic civic attitude, a higher incarceration
rate, and immeasurable costs to future children (Fan & Wolters, 2014; Ricard & Pelletier, 2016; Schoenberger, 2012; Wilkins & Bost, 2016). Reducing the dropout rate through research continues to remain critical. The history of the United States reflects an educational crisis that has been studied in depth. However, what is missing from the research, specifically within the last 5 years, is any dialogue with the students who made the decision to drop out of school. The insights of these students, from their personal experiences, would allow for a deeper understanding of the reasons they chose to leave school early. This understanding would, in turn, aid schools in their efforts to support students in overcoming challenges and graduating.
Purpose of the Study
My purpose in this study was to gain an increased understanding about the factors that prompted students to drop out of school and factors that could have led to them remaining in school. This research is important to school leaders and policymakers because of the high accountability measures that rest on those entities through the
recently reauthorized NCLB in 2002 to the ESSA Act in 2015. Educators in priority areas such as college and career readiness, interventions and student support for those who struggle, and performance on annual statewide assessments must give attention to the experiences of those students who dropped out of school. Identifying and understanding the antecedents to dropout may provide invaluable information in reducing the dropout rate (Burris & Roberts, 2012; Ekstrand, 2015).
Research Question
In alignment with the research problem and purpose, I posed the following research questions:
RQ1: How do students who have left school early describe their reasons for dropping out?
RQ2: What factors do students who have left school early identify that could have led to them staying in school and earning their high school diploma?
I used a qualitative research approach to address and explore the research
questions. I implemented a basic case study, using personal interviews and inductive data analysis, to provide critical insights into the dropout problem. The research site was a large, urban school district in Iowa with a diverse population and an overall school enrollment of 17,500 in 2016-2017 (Iowa Department of Education, 2018). This number included a student population of 40.86% African American, Hispanic, Asian, and
Multiracial students. The district’s free and reduced population was 58.24%, and 14.54% of students received services for IEPs (Iowa Department of Education, 2018)
Conceptual Framework
According to Merriam (2009), a framework for a study draws upon the
definitions, models, and themes of a particular literature base. Historically, the pioneering framework that has influenced continued studies on the dropout epidemic is classified as push/pull (Jordan, Lara, & McPartland, 1994). Push factors are those situations within the school environment that lead to consequences and, ultimately, to students dropping out.
Such factors might include zero tolerance policies, high stakes tests, overcrowded facilities, discipline policies, and lack of extracurricular activities (Carl, Richardson, Cheng, Kim, & Meyer, 2013; Doll et al., 2013; Rumberger, 2015). Pull factors are those that lie within the student and divert him or her from finishing school. Examples of pull factors may include teenage pregnancy, family finances, illness, and student mobility (Doll et al., 2013; Ohrtman & Preston, 2014; Rumberger, 2015).
This framework encourages the exploration of the dropout epidemic and invites the perspective of the dropouts, themselves, to be a central aspect of continued research while acting as an impetus for deeper exploration of the pull/push factors as antecedents to making the decision to drop out. In addition, through the integration of the established research and the insights of those who have dropped out, a new vision can be constructed that is focused on dropout prevention that is a direct result of a thorough understanding of the push/pull factors that influence a student’s decision to drop out of school.
Nature of the Study
I selected a case study design for this research study. I chose this design, in large part, because of its tendency to focus on meaning and understanding of a process
(Bogdan & Biklen, 2007; Patton, 2015). In addition, what made the case study an appropriate method of design for this study was its allowance of a focus on a particular research site and the study of a problem in real-life context. The practical historical challenges the research site has experienced with dropouts found this district searching for answers. Another element of the case study design that was instrumental in the
selection of this design was its ability to bring about new meaning. Merriam (2009) identified that an ability to seek new meaning as “heuristic” reflecting an approach to problem solving and discovery. The phenomenon of dropout and what the factors are in the decision to drop out warranted such an approach. My focus in this study was on the real-life experiences of students who dropped out of school before earning a high school diploma or equivalency credential. Individual interviews with former students, who dropped out of school from the designated research site were conducted. I used
purposeful sampling as the primary method to select the participants. I interviewed each participant, and I transcribed and member-checked each interview. From that point, I coded the data.
Definitions I defined the following terms for this study:
Adjusted cohort graduation rate (ACGR): A formula whereby each freshman class or cohort is tracked in the course of four years, from the start of the freshman year until the end of the fourth year, and graduates with a regular diploma. (Stark & Noel, 2015).
Dropout: A person, ages 16 to 24 years, who is neither enrolled in school nor has earned a high school diploma or equivalency credential (Kena et al., 2016; Stark & Noel, 2015).
Homelessness: Children for whom a fixed or regular residence is absent due to any number of reasons, including but not limited to economic hardship, loss of housing, or other emergency situation (U.S. Department of Education, 2016).
Poverty: A delineation by the U.S. Census Bureau whereby the total gross income of a family is less that the family’s threshold (Kena et al., 2016).
Pull factors: Factors that lie within the student and divert him or her from finishing school (i.e., family needs, employment; Doll et al., 2013).
Push factors: Harmful practices that occur within the school environment and lead to consequences, ultimately resulting in dropout (i.e., attendance policies, zero-tolerance discipline policies; Doll et al., 2013).
Socioeconomic status (SES): An index composition of often equally weighted, standardized components, such as parents’ education, father’s occupation, family income, and household items. The ranges within this index include high, middle, and low and are based on weighted index distribution (Kena et al., 2016).
Assumptions
My first assumption in this study was that all participants would reveal the exact nature of their reasons for dropping out of school according to their recollection. In contrast, I also assumed that some of the participants may have been reticent to describe their reasons for dropping out of school because they did not wish to recall specifics that may have bordered on painful or traumatic. However, an extended assumption was that participants would be honest in their recollections to the extent possible. I assumed that
because the study was anchored in the real-life experiences of the participants, the outcome of the study would provide valuable information for the research site in framing future decisions regarding educational practices.
Scope and Delimitations
The scope of this study included individual, in-person, interviews with ten participants between the ages of 18 and 21 years who dropped out of school. The
qualitative nature of this study, as well as the small sampling, was prohibitive to making any generalizations outside of the research site. The interview process included a
conversation component with each participant and focused on questions related to the research study, whereby a discovery of the factors that influenced the interviewee’s decision to drop out of school was made. The interview was a semistructured series of questions, and each interview was recorded to preserve everything that was said during the interview for transcript verification (Patton, 2015). Also, as suggested by Merriam (2009), any observation notes taken during the interview were immediately transcribed to insure the most accurate reflection possible.
Delimitations of this study included choices made by me, including the focus of the research itself. The research problem was selected because I placed a value on it above other problems that could also have had a high value. Additional delimitations included the choice of research location, participants, and the methodology that I used in the study.
Limitations
My purpose in this qualitative research was to focus on a smaller population to allow in-depth focus on the details shared by the participants. Because of this desire to study a small number of subjects of particular interest, a limitation was with sample size and the inability of such results to be generalized to a broader audience (Merriam, 2009; Patton, 2015). Time was an additional limitation of this research. Conducting individual interviews, coding, transcription, and analyzing data required an extensive amount of time (Merriam, 2009; Patton, 2015). Another limitation with the selected method of data collection involved the participant’s reliance on memory about events that occurred in the past. Numerous life events may have altered an individual’s recollection of the actual factors or depth of influence of factors in a decision to drop out of school, which posed a possible problem with reliability. Finally, because this study stemmed from a personal passion, researcher bias was considered as a possible limitation. Analysis and
interpretation of data allowed for more latitude for subjectivity and personal bias to influence findings (Patton, 2015). These limitations could have influenced reporting objectivity in ways that could have influenced the study.
Significance
This study was significant on numerous levels. Practically, not only was the individual student negatively influenced by the decision to dropout, but also society as a whole was negatively affected. The economic and social losses that results from a single dropout has been undisputed and affects annual and lifetime earnings of the dropout as
well as lost revenue for society (Burris & Roberts, 2012; De Witte et al., 2013; Stark & Noel, 2015). In addition, dropouts are more likely to live less healthy lives (De Witte et al., 2013; Wilkins & Bost, 2016). Intellectually, the decision to dropout is made in the course of time (Messacar & Oreopoulos, 2013; Wexler et al., 2015). Finding possible causal factors may encourage the implementation of possible preventative measures, thereby shifting the likelihood that a student may be left to struggle for long periods. Such interventions and supports could encourage a different outcome (Wexler et al., 2015).
Summary
In this chapter, the background and history laid a strong foundation to introduce the need for this research study. Also targeted was the gap in practice delineated by information regarding the discrepancy in the graduation rates of students of color, students from poverty, and students with disabilities. This information reinforced the need for this study as the research focus was on how these factors influenced the research participants in their respective decision to drop out of school. The problem statement, the purpose statement, and the research questions provided the direction for this study. These sections were followed with the conceptual framework as well as the justification for the chosen selected case study methodology which supported the development of the study. The chapter also included definitions, assumptions, scope and delimitations, and the limitations of the study. Finally, the chapter concluded with a brief synopsis of the significance of the study which is an important aspect in consideration of the level of
social change that could be linked to this study. In the literature review in Chapter 2, I will provide extensive insight into the research regarding the dropout epidemic, including consistent pull/push factors that might serve as antecedents in a student’s decision to drop out of school.
Chapter 2: Literature Review Introduction
To gain an understanding about the factors that influence a student’s decision to drop out of school and those factors that may encourage dropouts to remain in school and earn a regular high school credential, I will provide a review of the literature. In this literature review, I will focus on the pull/push factors and the complexity and
interconnectedness of these factors that may lead to a student making the decision to drop out of school. I cover the role of the following pull/push factors: poverty, chronic
absenteeism, and motivation. This research is important to policymakers and school leaders because of the high accountability measures schools are subjected to as well as the negative consequences that befall both the student who drops out and society. These negative consequences include increased unemployment, increased crime rates, increased mental and physical health challenges, and the result of lower lifetime financial earnings of a student who drops out of school. In this chapter, I will encapsulate the process that I used to accomplish a thorough review of the literature, introduce the conceptual
framework that provides the foundation for this study, review the literature as related to key concepts and variables, and suggest a gap between the literature and practice that I addressed in this study through the intended methodology in Chapter 3.
Literature Search Strategy
I began my exploration for research with a general Google Scholar search. I also explored individual databases with the education research comprehensive database on the
Walden University website. I searched Education Source and ERIC in addition to the multidisciplinary database of Sage Premier. I began the search process with the terms high school dropout and indicators of dropping out and further refined my search to seek peer-reviewed journal articles published between 2012 and 2017 in all searches. After a period of several weeks, I refined my timeline to resources between 2015 and 2017. Under doctoral resources, I explored a number of dissertations to help guide my process. In total, I was exposed to 186 articles that I previewed by either reading the abstract or skimming the entire article. In addition, various resources cited in these initial articles led me to explore 48 more articles. As I began to focus in on the primary indicators of
dropout, I used leads from the research to support the target indicators in my project: SES, attendance, school climate, and motivation. After an extensive review of the research I winnowed my sources to the much smaller number peer-reviewed articles I believe to be the most reflective of a pattern of interdependence with the indicators of dropout amongst the nation’s adolescents: poverty, chronic absences, and student motivation.
Conceptual Framework
The current research on dropout promotes a framework wherein a plethora of factors act as antecedents to pull or push students out of school (Carl et al., 2013; Doll et al., 2013; Lamote et al., 2013; Rumberger, 2015; Simson, 2014). These researchers promote that the decision of a student to drop out of school is based on factors called pull or push. This pull/push framework was introduced in 1994 by Jordan et al. Succinctly,
pushout describes factors wherein the agent is the school and elements regarding how the institution functions actually discourages students from staying in school (Bradley & Renzulli, 2011). Contrarily, pull factors are those for which the individual considers leaving school after assessing the gains and losses associated with his or her individual circumstances (Bradley & Renzulli, 2011). Ultimately, the decision to dropout is a complex one based on factors that are unique for each individual (Doll et al., 2013; Rumberger, 2015). The complexity of the dropout epidemic, itself, has been noted in seven separate longitudinal studies that reinforce the research on the pull/push framework. Between 1955 and 2002, these national studies were conducted by
organizations such as Educational Testing Services, Bureau of Labor and Statistics, and the United States Department of Education. What was consistently shown in each of these longitudinal studies was that the dominant justification for the decision to drop out of school lay in the pull factors. As each of the last five studies was implemented, the complexity of the dropout decision was reinforced through the integration of questions that had not been previously considered, such as early versus late dropouts, school safety perceptions, and administrative and teacher perceptions (Doll et al., 2013).
These and other studies promoted the pull/push framework were rooted in two factors that were predictive in nature: individual and institutional (Rumberger, 2015). The individual framework promoted that the ownership of the decision to drop out was
embedded in student attributes. The basic premise was that a student’s values and attitudes affected behavior, and this interaction contributed to the decision, in time, to
leave school early (Rumberger, 2015). As an example, consider a student who withdrew from school based on experiences related to challenging academics which, in turn, led to a discouraged attitude which, in turn, led to skipping class which, in turn, led to the decision to drop out completely. This scenario was noted as a decision rooted in academic engagement (Doll et al., 2013; Lamote et al., 2013; Rumberger, 2015). In contrast, consider a student who did well in school but struggled with peers. Engagement with peers is a social aspect of the learning process and is frequently cited in the literature as an element in the decision to drop out (Doll et al., 2013; Lamote et al., 2013). An example of this situation might be a student who did well academically but, due to struggles fitting in or feeling accepted by peers, assessed the losses associated with dropping out to be less of a risk than remaining in school and, subsequently, dropped out. In essence, this student exercised school refusal behaviors that were a result of a change in attitude and, ultimately, a shift in a value (school was important but becomes
unimportant).
Schools wield a great deal of influence over student achievement, and their influence has been connected to the dropout epidemic as an element that compromise a student’s quest for academic and social achievement (Lamote et al., 2013; Rumberger, 2015; Simson, 2014; Van Eck, Johnson, Bettencourt, & Johnson, 2017). Although the institution, itself, cannot control any family dynamics or student background influences that may affect a student’s changes for success in school, evidence supports that school factors that were within the scope of the institution’s control were influential toward a
student’s achievement. Consider school policies and practices. Although institutional policies are implemented to encourage effective school practices, such policies can act as an impetus for a student to make the decision to leave school early (Lamote et al., 2013; Rumberger, 2015; Simson, 2014). An example of an institutional policy or practice that leads to a voluntary departure of a student might be a student who found motivation to come to school through athletic programs, and as a result of budgetary concerns, the school cut such programs, thereby taking away that student’s motivation for attending school. In contrast, a student may have been involuntarily pushed out of school and made the decision to drop out due to the implementation of repeated suspensions from school for minor disciplinary infractions.
Historically, the motivation that results in the decision to leave school early has been a complex combination of interwoven pull/push factors that influenced a student’s decision to drop out of school over time. An examination of the existing research regarding dominant pull/push factors over several years reflected the increase in the complexity of the pull/push factors and documented the changing needs of students with time. It is the progression of the research that both solidifies the support for the pull/push framework and challenges future research specific to the experiences to the individual students to continue to explore the complexity of this educational challenge.
Because the nature of this research study focused on the individual experiences of each dropout, a case study approach seemed most logical. The case study provided an opportunity to study the participant as well as gain insights into the research site, as an
institution. Insights gained from each participant included information regarding the structure of the social institution, such as policies and practices that may have proven influential in the participant’s decision-making process (i.e., attendance and discipline).
Literature Review Related to Key Concepts
Although in the last decade the United States has seen a decline in the dropout rate across all races, for students with disabilities (SWDs), and for youth in low-income families, the loss of those who drop out continues to have implications that reach beyond the dropouts themselves. Identifying and studying the push and pull factors that become an impetus for dropout is imperative. Gaining an understanding of these factors would promote the creation of a purposeful set of actions that could be put in place that would continue to reduce the dropout rate in the United States. Such actions would not be limited to what the schools could do but what any society could and should do to support the education of all youth.
Pull/Push Factors
As I conducted the literature review, patterns emerged that revealed dominant pull and push factors as the impetus for dropout. Although these indicators were addressed as either pull or push in a respective source, it became clear that three primary factors could serve as both pull and push: socioeconomic status, attendance, and
motivation/engagement. An additional pull factor that emerged as highly relevant in the decision to drop out of school was mental health challenges, and a push factor that warranted attention was identified as authoritative school climate.
Socioeconomic status (SES). Socioeconomic status (SES), at or below the poverty level, is a risk factor associated with dropping out of school. In fact, SES is considered one of the most salient predictors of high school dropout (Balfanz, 2013; Balfanz et al., 2014; Berkowitz, Moore, Astor, & Benbenishty, 2017; Burris & Roberts, 2012; Haan, Boon, Vermeiren, Hoeve, & de Jong, 2015; Kim, 2014; Lam, 2014; Petrick, 2014; Rendon, 2014). In the United States, more than 1 in 5 children below the age of 18 (nearly 16 million children) live in poverty (Jiang, Granja, & Koball, 2017). More specifically to those youth who are within the critical years of making the decision to drop out of school, 39% of these youth, ages 12-17, live in low-income families (Jiang et al., 2017). Ultimately, children from poverty are five times as likely not to graduate as middle-income families and six times as likely as higher-income youth (Stark & Noel, 2015). While living in poverty does not signify the educational outcome will be drop out, clearly the conditions significantly impact a student for drop out by acting as a pull factor.
Access to Resources as a Pull Factor of SES
Poverty can significantly affect a family’s access to resources to foster learning opportunities that, in turn, can inhibit a child’s cognitive ability. Such learning
opportunities are referred to as cultural capital (Lam, 2014; Lavrijsen & Nicaise, 2015). A lack of resources that provide opportunities may include the absence of materials, such as basic school supplies or study space in the home (Lavrijsen & Nicaise, 2015). It may also include a lack of access to educational toys or the ability to take field trips, attend the
theater, visit the library, or go to a museum. Cultural capital stimulates a child’s cognitive ability, and cognitive ability is the most prominent determinant of a child’s educational expectations (Kim, 2014; Lam, 2014; Lavrijsen & Nicaise, 2015). Such culturally stimulating opportunities allow a child a chance at academic success comparable to his peers from higher socio-economic classes. When it comes to student achievement, access to money matters.
Cognitive Ability as a Pull Factor of SES
Because poverty is a factor in the development of a child’s cognitive ability and because, in part, of access to resources that stimulate development, a child from poverty is likely to begin his educational journey at a disadvantage. Low-SES children have cognitive difficulties, including high levels of distractibility, challenges in monitoring the quality of their work, short attention spans, and difficulty generating new solutions to problems (Jensen, 2013). Because of this beginning deficit, children from poverty tend to have more limited vocabularies and less background knowledge as they age (Balfanz, 2013; Lam, 2014; Petrick, 2014). It seems logical that this dynamic would perpetuate a negative attitude toward school and, as the gap between peers widens, present as a risk factor for dropout.
Health as a Pull Factor of SES
Poverty can negatively affect children’s health and well-being. The dynamic created by living conditions associated with poverty affects a child’s birth weight, access to healthy and nutritional foods, access to appropriate medical and dental care, and access
to resources that support positive mental and behavioral health (Haan et al., 2015; Kim, 2014; Lam, 2014; Petrick, 2014; Ullucci & Howard, 2015). Currently, the two most prevalent chronic health challenges that children from poverty face includes asthma with an increase of 25.8% from 2012, and attention-deficit hyperactivity disorder (ADHD) with an increase of 43.2% from 2012 (Pulcini, Zima, Kelleher, & Houtrow, 2017). These chronic health conditions may not, themselves, lead to increased absences from school. However, the lack of appropriate health care to treat these chronic conditions, often a consequence of living in poverty, might. Children who are not in school do not learn. Poverty as a Push Factor
To view how poverty plays into the academic attainment of a child through only the pull of the family’s role would be to negate the importance of the role of the school as a push factor in the success of a child from poverty. Berkowitz et al. (2017) purported that the school’s role in predicting academic achievement of a student from poverty is as paramount as the family’s role. The school’s role must be one that fosters teacher
attitudes and removes discriminatory institutional practices (Petrick, 2014). Such actions have the power to transform education for children from poverty.
Teacher Attitudes About Poverty
Attitudes within a school that students from poverty cannot or do not want to learn serves only to perpetuate a cycle of low expectations and failure. Emphasizing the label of poverty often leads teachers to make excuses for students and convince
poverty (Ullucci & Howard, 2015). Furthermore, the establishment of low expectations by teachers has a direct influence over a child’s academic performance (Lam, 2014). Ultimately, this is an example of institutional discrimination against children from poverty over which they have no control (Lam, 2014). The school will remain a push factor toward dropout for children from low SES until such a time that the institution considers how its teachers can serve as the mediating factor between the child and his/her academic achievement (Ullucci & Howard, 2015).
Institutional Discrimination and Poverty
Educators must strive to nurture a “class conscious” climate in their institutions to most successfully support the education of children from poverty (Ullucci & Howard, 2015). Such a climate involves delivery of quality professional development focused on how poverty does and does not affect learning and how a teacher’s own preconceived notion about poverty impact instruction (Ullucci & Howard, 2015). Teacher
understanding of such dynamics raises the likelihood that children of poverty will not be victimized by negative stereotypes (Berkowitz et al., 2017; Ullucci & Howard, 2015). Institutions should have well-articulated protocol in place that insure discrimination does not root itself in school practices (Ullucci & Howard, 2015). Practices that are
implemented to eliminate discrimination within the institution promise to have an influence on all children, especially those from impoverished families.
Chronic Absenteeism
When a child is not in school, opportunities to learn and build skills are lost. In 2014 the total population of pre-K-12 public school enrollment was 50 million.
According to the U.S. Department of Education (2016), in this same year, 1 in 7 (14%) of these students missed 3 weeks or more of school, totaling 98 million school days lost. Across the United States more than 500 districts reported that, in 2014, 30% or more of their students missed at least 3 weeks of school (U.S. Department of Education, 2016). Chronic absenteeism is a key indicator of students likely to drop out of school (Balfanz, 2016; London, Sanchez, & Castrechini, 2016; McConnell & Kubina, 2014; Sahin,
Arseven, & Kilic, 2016; Van Eck et al., 2017). Chronic absenteeism is defined as missing 10 or more days in any given school year for any reason and is higher in high school and the early elementary grades (Balfanz & Burns, 2012; Gottfried, 2014; Sprick, Alabiso, & Yore, 2015). Students who face chronic absenteeism tend to already face significant challenges and could benefit most from school, e.g., students who are highly mobile or homeless, low-income students, SWDs, and those who are involved in the juvenile justice system (Balfanz, 2016; Henderson, Hill, & Norton, 2014; London et al., 2016).
Mobility as a Pull Factor
The foundational element for success in school is daily attendance. For students with circumstances that pull them out of school, the intention of earning a diploma is often elusive. Mobility can be a result of voluntary (i.e., moving to a better home) and involuntary factors (i.e. getting evicted from a residence) and is a widespread problem
facing American schools (Haelermans & De Witte, 2015; Metzger, Fowler, Anderson, & Lindsay, 2015). In fact, the majority of all school-aged children make at least one school change over their educational careers that is a not the result of a promotion (Rumberger, 2015). Because there is no federal mandate to collect such data, mobility data must be estimated from a variety of data sources. The U.S. Census reported that “13.5% of U.S. school-aged children (5 to 17 years of age) changed residences between 2012 and 2013” (Rumberger, 2015, p. 5). Further research supports a consistent and severe effect on test scores and high school graduation as a result of absenteeism related to mobility
(Rumberger, 2015). The fact that mobility puts youth at risk for dropping out of school is undisputed and should not be assumed to be less than a serious problem.
Homelessness as a Pull Factor
Homelessness has become aconcern for the United States over the past two decades and can be a factor in the mobility of a family, and, thus, a factor in a child’s ability to attend school. According the U.S. Department of Education’s count on homeless children and the U.S. census data from 2013, 1 in every 30 children in the nation experiences homelessness every year, totaling 2.5 million children. The two major promoters of this number are the nation’s high poverty rate and the lack of affordable housing (McKinley-Vento Homeless Education Assistance Improvement Act, 2001). A relationship is supported by research between the frequency of episodes of homelessness for children in primary school and a higher level of chronic absences for those same children in third grade (Balfanz, 2013; Fantuzzo, LeBoeuf, Brumley, & Perlman, 2013).
In addition, while the relationship between homelessness and educational outcomes is inconclusive, there is supportive research regarding the relationship between positive educational outcomes and attendance (Balfanz, 2016; Metzger et al., 2015). The
relationship between homelessness and chronic absenteeism is one that has a myriad of consequences.
Prevalent Chronic Illnesses as Pull Factors
Children with chronic illnesses have an uphill battle when it comes to school attendance. Chronic illnesses, such as epilepsy and asthma, can cause a high degree of absenteeism that interferes with the quality of education of the child. Epilepsy is the most common neurological condition in children and, therefore, the most likely condition encountered by school professionals (Barnett & Gay, 2015). A child with epilepsy may experience unprovoked and recurrent seizures because of a change in cerebral
functioning (Barnett & Gay, 2015). In 2015, 1.2% of the total U.S. population had active epilepsy. This equates to a total of approximately 3.4 million. When the data is
disaggregated, this total represents 3 million adults and 470,000 children (Zack & Kabau, 2017). According the latest estimates, this 470,000 translates to about 6 in every 1,000 students (Centers for Disease Control and Prevention, 2017). In addition, uncontrolled asthma is an important leading cause of school absenteeism (Centers for Disease Control and Prevention, 2017; Pedersen, 2016). On average, children with asthma are absent from school 2 weeks across the academic year and require elevated medical services by school
nurses (Pedersen, 2016). These chronic illnesses are the most prevalent faced by all children regardless of demographic and socioeconomic characteristics.
Chronic Absenteeism as a Push Factor
Chronic absence was added as a metric by which to measure success with the recent reauthorization of the No Child Left Behind (NCLB) Act into Every Student Succeeds Act (ESSA; 2015). Chronic absences are caused by a myriad of reasons, and to only focus on those that pull students out of school would be to disregard the role of the school in establishing its responsibility for the constructs that often push students out of school and into the status of dropout.
School Punishment as a Push Factor in Chronic Absenteeism
In public schools, it is common for issues of attendance to be discussed on a daily basis. Issues of absences are among the challenges that plague administration and
teachers. To force students into compliance with attendance expectations, it is not
uncommon for schools to implement policies that punish students for excessive absences (Gage, Sugai, Lunde, & DeLoreto, 2013). Often referred to as kid catchers such policies and practices can take the form of a removal of institutional support as students transition from one grade level to the next or inconsistent and unjust punishments, such as zero tolerance policies for discipline issues (Schoenberger, 2012; Van Eck et al., 2017). As a result of policies and practices that are highly punitive students become disengaged from the educational process, and this disengagement can result in elevated rates of
Zero-Tolerance in Philosophy and Practice
Zero-tolerance became a part of the public-school vocabulary in the mid-1980s. With the passage of the Drug Free School Act of 1986 and the Gun-Free Schools Act of 1994, zero tolerance was integrated into education policy and was used as a philosophy that required the implementation of severe pre-determined consequences for student behaviors outside of the original intention of the zero-tolerance platform (Mallett, 2016; Monahan, VanDerhei, Bechtold, & Cauffman, 2014). The public schools used zero-tolerance as a method to address non-violent and superficial infractions, such as drug and alcohol infractions, insubordination infractions, and even chronic truancy issues
(American Academy of Pediatrics Committee on School Health, 2013). As zero-tolerance became a common practice in schools, adverse and long-term effects came into focus. Zero-Tolerance Effect
Disciplinary practices evolve over time and often seem to be dictated by the problem of the day. As school leaders search for a solution to a particular chronic problem, those initially thought to be effective often end up counterproductive to their original intent, especially for the population of students who need the most help (Gage et al., 2013). Zero tolerance is one of these actions that has, often unintended consequences. Once such unintended consequence is the fostering of a school climate that is
authoritarian in nature and promotes a climate that is highly structured and demanding but not supportive (Jia, Konold, & Cornell, 2016; Monahan et al., 2014). Such a climate can produce educators with negative and intolerant attitudes toward students, advocate
the use of humiliation to deter unwanted behavior, employ excessive use of detentions, and harsher actions, such as of school suspension. These tactics actually encourage absenteeism because students wish to avoid punishment and the entities they believe are associated with the punishment (Ekstrand, 2015; Sahin et al., 2016). Such a climate is fertile ground for higher degrees of truancy and dropout rates (Cornell, Shukla, & Konold, 2015).
School-to-Prison Pipeline
Students who experienced out of school suspension and expulsion are 10 times more probable to drop out of school than students who have not been suspended or expelled (American Academy of Pediatrics Committee on School Health, 2013;
Gottfried, 2014). In addition, a suspension or expulsion from school may increase the risk for contact with the juvenile justice system and, while it is clear a relationship exists between the two factors, it is unclear how such a relationship is established (Monahan et al., 2014). School districts and juvenile courts have entered into a collaborative
relationship of which the overuse of the juvenile system to combat disciplinary
challenges was unforeseen by either of these entities (Mallett, 2016). Evidence of this can be seen in school districts that have a resource officer as a constant presence in the halls, increased policing efforts through the use of security cameras and metal detectors and regular facility walk-throughs with drug-sniffing canines (Mallett, 2016). While policy makers do not intend to make decisions that harm children, the implementation of practices that create more restrictive environments impact the learning of children.
Motivation
A student’s motivation, influenced by internal and external factors, may be a critical component in the choice to drop out of school. In part, because of the effects of such widespread influences, researchers suggest that explanations for why students drop out of high school that rely on only students’ social backgrounds and academic behaviors without considering their attitudes and motivational beliefs are incomplete (Fan &
Wolters, 2014; Khalkhali, Sharifi, & Nikyar, 2013; Moreira, et al., 2015; Ohrtman & Preston, 2014). Because school is an interactive process, engagement and motivation are often used in such a way as to present a relationship. Motivation increases engagement and vice versa (Debnam, Johnson, Waasdorp, & Bradshaw, 2014; Ricard & Pelletier, 2016).
Motivation as a Pull Factor
A student’s belief in himself is relational to his motivation to accomplish expected academic outcomes. The stronger the belief in one’s academic ability and a greater
interest in academic activities, the greater the relationship between expectations of self and a successful outcome and the lesser the risk of dropping out (Fan & Wolters, 2014; Lamote et al., 2013; Ohrtman & Preston, 2014). Motivation is a multidimensional
construct, however, that is comprised of cognitive, emotional, and behavioral components thus presenting a constellation of factors that influence a student’s decision to leave school early (Landis & Reschly, 2013). What motivates one student to leave school early may be of no influence on another student.
Motivation as a Push Factor
Relationships are an important element of functioning in life. Relationships are in everything we do, including school, and a poor relationship between a student and a teacher has been purported to influence the decision to drop out of school. Likewise, when students identified a relationship with a teacher as positive, they were more likely to persist (Kim, Chang, Singh, & Allen, 2015; McGrath & Van Bergen, 2015). In addition, people thrive in environments that feed drivers such as connectedness, competence, and autonomy (Ricard & Pelletier, 2016). School cultures that act in opposition to the cultivation of these drivers can encourage apathy and passively push students who perform lower academically, have lower attendance, and show lower rates of involvement, known as “quiet dropouts” out of school (Freeman & Simonsen, 2015). These risk factors are alterable and could be addressed with a school culture that was purposefully inclusive.
Constructs of Interest and Chosen Methodology
In this literature review the key constructs included the pull/push factors
purported in the research to have the greatest influence on a student’s decision to drop out of high school. The history of the research from which these pull/push factors were extrapolated progressively permeated the last 20 plus years of educational research, beginning in 1994. While no single pull/push factor, noted in the research was identified as a causal factor, it was clear from the research that those factors that were identified were interrelated to the point it is difficult to separate them. They provided a common