Normative data for the WAB-R: A comparison of monolingual English speakers, Asian Indian-English bilinguals, and Spanish-English bilinguals
The United States population is more culturally and linguistically diverse (CLD) than it has ever been (U.S. Census, 2010). The incidence of many neurological disorders, such as cerebrovascular disease, is also higher for particular ethnic and racial minorities, including Hispanics, African Americans, and Asians than for the general population (Healthy People 2020; Schiller et al., 2012). Therefore, CLD clients, many of whom are second language (L2) English speakers, constitute a large and growing proportion of the caseload in adult neurorehabilitation settings. Speech language pathologists (SLPs) working in such settings have rated aphasia as the most difficult condition to assess and treat for CLD clients (Centeno, 2009, in preparation). A primary challenge is accurate assessment of language abilities for several reasons: L2 speakers may have limited English proficiency, bilingualism affects test performance of even highly proficient bilinguals (Gollan et al., 2007), CLD groups differ widely in familiarity with test stimuli, and the normative samples of most diagnostic tests are not representative of CLD populations (Langdon & Wiig, 2009). The dearth of normative data on L2 speakers is a serious concern that could limit the validity of an aphasia diagnosis. Despite knowledge of these issues, SLPs report using standardized English language tests with L2 speakers (Caesar & Kohler, 2007). Hence there is a critical need to validate the diagnostic accuracy of standardized English tests for CLD adults to distinguish genuine language deficits from differences in language experience (Centeno, 2009; Mungas et al., 2011).
The main goal of this study is to collect and report additional normative data for the Western Aphasia Battery-Revised (WAB-R, Kertesz, 2006). The WAB-R was normed on just twenty individuals: 6 neurologically healthy and 14 with aphasia (Kertesz, 2006, pg. 106). Given that it is one of the most widely used aphasia batteries (Simmons-Mackie, Threats, & Kagan, 2005), it is crucial to expand the normative sample of the WAB-R. This study focuses on two of the most rapidly growing bilingual demographic groups in the United States (U.S. Census, 2010): Asian Indian-English (AI-E) and Spanish-English (S-E) speakers. There were three specific aims: 1) to collect and compare normative data for AI-E, S-E and monolingual English speakers, 2) to compare the three groups’ overall severity (Aphasia Quotient: AQ) and individual subtest scores, and 3) to identify particular areas of difficulty across subtests or participant groups.
Methods
This study includes three age and education-matched neurologically healthy community dwelling speaker groups: monolingual native English (E) from two different geographic regions of the United States (N = 36, target enrollment = 40), AI-E bilinguals (N = 8, target enrollment = 20), and S-E bilinguals (N = 15, target enrollment = 20). For each of the three groups,
participants (21 male; 38 female) were stratified into different age groups ranging from 18-95 years (mean age = 59 years, SD = 18) based on stroke incidence data (Roger et al., 2012). Background information included demographic and health information, a speech and hearing screen (Duffy, 2005), mental status screen (Folstein, Folstein, & McHugh, 1975), estimated intelligence quotient (Crawford & Allan, 1997), Geriatric Depression Scale-short form (Sheikh et al., 1991), language use history using the Bilingualism Language Profile (Birdsong et al.,
2012), and native language proficiency scoring for the two bilingual groups using guidelines of the American Council on Teaching of Foreign Languages (1999). Each participant was
individually administered the WAB-R by a trained research assistant according to standard procedures described in the test manual. AI-E and S-E bilinguals were tested by an AI-E and S-E research assistant respectively.
Results
Normative Data
Table 1 shows the means and standard deviations for the three groups on WAB-R AQ and subscores (Spontaneous Speech, Information Content, Fluency, Auditory Verbal
Comprehension, Repetition, and Naming). With one exception (Information Content subscore) means were higher and variability smaller for the monolingual group than for the two bilingual groups.
Group Comparisons
To determine whether group differences were statistically significant, a one-way general linear model (to correct for unequal cell sizes and variance) ANOVA was conducted for each WAB-R score with language group as the between subjects factor. A significant group effect was found for all analyses (p < 0.004, see Table 2). Tukey HSD post hoc tests were used for pairwise comparisons of: 1) Native English monolinguals vs. AI-E bilinguals; 2) monolinguals vs. S-E bilinguals; and 3) AI-E bilinguals vs. S-E bilinguals. Results indicated that S-E
bilinguals scored significantly below monolinguals on all scores, AI-E bilinguals scored significantly below monolinguals on Repetition, and S-E bilinguals scored significantly below AI-E bilinguals on Repetition and AQ (all ps <.05, see Table 2).
Performance Patterns
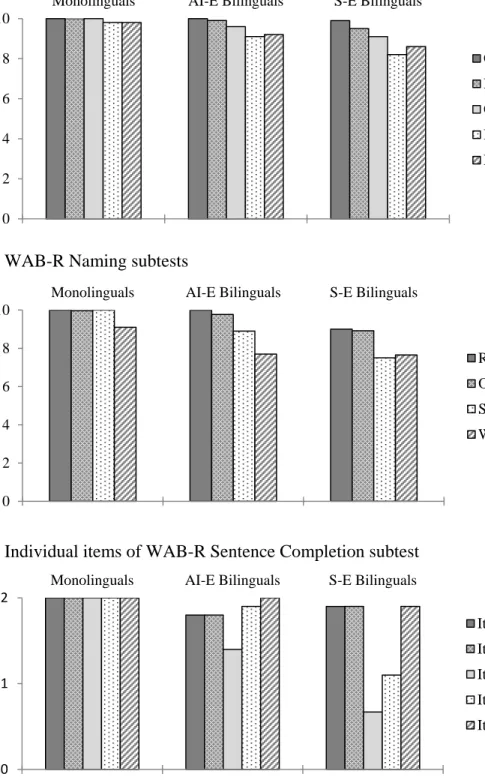
Although groups differed in the magnitude of their means across WAB-R scores, there were similarities in their overall performance pattern (see Figure 1). Specifically a similar hierarchy of difficulty was observed across WAB-R subscores (Information Content/Fluency > Comprehension > Repetition/Naming), domain subtest scores (e.g. for Naming subtests:
Responsive/Object Naming > Sentence Completion/Word Fluency), and subtest item scores (e.g. for Sentence Completion Naming subtest: Items 1, 2 & 5 > Item 4 > Item 3).
Discussion
Although normative data for specific CLD groups are available for a handful of aphasia tests (e.g., Edmonds & Donovan, 2012, and Gollan et al., 2007, for S-E bilinguals and Molrine & Pierce, 2002 for African-American English), the WAB-R has no published CLD norms and limited monolingual norms. This study contributes novel WAB-R data for three participant groups: monolingual native English-speakers, Asian Indian-English bilinguals, and Spanish-English bilinguals. Although data collection is ongoing, our findings to date reveal lower overall performance by both the bilingual groups compared to monolingual English speakers. These findings are consistent with prior research demonstrating a cultural and linguistic bias in aphasia tests (Anderson & Ulatowska, 1978; Gollan et al., 2007; Roberts & Hamsher, 1984). The results also suggest that specific language tasks and test items are particularly challenging for both bilingual groups. Repetition, sentence completion and word fluency tasks of the WAB-R were
particularly vulnerable to poor performance. These findings highlight the importance of
collecting representative normative data for CLD groups, and suggest that it may be possible to generate statistically-based recommendations for adjusted test scores for these two bilingual groups. Data from this study will assist clinicians with test selection, score adjustment, and diagnostic interpretation for these two CLD groups.
References
American Council on the Teaching of Foreign Languages (1999). ACTFL Proficiency Guidelines – Speaking. Retrieved April 5, 2012,
from http://www.actfl.org/files/public/Guidelinesspeak.pdf
Anderson, E., & Ulatowska, H. (1978). A problem of diagnosis: Black English or aphasia. In R. Brookshire (Ed.),
Birdsong, D., Gertken, L. M., & Amengual, M. (2012). Bilingual Language Profile: An Easy-to-Use Instrument to Assess Bilingualism. Retrieved 08 April, 2012, from COERLL, University of Texas at Austin: https://sites.la.utexas.edu/bilingual/
Caesar, L. G., & Kohler, P. D. (2007). The state of school-based bilingual assessment: Actual practice versus recommended guidelines. Language, Speech, and Hearing Services in Schools, 38, 190–200.
Centeno, J. (2009). Issues and principles in service delivery to communicatively impaired minority bilingual adults in neurorehabilitation. Seminars in Speech and Language, 30, 139-152.
Centeno, J. (manuscript in preparation). Assessing Speech-Language Pathology Services for Culturally and Linguistically Diverse Adults in Neurorehabilitation. St. John’s University
Clinical aphasiology: Collected proceedings 1972–1976 (pp. 125–138). Minneapolis, MN: BRK Publishers.
Crawford, J.R. & Allan, K.M. (1997). Estimating premorbid WAIS-R IQ with demographic variables: Regression equations derived from a UK sample. The Clinical
Neuropsychologist, 11, 192-197.
Duffy, J.R. (2005). Tasks for assessing speech planning or programming capacity. In Motor Speech Disorders: Substrates, differential diagnosis, and management (pp. 95). St. Louis MO: Elsevier Mosby.
Edmonds, L.A., & Donovan, N.J. (2012). Item-level psychometrics and predictors of
performance for Spanish/English bilingual speakers on An Object and Action Naming Battery. Journal of Speech, Language, and Hearing Research, 55, 359-381.
Folstein, M. F., Folstein, S. E., & McHugh, P. R. (1975). Mini-Mental State: A practical method for grading the cognitive state of patients for the clinician. Journal of Psychiatric
Research, 12, 189–198.
Gollan, T., Fennema-Notestine, C., Montoya, R., & Jernigan, T. (2007). The bilingual effect on Boston Naming Test performance. Journal of the International Neuropsychological Society, 13, 197-208.
Healthy People 2020. (2010). Disparities. Published by the U.S. Department of Health and Human Services. Retrieved
from http://www.healthypeople.gov/2020/about/DisparitiesAbout.aspx Kertesz, A. (2006). Western Aphasia Battery-Revised. San Antonio, TX: Pearson.
Langdon, H. W., & Wiig, E. H. (2009). Multicultural issues in test interpretation. Seminars in Speech and Language, 30, 261-278.
Molrine, C. J., & Pierce, R. S. (2002). Black and White adults' expressive language performance on three tests of aphasia. American Journal of Speech-Language Pathology, 11, 139-150.
Mungas, D., Widaman, K.F., Reed, B.R., & Farias, S.T. (2011). Measurement invariance of neuropsychological tests in diverse older persons. Neuropsychology, 25 (2), 260-269. Roberts, R. J., & Hamsher, K. S. (1984). Effects of minority status on facial recognition and
naming performance. Journalof Clinical Psychology, 40(2), 539–545
Roger, V. L., Go, A. S., Lloyd-Jones, D. M., Benjamin, E. J., D., B. J., Borden, W. B., & et al., o. b. o. t. A. H. A. S. C. a. S. S. S. (2012). Heart disease and stroke statistics—2012 update: a report from the American Heart Association Circulation. published online before print December 15, 2011,doi: 10.1161/CIR.0b013e31823ac046.
Schiller, J.S., Lucas, J.W., Ward, B.W., Peregoy, J.A. (2012). Summary health statistics for U.S. adults: National Health Interview Survey, 2010. National Center for Health Statistics. Vital Health Stat 10(252). Retrieved
from http://www.cdc.gov/nchs/data/series/sr_10/sr10_252.pdf.
Sheikh, J. I., Yesavage, J. A., Brooks, J. O., Friedma, L. F., Gratzinger, P., Hill, R. D., . . . Crook, T. (1991). Proposed factor structure of the Geriatric Depression Scale.
International Psychogeriatrics, 3, 23-28.
Simmons-Mackie, N., Threats, T.T., & Kagan, A. (2005). Outcome Assessment in Aphasia: A Survey. Journal of Communication Disorders, 38, 1-27.
Table 1. WAB-R normative data (mean, standard deviation) for the three participant groups. AI-E = Asian Indian-English bilinguals, E = English Monolinguals, S-E = Spanish-English bilinguals
E AI-E S-E Total
Maximum n=36 n=8 n=15 n=59 Aphasia Quotient 100 99.15 (0.73) 96.16 (3.70) 90.55 (8.00) 96.52 (5.63) Spontaneous Speech 20 20.00 (0.00) 19.86 (0.38) 19.53 (0.83) 19.86 (0.48) Information Content 10 10.00 (0.00) 10.00 (0.00) 9.87 (0.52) 9.97 (0.26) Fluency 10 10.00 (0.00) 9.86 (0.38) 9.53 (0.52) 9.86 (0.35) Auditory Verbal Comprehension 10 9.96 (0.07) 9.58 (0.62) 9.09 (1.06) 9.69 (0.68) Repetition 10 9.80 (0.23) 9.08 (1.04) 8.20 (1.27) 9.29 (1.02) Naming 10 9.80 (0.29) 9.19 (0.80) 8.64 (1.33) 9.42 (0.91)
Table 2. Summary of statistical comparisons for individual WAB-R scores. Significant post hoc pairwise comparisons are listed in the rightmost column (p < .05). AI-E = Asian Indian-English bilinguals, E = English speaking monolinguals, S-E = Spanish-English bilinguals
WAB-R Score Omnibus ANOVA Significant pairwise comparisons AQ F(2, 54) = 21.08, p < .001 S-E vs. E; S-E vs. AI-E
Spontaneous Speech F(2, 55) = 5.98, p < .004 S-E vs. E Auditory Verbal Comprehension F(2, 56) = 12.33, p < .001 S-E vs. E
Repetition F(2, 56)= 24.43, p < .001 S-E vs. E; AI-E vs. E ; S-E vs. AIE-E Naming F(2, 55) = 12.54, p < .001 S-E vs. E
Figure 1. Performance patterns of participant groups on a) WAB-R subscores, b) WAB-R Naming subtests, and c) Individual items of WAB-R Sentence Completion subtest.
a. WAB-R subscores
b. WAB-R Naming subtests
c. Individual items of WAB-R Sentence Completion subtest
0 1
2 Monolinguals AI-E Bilinguals S-E Bilinguals
Item1 Item2 Item3 Item4 Item5 0 2 4 6 8 10
Monolinguals AI-E Bilinguals S-E Bilinguals
Content Fluency Comprehension Repetition Naming 0 2 4 6 8 10
Monolinguals AI-E Bilinguals S-E Bilinguals
Responsive Naming Object Naming Sentence Completion Word Fluency