Running Head: SET SIZE INFLUENCE ON ATTENTION TO NUMBER
Set Size and Culture Influence Children’s Attention to Number
Lisa Cantrell
University of California at Davis
Megumi Kuwabara
California State University, Domiguez Hills
Linda B. Smith Indiana University
Abstract
Much research evidences a system in adults and young children for approximately representing quantity. Here we provide evidence that the bias to attend to discrete
quantity versus other dimensions may be mediated by set size and culture. Preschool age English-speaking children in the US and Japanese-speaking children in Japan were tested in a match-to-samples task in which number was pitted against cumulative surface area in both large and small numerical set comparisons. Results showed that children from both cultures were biased to attend to the number of items for small sets. Large sets responses also showed a general attention to number when ratio difficulty was easy; however, relative to the responses for small sets, attention to number decreased for both groups; moreover, both US and Japanese children showed a significant bias to attend to total amount for difficult numerical ratio distances, although Japanese children shifted attention to total area at relatively smaller set sizes than US children. These results add to our growing understanding of how quantity is represented and how such representation is influenced by context—both cultural and perceptual.
A large body of research shows that human adults and young children—without counting— approximately represent the number of items in a set through a noisy cognitive system frequently called the Approximate Number System (Dehane, 1997; Feigenson, Spelke, & Dehane, 2004; Kaufman, Lord, Reese, & Volkman, 1949; Whalen, Gallistel, & Gelman, 1999; Xu & Spelke, 2000). The ability has been associated with two main ideas. First, representation in the system has been argued by some researchers to be biased to number (e.g., Cordes & Brannon, 2009; Cantlon, Safford, & Brannon, 2010; Odic, Libertus, Feigenson, & Halberda, 2013). That is, although the congruency of number and other quantity dimensions such as total amount, density, and item size boosts accuracy in numerical decisions, when number is pitted against these other dimensions— that is, when participants are presented sets of items and their memory is later tested for which of two dimensions was most robustly stored (e.g., number or total amount)— number often wins out, suggesting that number is not only salient but may be most relevant in decisions about quantity (Cantlon & Brannon, 2007; Cantlon, Safford, & Brannon, 2009; Cordes & Brannon, 2009; Brannon, Abbott, & Lutz, 2004; Cordes & Brannon, 2008; Odic et al., 2013). Second, accuracy in quantity judgments, within the current understanding of the ANS, are dependent upon the ratio of difference in the numerical value of two sets, and this is presumably true for all set sizes (though there is some debate for small sets, e.g., Whalen, Gallistel, & Gelman, 1999; Cantlon, Safford, & Brannon, 2010; see Feigenson, Spelke, & Dehane, 2004 for a review). This means that, all other factors being equal, the ease of discriminating and comparing 8 and 12 (sets that present a 2:3 ratio of difference) should be the same as that for comparing 12 and 18, 20 and 30 or relatively larger sets of 40 and 60 items.
Here we present data that suggest that attention to other dimensions of quantity may be more salient in certain contexts and that comparison of two numerical sets is not solely determined by ratio dependency. Specifically, the data we present demonstrate that attention to number versus total amount depends on the set size in which items are presented and the cultural and linguistic history of the viewer. We suggest that our finding are—as researchers have previously suggested—the result of a quantity system that represents multiple dimensions (e.g., Cantlon, Platt, & Brannon, 2009; Gebius & Reynvoet, 2012a; Lorenco & Longo, 2011; Abreu-Mendoza, Soto-Alba, & Arias-Trejo, 2013; Rouselle, Palmers, & Noelle, 2004; Walsh, 2003); however—novel to the
literature—we suggest that the degree to which a dimension or combination of dimensions is stored in the representation varies and shifts as a function of these contextual factors. We first briefly review relevant literature that led to the hypothesis that culture and set size should affect attention to number versus total amount and then turn to the details of the main experiments.
Set size effects on attention to numerosity?
The number of items in a set influences how children and adults think and speak about those items. Items in small sets are frequently described as collections of
individual things—with noun labels taking the plural (e.g., some cows, four birds, a few grains); large sets are frequently described as collective wholes or aggregated amounts (e.g., a herd, a flock, sand, see Middleton, Wisniewski, Trindel, & Imai, 2004 and Wisniewski, 2009). Recent findings from a study investigating how children and adults categorize items provides supporting evidence (Cantrell & Smith, 2013a): items in small sets were attended to, represented, and categorized as discrete individuals (being
Smith (2013a) noted that the relation between the number of items in a set and the kinds of nouns we use to talk about those sets could be related to perceptual processes of discrete object representation— processes that are known to be limited by item density and the proximity of elements to each other (Dukette & Stiles, 1996; Hyde & Wood, 2011; Pelli, Palomares, & Majaj, 2004). As the items in an array become more numerous, they are likely be more visually crowded— a stimulus property that limits the
identification of individual items— and studies of visual processing show that there is a limit at which crowded arrays are not perceived as independent elements but the whole is perceived as a texture (Morgan, Raphael, Tibber, & Dakin, 2014; Parkes, Lund,
Angelucci, Solomon, & Morgan, 2001; see also Robitaille & Harris, 2011). Although many sets can be seen and construed in both ways (as a set of individuals units or a single whole), the conceptual and linguistic biases may reflect the perceptual processes that influence the relative ease of distinguishing the individual elements in a set.
The hypothesis stemming from these results is that individual items in a large set may be less differentiated, less segmented, and less readily perceived as discrete
individuals, and therefore large sets may be more readily perceived as continuous masses than small sets. If this is indeed the case, then the prediction that follows it that
perceivers should be more likely to attend to the discrete quantity of small sets but increasingly likely to attend to properties of the whole (such as total cumulative amount) as set size becomes very large. A study by Cantlon, Safford, and Brannon (2010) would seem to provide a direct test, yet their evidence was contrary to this prediction in 3 to 5 year olds. Their study tested children in a match-to-sample task that systematically manipulated set size from 1 to 12 items. In a forced choice procedure, children were asked to pick an option set that matched a target set and— on the critical probe trials—
one choice matched the standard in the number of items but was different in the total surface area and the other choice matched the target in the total surface area of all the items but differed in number. The choices, thus, pitted a numerical match against a total amount match. Overall children consistently and spontaneously attended to the
numerical value of these sets; Cantlon and her colleagues concluded that attention is biased to number for both small and large sets.
There are several reasons to consider a reexamination of the findings before rejecting the hypothesis of shifting biases (from number to total amount) with increasing set size. First, there are hints of the predicted effect in the Cantlon et al. study as well as other studies. Multiple dimensions are likely represented for any set of items (number, area, density); however, the attentional weight of these dimensions may depend on various factors including the actual set size. This could mean, then, that for small sets, number is the most salient dimension whereas for large sets, number is represented but some other dimension increases in saliency as well (e.g., area). If our hypothesis is correct, children may attend to number for both small and large sets, but may attend more to number for small sets, and may weight some other dimensions more heavily for large sets. Although children in the Cantlon et al. study chose number matches more than total amount matches at all examined set sizes, the number advantage did decline with set size, (see also Huntley-Fenner & Cannon, 2000 for similar results), with children showing increased attention to area with larger than smaller set sizes (see Hurewitz, Gelman & Snitzer, 2006 and Gebuis & Reynvoet, 2012 for similar and suggestive evidence from adults).
The argument is not that children do not represent number at all for large sets, but rather that other dimensions may be more salient for large sets than for small sets;
however, in order to address this question of whether different dimensions are salient for larger versus small sets, these set sizes must be tested separately. The set sizes in the Cantlon et al. study often included the comparison of a small set (e.g., 2 items) and a large set (e.g., 8 items); that is, “large set” trial comparisons in fact often were composed of a large and a small set. In this design, children could have made choices that appeared to be based on the same level of attention to the dimension of number for these by using a strategy that only required recognizing the numerical values of the smaller set. That is, when presented with the item set of 6 (a larger set, outside of the range for which children may spontaneously represent number very precisely) children may have attended to both number and area but the dimension of number may have been less salient; however, when—in the response phase— children were given the option of a small number (4 items) for which they may more accurately represent number— along side the larger set for comparison, they may simply have chosen the large set because it was simply recognized as “not-4”. If this is the case, it should be noted that the whatever the other option was (be it the “correct” number of 6 or some other larger number such as 8 or 9), the child still may have chosen it simply by recognizing that the other option (4 items) could not be the correct match. This pattern of responding would lead to what looks like the same level of attention to number for large sets in the Cantlon et al. design.
One way to address this question is to test attention to number (versus other dimensions) in exclusively large and exclusively small set trial conditions. This would eliminate the possibility of children using a mis-match recognition strategy to choose the “correct” answer. Because the set sizes used in the Cantlon et al. study did not go beyond 12, the set sizes could not be exclusively large for all ratio distances (that is, a 1:4 ratio for sets that only range from 1-12 cannot be exclusively large but would have to be a
comparison of a small and large set). Accordingly, the present study used the Cantlon et al. match-to-sample task to test preschool age children with a wider range of large sets with a maximum number of 24 items in Experiment 1 and 80 items in Experiment 2. A role for language?
How we talk about sets of things depends not just on the number of items in those sets but also on the specific language we are speaking. In English, the count-mass
distinction demands a sharp division between entities that are considered discrete and countable and those that are conceptualized as continuous substances and thus not countable. Researchers have argued that Japanese does not impose such a strict partition of discrete and continuous quantities (e.g., Imai & Genter, 1996; Imai & Mazuka, 2003). Japanese has no plural (except for a non-mandatory plural for animate entities), and the quantifier system treats discrete (inanimate) objects and continuous substances the same. These linguistic differences have led to hypotheses that English speakers may be more biased to attend to items as individual discrete and bounded things than Japanese speakers (e.g., Imai & Gentner 1996; Imai & Mazuka, 2003). Consistent with this hypothesis, a number of studies have shown that the two language groups in fact categorize simple forms differently; English speaking children are more likely to categorize simple objects (e.g., a block) as discrete items (by shape) whereas Japanese-speaking children are more likely to classify them by continuous entity properties (by material; Imai & Gentner, 1996; Yoshida & Smith, 2005; Colunga & Smith, 2005, however see also Mazuka & Friedman, 2000; Barner, Inagaki & Li, 2009; Li, Dunham, & Carey, 2009). Related to this idea, Japanese children have also demonstrated more holistic processing of visual scenes; studies have shown that English-speaking children are more likely than Japanese-speaking children to selectively attend to individuals in an
array of objects whereas Japanese children are more likely to attend to the relational properties of the array, distributing attention to the group as a whole rather than to individuals (e.g., Kitayama, Duffy, Kawamura, & Larsen, 2003; Kuwabara & Smith 2012; see also Nisbett & Masuda, 2003).
Only a few studies have directly examined quantity judgments across these languages, and these have suggested no cross-linguistic or cultural differences on attention to discrete versus continuous dimensions (Ignaki & Barner, 2009; Barner, Ignaki & Li, 2009; Li, Ogura, Barner, Yang & Carey, 2009), a finding that is consistent with the theory that universal processes form the basis for quantity perception (Feigenson, Dehane, & Spelke, 2004). Such studies, however, asked participants to judge quantities of familiar solid items in relatively small sets (e.g., Barner et al, 2009). An effect of set size on attention to number versus total area in the Cantlon et al. (2010) task could reflect universal perceptual processes or it could reflect attentional processes that develop over time and are malleable with respect to language and culture. Accordingly, the
participants in Experiment 1 included both monolingual English-speaking children living in the U.S. and Japanese-speaking children living in Japan. Experiment 2 focused on set size effects in monolingual English speakers.
Experiment 1 Method
Participants: Preschool monolingual English-speaking children (n= 55, mean age = 52.3 months, range = 37.2 – 71.8 months) and Japanese-speaking children (n= 55, mean age = 50.6, range = 36-71.8) participated in the study. Ten additional English-speaking
above in accuracy on the Standard Trials. English-speaking children were tested in daycares in Bloomington, Indiana; Japanese-speaking children were tested in daycares in Yamanashi, Japan. Children were partitioned into Younger (36-53 months, n = 61) and Older (54-72 months, n = 49) groups to test for age effects.
Stimuli: Two-dimensional images of pink squares printed on white cards were used for both target and response options. Because animate entities are more likely to be
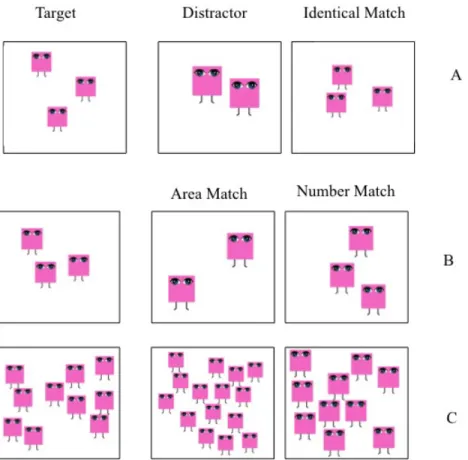
individuated in Japanese than either inanimate discrete objects or continuous substances (see Yoshida & Smith, 2003), two types of stimulus arrays were created: inanimate items (squares) and animate items (squares with eyes and feet as shown in Figure 1). Displays were sets of squares that ranged in number between 1 and 24 with cumulative surfaces that ranged between 4 cm2 and 40 cm2. All of the display sets were contained within a 10 cm X 10 cm area on the cards. The number of items (and surface areas) in the stimulus display depended on the trial kind. There were three kinds of trials: Standard Trials, Small Set Probe Trials and Large Set Probe Trials. All trial sets had three displays: the target display and two response option displays. All stimuli dimensions for Standard and Probe trials for Experiment 1 are listed in Appendix A.
Standard Trials. For the Standard Trials the target was a set of 1, 2, 3, or 4 squares with a cumulative surface area of 6, 8, 12, 16, 18, or 36 cm2. The response options always consisted of one correct choice that was identical in number and
cumulative surface area to the target (and that only differed in spatial configuration of the items) and one distractor that did not match the target in number, surface area, or spatial configuration (see Figure 1A). The distractor display could also be either 1, 2, 3, or 4 in set size and could be 6, 8, 12, 16, 18, or 36 cm2 in total cumulative surface area and could differ from the target by a 1:4, 1:3, 1:2, 2:3, or 3:4 ratio difference in number. All
numerical ratios of the number comparisons were exact (e.g., 1:4 ratio difference represents a trial in which children were asked to compare 1 and 4 squares) with the exception of 1:2 ratio, which could be either a 1 vs 2 comparison or a 2 v 4 comparison. The distractor differed from the Standard in surface area by either a 1:2 or 2:3 ratio difference, and this was counterbalanced across trials.
Figure 1. Task structure and example of stimuli for (A) Standard Trials, (B) Small Set Probe Trials, and (C) Large Set Probe Trials. Stimuli pictured are from the Animate condition. Non-animate condition stimuli and trials were identical in all aspects except that they did not have eyes and feet.
Probe Trials. For Small Set Probe Trials the target and response displays ranged between 1-4 squares with cumulative surface areas of 4, 8, 12, 16, 18, 24, 36 cm2. The
response options consisted of one number match (which was the same number of squares as the target but a different cumulative surface area) and one cumulative surface area match (which was a display of squares that was different in number from the target but matched in total area). Figure 1B shows the basic structure of a Small Set Probe Trial. The area match response options could differ from the target in number by a 1:4, 1:3, 1:2, 2:3, and 3:4 ratio difference and the number matching response option could differ from the target by a ratio of 1:2 or 2:3 in cumulative surface area difference and details of the ratios for the stimuli can be seen in Figure 2; the area differences were distributed equally across the numerical ratio differences such that each surface area difference occurred at each numerical ratio difference an equal number of times in the stimulus displays. The use of multiple area ratios is motivated by the fact that there the ratio differences for number and area are objective measures and do not indicate the psychological magnitude of the differences across dimensions; that is, a 1:2 ratio in area could be perceptually smaller or larger than a 1:2 difference in number (Stevens, 1975).
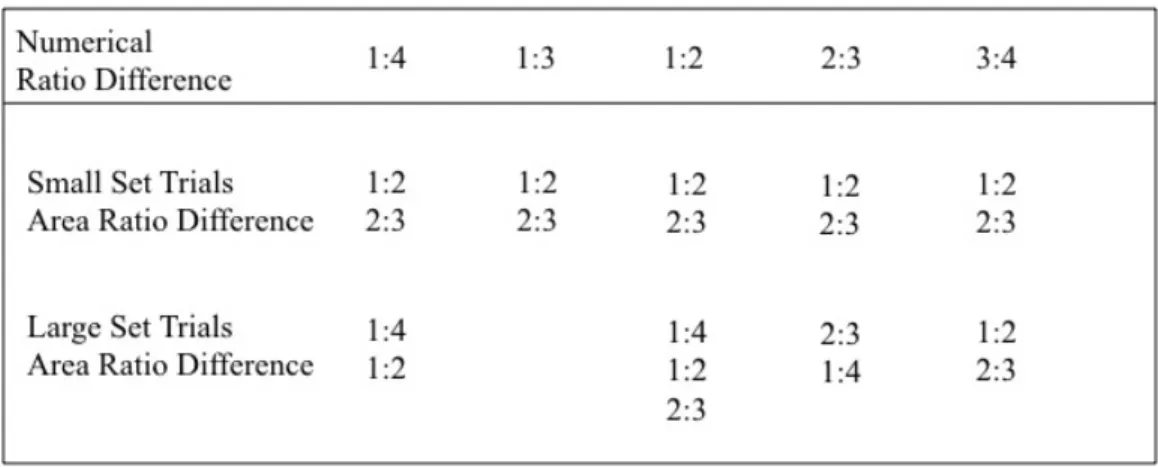
For Large Set Probe Trials the targets consisted of displays containing 6, 8, 10, 12, or 15 squares with cumulative surface areas of 12, 18, 24, 36, or 40 cm2. Response options were displays of squares in sets of 4, 5, 6, 8, 9, 12, 10, 15 or 24 that were either number or surface area matches. Figure 1C shows an example of a Large Set Probe trial. Numerical ratio differences between the numerosity of the target and non-number / area matching choice were 1:4 (6 v 24), 1:2 (5 vs 10, 6 vs 12, 10 vs 20), 2:3 (4 vs 6, 8 vs 12, 10 vs 15), and 3:4 (6 vs 8, 9 vs 12). Surface area differences between the number match and the target were ratios of 1:4, 1:2, or 2:3; within the limits of the dependencies between size and area, these area differences were distributed approximately equally across the numerical ratio differences such that each surface area difference occurred at
each numerical ratio difference. Details concerning the area and numerical ratio
differences for the Large Set Probe Trials can also be seen in Table 1. It should be noted that the design was not completely balanced in terms of the area ratio differences for small and large set conditions– a fact that may have a bearing on the results but which we address in the analyses for Experiment 1 as well as in the design of Experiment 2.
Table 1. Ratios of difference included in probe trials for each set size. Standard Trials were the same numerical and area ratios as the Small Set probe trials and only contained small sets of 1-4 items.
The direction in which the number and surface area changed from target to response option (either increasing or decreasing) was counterbalanced such that the target-to-number as well as the target-to-area match both increased and decreased across all ratio differences.
Procedure:
Each child was presented 80 trials in total: 44 Standard Trials and 36 Probe trials. Two randomly-determined orders of trials were used. Probe Trial ratios, numersosities, and surface areas were counterbalanced across children such that children responded to
different ratio comparisons for Probe Trials in the two orders. Of the 36 Probe Trials, approximately the same number were Large Set and Small Set Trials for each child.
Children were tested individually in a quiet room or area of their daycare by a native speaker of their language. During the experimental session, the child sat across from an experimenter on the floor or at a table and the stimuli were presented flat in front of the child. The target was presented for approximately 2 seconds as the experimenter instructed the child to look at it, saying (for English speakers), “You see this?” or (for Japanese speakers) “見て、これ。mite kore (see/look this)”. The fast presentation of the target was to ensure that children did not have time to count the items and that any response for number were thus due to a spontaneous representation through the ANS. The target was then removed from sight and, after a 1 second delay, the two response options were presented side by side and the experimenter said “Which looks like what we
just saw?” in English and “今見たの、どっち? ima mitano docchi (which did you
see)?” in Japanese. The first six trials were always Standard Trials to help the child understand that the purpose was finding the match. The first three of these Standard trials were treated as explicit practice trials and children were given feedback after their choice. For correct responses during these three practice trials, the experimenter positively
reinforced the child saying “Yes, that’s right!/ そうだね、そっちだね。すごいね。
soudane socchidane (Yes, that!)” for correct responses. If the child answered all three practice trials correctly, the experimenter continued on to the remaining trials. If the child did not answer correctly, the experimenter corrected the child, showing him or her the right answer and then repeated the trials until the child answered correctly on all three. All children included in the final analyses successfully completed the practice trials. No
feedback was given on any of the remaining Standard or Probe Trials. For Standard Trials, choices were counterbalanced such that the correct response occurred an equal number of times on the left and right. For Probe Trials, choices were counterbalanced such that number and area matches occurred an equal number of times on each side.
Results and Discussion
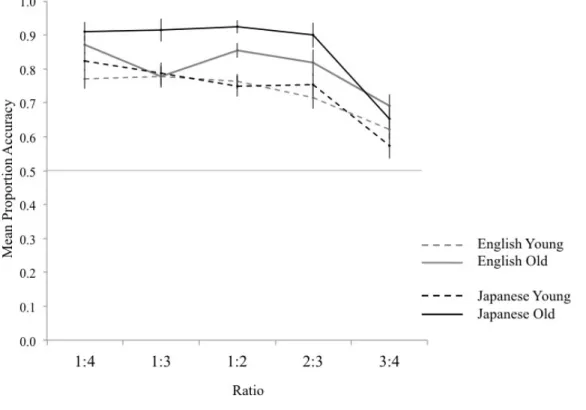
Standard Trials. Figure 2 shows the performances of the U.S. and Japanese children as a function of Age on the Standard trials in which correct matches could be based on either or both number or surface area. As is evident, the two groups performed similarly, and for both groups performance declined, as expected, as the ratio of the set sizes decreased between the two choices. Ratios differences were grouped as Easy (1:4, 1:2, 1:3) and Hard (2:3, 3:4) for initial analyses. Performance on the Standard Trials was then statistically analyzed in a 2 (English vs Japanese) X 2 (Animate vs Non-Animate Stimuli) X 2 (Younger vs Older) X 2 (Hard vs Easy Ratio) ANOVA with the between subject factors of Language (English vs. Japanese), Age (Younger vs. Older) and Stimuli Type (Animate vs. Non-Animate) and the within subjects factor of Ratio Difficulty (Easy vs. Hard). Analyses revealed a significant effect of Age; older children performed
significantly better (83%) than younger children overall (71%), F(1, 102)=36.27, p < .001,
€
ηp
2 = .26. No significant differences were found between Language groups on the Standard trials, F(1, 102)= 2.58, p = .11 or Stimulus Condition, F(1, 102)= .22, p = .64. Both language groups performed significantly above chance overall on the Standard trials (one sample t-test, English-speaking children Mean = 77%, t(54)=21.06, p<.0001;
Japanese-speaking children’s Mean = 79%, t(54)=16.74, p<.0001), but, as is evident in Figure 3, performance did depend on the ratio differences of the two choices. Indeed,
there was a main effect of Ratio Difficulty, F(1, 102)=68.68, p < .001,
€
ηp
2 = .4; children’s accuracy was higher for Easy Ratio differences (Mean = 80%) than Hard Ratio
differences (Mean = 69%, one sample t-tests, both means above chance, ps < .001). No other effect reached significance. We further confirmed the effect of ratio statistically by a one way ANOVA examining performance as a function of the five different numerical ratio differences (1:4, 1:3, 1:2, 2:3, 3:4); the analysis again showed a significant effect, F(4, 436)=38.90, p>.001,
€
ηp
2 = .26, and pairwise comparisons showed that the significant effect was due to a higher rate of numerical responding for the ratios of 1:4, 1:3, 1:2 than for ratios of 2:3 and 3:4 (Fisher LSD post hoc tests, ps < .01).
Figure 2. English and Japanese speaking children’s mean accuracy on Standard Trials as a function of Ratio Distance and Age.
Set Size Effects on Probe Trials. Figure 3 shows children’s performances on the critical Probe Trials that pitted a number match against a total area match. Children’s responses on Probe Trials were also grouped into Easy (1:4, 1:3, 1:2) and Hard
Numerical Ratios (2:3 and 3:4). Children’s proportion of number matching responses on the trials were analyzed in a 2 X 2 X 2 X 2 X 2 ANOVA for within subjects factors of Set Size (Large Set vs Small Set) and Ratio Difficulty (Easy Ratio vs Hard Ratio) and the between subjects factors of language (English vs Japanese), Age (Younger vs Older), and Stimulus Type (Animate vs Non-animate). The analysis revealed no main effect of Stimulus Type and no interactions with this variable; there was not a main effect of Age, however this variable interacted with other variables. There was an expected main effect of Ratio Difficulty, F(1, 102)=62.08, p<.0001,
€
ηp
2 = .38, which reflected children’s higher rate of number matching responses for the Easy Ratios (Mean = 72%; significantly above chance, p < .001) than for the Hard Ratios (56%; significantly above chance, p = .001) and this factor interacted with Age (Age X Ratio Difficulty effect, F(1, 102)=4.03, p= .04,
€
ηp
2 = .04)— older children showed higher numerical responding for Easy Ratios (Mean =80%) than Younger children (Mean = 69%), but they showed relatively similar levels of number matching for Difficult Ratios (Means = 58% and 55% respectively, all means significantly above chance with ps < .01). The fact that Older children responded with more numerical matches for smaller sets than Younger children on small set trials may be due to Older children’s generally better performance on these tasks (overall cognitive control and task motivation); this result could, however, also indicate that attention to number may correlate with age as a function of more experience with counting and cardinal number principles increases, a result that is consistent with other studies finding
difference in precision as a function of numerical knowledge (e.g., Abreu-Mendoza, Soto-Alba, & Arias-Trejo, 2013; Slusser & Shusterman, 2013; Slusser, Dita, & Sarnecka, 2013).
The ANOVA also revealed that there was a significant main effect of Set Size, F(1, 102)=34.60 , p<.001,
€
ηp
2 = .25, indicating that children were more likely to match by number for small sets (Mean = 67%; significantly above chance, one-sample t-test, t(109) = 9.38, p < .001) than large sets (Mean = 52%; not significantly different from chance, t(109) = .76, p = .45)— and this effect held even when analyzing trials that matched in
area ratio difference (see analyses in Area Differences section). There was no main effect of Language; however, it interacted with Set Size as well as Ratio Difficulty: there was a significant two-way interaction of Language X Set Size, F(1, 102)=4.64, p = .034,
€
ηp
2 = .04) and a three-way interaction of Set Size X Language X Ratio, F(1, 102) = 8.23, p = .005,
€
ηp
2 = .08, as well as a Set Size X Ratio X Language X Age interaction, F(1, 102)=5.950, p = .02,
€
ηp
2 = .05. There was also a marginally significant Ratio X Language interaction, F(1, 102)=3.80, p = .05,
€
ηp
2 = .03, as well a Ratio X Language X Stimuli Condition interaction, F(1, 102)=3.84, p = .05,
€
ηp
2 = .03. Important to the questions of this paper, the interaction among Language, Set Size and Ratio that can be seen in Figure 3 are consistent with the hypothesis that attention to number over continuous dimensions are affected by linguistic history and/or cultural experience and suggest that Japanese-speaking children are more willing to shift from number to area at large set sizes than English-speaking children.
Language Effects on Probe Trials. A key question for Experiment 1 is whether the effect of Set Size on attention to number is modulated by language history. The interactions between language and set size in the main analyses support this hypothesis. To more fully understand the language specific patterns, performances by each language group were analyzed separately. Because individual participants in each language group received different numbers of trials within each condition and because the five different ratios and two set size conditions were crossed and balanced across rather than within subjects, a linear mixed effects model—with the fixed factors being five Numerical Ratios (1:4, 1:3, 1:2, 2:3, 3:4), two Set Sizes (Large vs Small), two Stimuli Types
the interactions and main effects across all conditions. The linear mixed effects model analysis of U.S. children’s Probe Trial responses revealed a main effect of Ratio, F(4, 402) = 5.28, p < .001 and a marginally significant effect of Age, F(1, 402) = 3.42, p = .07. The effect of Set Size was also only marginal, F(1, 402) = 4.71, p = .07, however, there was a significant interaction of Set Size X Ratio, F(3, 402) = 2.97, p = .03. Examination of the data suggests that this interaction resulted from differences in number match choices for Large and Small Sets at the at the more difficult 2:3 ratio difference (Mean Difference was 17 percentage points); the magnitudes of difference between small and large sets at the 1:4, 1:2, or 3:4 ratios are much smaller (Mean Differences = 9, 8, and 9 percentage points respectively). This result indicates that the effect of set size on attention to area may be most robustly observed when discrimination of number is at its cusp (2:3) but because number is less easily discriminated at 3:4, the lower performance at this ratio for small sets (due to inaccurate numerical discrimination) is not
distinguishable from a potential increase in attention to area for large sets. No other main effects or interactions approached significance. The main effect of ratio was the result of decreased number matching as the ratio distance decreased; pairwise comparisons
showed a significant difference of ratios 1:4, 1:3, and 1:2 with 3:4, as well as a difference between 1:3 and 2:3, all ps < .05. The marginal main effect of Set Size was due to the fact that children’s number response rate was higher for Small Sets (Mean = 67%) than for Large Sets (Mean = 58%). Further analyses (one sample t-test, two tailed) showed that children’s responses for Small Sets were significantly biased to number for both Easy (1:4, 1:3, 1:2) and Difficult Ratio distances (2:3, 3:4) (ps < .03); however, for Large Sets, although responses were significantly above chance at Easy Ratios (one sample t-test, t(54) = 3.74, p < .0001), they did not differ from chance for Difficult Ratios (one
sample t-test, t(53) = -.19, p = .85). Thus, there is some evidence that English-speaking children’s attention to discrete quantity varied with set size and was less likely for large than small set sizes; however, the effect was not robust. The English-speaking children never systematically attended to total area at above chance levels, and the decreased attention to number occurred only at difficult ratios in the large set trials. (For difficult ratios at large set sizes, 48% of the children chose number at a rate of .33 or below, indicating a bias to attend to area. The remaining half of the children chose at .5 chance levels or showed a number bias for these trials.)
Analyses of the Japanese-speaking children’s Probe Trial performances revealed a similar overall pattern but a robust effect of Set Size. The linear mixed effects model analysis yielded a significant main effect of Set Size, F(1, 404) = 51.27, p < .0001, which was the result of an overall higher numerical matching for Small Sets (Mean = 75%) than for Large Sets (51%). There was also a significant effect of Age for the Japanese
speaking children, F(1, 404) = 10.26, p = .001. The main effect of Age was due to the overall higher rate of numerical responding for Older (Mean = 69%) than Younger children (61%). There was also a main effect of Ratio, F(4, 404) = 18.34, p < .0001, and a significant interaction of Set Size X Ratio, F(3, 404) = 3.75, p = .01. The effect of Ratio indicates that as the ratio distance decreased between numerical quantities, accurate numerical matching also decreased (pairwise comparisons show significant differences of ratios 1:4, 1:3, 1:2 with 2:3 and 3:4 and a significant difference between 2:3 and 3:4, all ps < .02). The interaction between the factors of Ratio and Set Size reflects the more marked decrease in number matching in Large Sets across the ratios than for Small Sets. Although small set responses were significantly biased to number for both Easy and Hard Ratios, Large Set responses were significantly biased to number for Easy Ratios but were
significantly biased to area at the Hard Ratios (one sample t tests, all ps <.0001). The general conclusion for the Japanese children is that both Age and Ratio affect
performance in numerical matching responses; however, Set Size modulates attention to number. Japanese-speaking children’s shift to surface area—although only observed for Large Sets and difficult numerical ratio of 2:3 an 3:4—is not wholly attributed to an inability to discriminate number: Japanese children showed a significant bias to attend to number for small sets when the ratio difference was 2:3—showing a 75% accuracy in number matching that was significantly above chance (two-tail one sample t-test, t(54)=7.55, p < .0001) but did not show a bias to attend to number at the same ratio for large sets (two-tail one sample t-test, p = .24). This conclusion was further supported by a significant difference between large and small sets at the 2:3 ratio (two-tailed paired samples t-test, t(54)=4.42, p < .0001 and there was a marginal significance when
analyzing trials matched in area difference and excluding the 1:4 area ratio trials, p = .08). If children simply shifted away from number when the ratio was too difficult to
discriminate number, then we would expect to see a shift away only on ratio differences in which children did not demonstrate a robust attention to number for small sets; however, Japanese-speaking children did indeed discriminate and choose number matches on 2:3 ratios for small sets, but not the large sets.
In sum, the overall pattern for the two groups of children are similar: Attention to number decreases with increasing set size. However, the effect is stronger for the
Japanese- than English-speaking children a fact that suggests that contextual effects on attention to discrete quantity are malleable with experience.
Area Differences. One potential influence on the pattern of performances is the area differences between the target and number choice on Probe trials. Just as attention
to number may vary across easy and hard numerical ratio differences, competition from area as an alternative dimension for matching may vary with the magnitude of the area differences. This possibility is particularly relevant to the conclusions about Set Size since the ratio differences in area varied across the two Set Size conditions: the Small Set condition was composed of trials that differed by a 1:2 and 2:3 area difference whereas Large Set trials included ratios of differences of 1:2, 2:3 and 1:4 for area. To measure the effect of Set Size independent of any possible overall role for Area differences, we re-conducted the a 2x2x2x2x2 ANOVA with the factors of Age, numerical Ratio Difficulty, Set Size, Language, and Stimulus Type, analyzing only trials with the same area ratio difference for the two Set Sizes (that is, only Large Set trials in which the ratio of difference was 1:2 and 2:3 were included and those that differed in area by 1:4 were excluded). The effect of Set Size was still observed, F(1, 102)=6.98, p = .01,
€
ηp
2 = .07, as well as a main effect of Ratio Difficulty, F(1, 102)=17.15, p < .001,
€
ηp
2 = .14, and the main effect of Age, F(1,102)=6.31, p=.014,
€
ηp
2 = .06, indicating—importantly—that the effect of Set Size was not driven solely by the difference in area ratios between the two conditions.
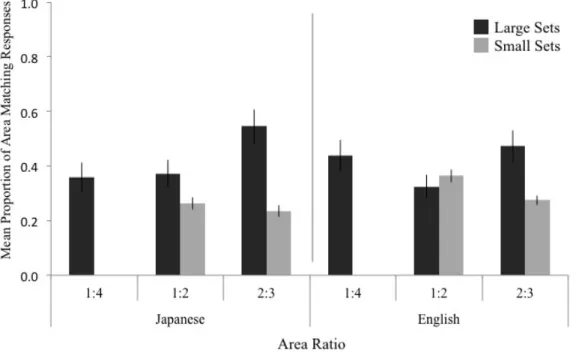
Because number and area are inversely related in this task— any factor that decreases attention to number must therefore increase attention to area; however, the magnitude of area differences in the stimulus sets is likely to play a role as well, and this can be seen in Figure 4. A one-way repeated measures ANOVA was conducted on area matching responses across the three area ratio distances (1:4, 1:2, and 2:3); the analysis revealed a significant difference, F(1, 109)=8.00, p = .006,
€
ηp
2 = .10. Pairwise
the 1:4 and 2:3 ratio trials (M=39% and M=28% respectively), p = .006, and the 1:2 and 2:3 trials (M=32% and M = 28%) p = .01; the difference between the 1:4 trials and the 1:2 trials was marginal, p = .06. The results show an overall ratio effect on area-matching responses, with a decrease in area area-matching as the ratio became closer.
Of theoretical interest and further supporting the general hypothesis, both Set Size and Culture affected attention to area when numerical ratio was collapsed across
conditions. We examined the main experimental factors— Set Size, Language, and Age— on children’s area matching responses as a function of two area ratio distances (1:2 and 2:3) in a 2 X 2 X 2 X 2 ANOVA. Only the ratio distances of 1:2 and 2:3 were included in this analysis because these occurred in both Small and Large Set trials. There was an effect of the Area Ratio, F(1, 102)= 2.70, p=.06,
€
ηp
2 = .03, with slightly higher area matching for the 1:2 ratio trials (M = 37%) than for the 2:3 ratio trials (32%). The analysis revealed a main effect of Set Size, F(1, 105)=27.78, p<.001,
€
ηp
2 = .21, and an interaction of Set Size X Language, F(1, 105)=5.04, p=.03 ,
€
ηp
2 = .05— the same main effects and interactions when for the analyses of number matches, indicating that area matches were more likely at Large Sets than Small Sets and that this effect was more robust for Japanese than English speakers. There was also a significant Set Size X Area Ratio interaction, F(1, 105)=13.84, p<.001,
€
ηp
2 = .12; children were more likely to be affected by the Area Ratio difference at Large Sets than Small sets. Language, however, did not interact with Area Ratio, F(1, 105)=.25, p=.62, indicating that—although
Japanese speakers were more affected by Set Size than English speakers, both language groups were equally influenced by area ratio; we interpret this to mean that any
the result of a difference in how Set Size influenced representation and not an overall difference in attention or task motivation between the two Language groups.
Figure 4. Mean proportion of area-matching responses as a function of ratio of difference for area, Set Size condition, and Language
In sum, the results from Experiment 1 indicate that both language groups showed a significant bias to attend to number for small sets and showed decreased attention to number for large set sizes. Small set sizes appear to encourage attention to discrete
quantity and this may be regardless of native language or culture; for larger sets, however, there was a decreased attention to discrete quantity. Finally, the effect of set size on
attention to number is culturally mediated: Japanese-speaking children showed a bias to attend to and match based on total area for large set sizes when numerical comparisons were difficult (but still discriminable), whereas the English-speaking children were unsystematic in their probe-trial choices at large set sizes and close numerical ratios— choosing at chance levels.
The fact that there was no difference between animate and inanimate items (even for Japanese-speakers) may suggest that the cultural differences in representation of continuous and discrete properties of the set may be related to how attention is distributed over a scene—and may be the result of basic visual processes of crowding rather than item kind. Another possibility is that the stimuli and task did not evoke representation of the squares— even with feet and faces— as representations of animate things.
Experiment 2
Experiment 1 indicates that children from a culture and language (such as Japanese) that attends more holistically to visual scenes and that does not mandatorily mark the distinction between discrete and continuous quantities more readily shifted attention from discrete to continuous dimensions as set size increased than did English speakers. English-speaking children also showed an effect of set size on attention to number— becoming less accurate in their number judgments with increased set size but never shifting to area matches. One possibility is that English-speaking children are always biased to make comparisons in terms of discrete quantity and only become less accurate when the perceptual comparison is too difficult. Another possibility is the set size effects in both groups reflect universal processes that encourage attention to the holistic and continuous amount properties of large sets; however, the set size at which a set is “large” and at which children shift to more continuous judgments of quantity varies with culture. To examine this possibility in Experiment 2, a new sample of English-speaking children was tested in a similar task as used in Experiment 1 but item sets were increased to numerosities beyond those used in the first experiment. Because many of the effects observed in Experiment 1 occurred between easy and hard ratios and not between
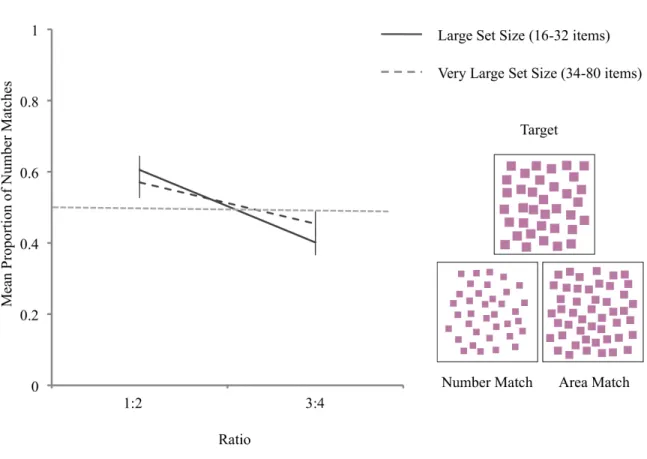
the ratios within each difficulty level, children were tested in only two ratio conditions: an easy ratio (1:2) and a more difficult ratio condition (3:4) and two set sizes— a Large set size condition of 16-32 that overlaps with and increases the Large set sizes of Experiment 1 and a Very Large set size condition of 34-80 items.
Method
Participants Preschool monolingual English-speaking children (n= 38, mean age = 55.2 months, range = 36.3 – 69 months) participated in the study and were again partitioned into Older and Younger groups as in Experiment 1. Ten additional children were excluded from the final analyses (n=9 failed to score 50% or above in accuracy on the Standard Trials, n=1 was excluded due to experimenter error). Children were tested in a quiet room in their daycare or in the laboratory in Bloomington, Indiana.
Stimuli: The stimuli used in Experiment 2 were similar to those used for Experiment 1; displays were of pink squares on white cards (see Figure 5). The item sets of squares displayed on the card ranged in number from 16 to 80 with total cumulative surface areas that ranged between 25.4 cm2 and 76.3 cm2. The spread of items over the white
background were contained within a 10 cm X 12 cm area.
As in Experiment 1, all trials contained a target and two response options. On Standard Trials, children were presented a target and then two response trials—one of which was an identical match (that contained the same number and surface area as the target and only differed in item configuration) and a distractor option that did not match in number or area (and could differ in number by a 1:2 or 3:4 ratio and differed in area from the target by a 1:2, 2:3, or 3:4 ratio). Probe Trials also contained a target and two response options—one that matched in number but was a different surface area (1:2, 2:3, or 3:4 ratio distance in area from the target) and an area match that was of a different
numerical value from the target (that could be 1:2 or 3:4 numerical ratio distance from the target).
Item sets were divided into Large (16-36 items) and Very Large sets (34-80 items) to investigate possible differences in attention to number versus total area at varying set sizes. The targets for the Large Set trials were 16, 18, 24, 32, and 36 items and the same set sizes served as response options. Targets had a total cumulative surface area of 25.4, 30.5, and 38.1 cm2; response options that were different from the target in area varied in surface area by 1:2, 2:3 or 3:4 ratios with cumulative areas of 25.4, 30.5, 38.1, 40.7, and 76.3 cm2 and these area ratio differences occurred the same number of times in both Large and Very Large Set trials. For displays in the Very Large Set trials, targets contained 34, 36, 40, 42, 34, 48, and 68 items; response options contained the same numerosities as well as a set of 80 items (which allowed for counterbalancing of direction—number increase from target to response— for 1:2 ratio trials). Surface areas of the targets for Very Large Sets were 25.4, 30.5, 38.2, 40.7, 50.9, and 61.1 cm2. Thus, for the Large Sets, the 1:2 ratio trials were comparisons of 16 vs 32 and 18 vs 36; Very Large Sets at the 1:2 ratio were comparisons of 40 vs 80 and 34 vs 68. The 3:4 ratio comparisons were 18 vs 24 and 24 vs 32 for Large Sets and were 36 vs 48 and 42 vs 56 for the Very Large Set trials. The direction in which the number and surface area changed from target to response option (either increasing or decreasing) was counterbalanced such that the target-to-number as well as the target-to-area match both increased and decreased across all ratio differences and set sizes. All stimuli dimensions for Experiment 2
(number of items and corresponding surface areas) are listed in Appendix B.
Procedure Children completed 40 trials total: 24 Standard Trials and 16 Probe Trials. The first 8 trials were always Standard Trials, and the first four of these were explicit
practice trials for which children received feedback for correct and incorrect responses. Children completed the same number of trials at each Set Size (Large and Very Large) and Ratio (1:2 and 3:4) for the critical Probe Trials, allowing for a fully counterbalanced within subjects design. All other aspects of Experiment 2 were identical to Experiment 1 in procedure; as in Experiment 1, children sat on the floor or at a table across from the experimenter, were shown targets and prompted for matches, and were never explicitly instructed to match on number or total amount and were given no feedback. The side (left or right) on which the correct/number matching option was presented on each trial was counterbalanced across all Set Sizes, Ratios, and Trial Types and two randomly generated orders were used— with the criterion that children did not complete more than 4
consecutive Probe or Standard trials, and an approximately equal number of trials for each Set Size and Ratio condition was presented in the first and last half of the task. Results and Discussion
Children’s responses for Standard Trials were significantly above chance, t(38)=11.9, p < .001. Standard trial responses were analyzed in a repeated measures analysis of variance. The 2 (Set Size) X 2 (Ratio) X 2 (Age) ANOVA revealed no significant difference in Ratio, F(1, 36) = 1.41, p = .24, but did yield a significant effect of Age, F(1, 36) = 9.33, p = .004,
€
ηp
2 = .21— Older children were more accurate (Mean = 74%) than Younger (64%). There was also a significant effect of Set Size, F(1, 36) = 9.46, p = .04,
€
ηp
2 = .21; children were more accurate for the Very Large Set Size condition (M = 75%) than the Large Set Size (M = 63%); there were no significant interactions among the variables. The significantly greater accuracy on Very Large Set Sizes was not expected but may be accounted for by an increased attention to surface area
in addition to number at the highest sets (an idea discussed in the General Discussion). Performance for both Set Size conditions was above chance (one-sample t-test, both ps < .001).
The critical question of Experiment 2 concerned attention to number versus total amount given the large set comparisons required on all the Probe Trials. Performance on these trials is seen in Figure 5. A 2 (Set Size) X 2 (Ratio) X 2 (Age) repeated measures ANOVA revealed no main effect of Set Size, F(1, 36) = .138, p = .71 or Age, F(1, 36) = .749, p = .39 and no interactions among these variables. There was, however, a main effect of Ratio, F(1, 36) = 18.964, p < .001,
€
ηp
2 = .35; on average children chose more numerical matches for the easier 1:2 ratio (M = 58%) than for the difficult 3:4 ratio (M = 43%). This variable did not interact with any other variable. Further, a one sample t-tests showed that children’s responses were significantly biased to number for the easier 1:2 ratio, t(37) = 3.30, p = .002, but were significantly biased to area for the 3:4 ratio condition, t(37) = -2.58, p = .014. These results suggest that English speaking children, even at very large set sizes attend to number when the ratio of difference is easily discriminated (1:2); however, when the ratio is difficult—potentially beyond what is quickly and easily discriminated in terms of number (3:4), children use other dimensions for comparisons. These results are consistent with previous work (e.g., Cantlon & Brannon, 2007) and help clarify the observed cultural differences: English speaking children continue to spontaneously compare sets by discrete quantity at very large set sizes as long as the ratio of differences is relatively large. However, the results also indicate the bias to represent sets in terms of discrete quantities in English-speaking children can be effectively challenged; given large sets and more difficult discriminations even English-speaking children shift their attention to a continuous dimension.
Figure 5. Mean proportion of numerical responses on Probe Trials as a function of Ratio and Set Size for Study 2 and schematic of task and stimuli used.
General Discussion
There are four main findings from the present study: 1) Congruent with previous studies, English speaking children as well as Japanese speaking children showed a bias to attend to number for small sets (of approximately 1-4 items) and accuracy in numerical matching showed the well established signature effect of ratio distance, consistent with current descriptions of the ANS (Dehaene, 1997; Feigenson, Dehaene, & Spelke, 2004). 2) Children’s spontaneous representation of number, however, decreased as set sizes became larger. 3) Overall, children showed spontaneous attention to number—for both small and large sets when the ratio of difference between to-be-compared sets was large; however, when the dimensions of area and number were pitted against one another,
children in general showed a bias to attend to total area when sets were very large and when numerical comparisons were difficult. Finally, 4) attention to and representation of the continuous extent dimension of total surface area varied with the language group of the children and suggests a role for experience in how and when discrete quantity versus continuous quantity are represented.
The first finding—that small set comparison is biased to number and that it is influenced by ratio distance— has been observed in previous studies with young children (e.g., Beran, Johnson-Pynn, & Ready, 2008; Cantlon et al, 2010; Defever, Reynvoet, & Gebuis, 2013; Halberda & Feigenson, 2008; Jordan & Brannon, 2006); however, the finding that attention to number decreased when set size increased and that attention shifted to continuous extent variables for both groups of children (albeit under different stimulus contexts) challenges current thinking that the ANS is a system with the same signature traits at all set sizes (beyond what may be encoded by an object file system of 1-4 items, Feigenson, Dehaene, & Spelke, 2004). The results add to a growing set of data suggesting that precision for numerical representation varies with the manipulation of attention (e.g., Hyde & Wood, 2011) and quantity related dimensions— including density, total area, total spread (e.g., Dakin, Tibber, Greenwood, Kingdom, & Morgan, 2011; Gebuis & Reynvoet, 2012; Hurewitz, Gelman & Snitzer, 2006; Rousselle, Palmers, & Noel, 2004; Sophian & Chu, 2008; Tokita & Ishiguchi, 2010) as well as number itself (Huntley-Fenner & Cannon, 2000; Prather, 2014; see also Cantrell & Smith, 2013a). The present results add a new point: not only is the accuracy and attention to number
influenced by set size, attention may shift away from number to total amount at these higher set sizes.
This result was predicted and aligns to recent findings that suggest that larger sets encourage attention to the group as a whole rather than to the individuals (Cantrell & Smith, 2013a). Although it is not totally clear based on these results (nor on previous findings) what aspect of set size might drive the shift in attention— it may be the correlated increase in density or decrease in item size or a combination of these— the finding nonetheless suggest an interplay or competition among discrete and continuous quantity dimension. One point that should be noted in this current set of studies is the possible role of density. Because our stimuli were not controlled or systematically manipulated in terms of the inter-item spacing, it is quite possible that density—rather than area—became a salient dimension with higher set sizes or that it is density rather than area that shifts into salient focus across cultures. Previous work conducted by Sophian and Chu (2008) as well as Hyde and Wood (2011) have suggested that changing the inter-item spacing of elements may change how sets are represented. For any one study in which a forced alternative choice task is used, it is difficult to address all the possible dimensions simultaneously and to know which of them are in fact the most salient; however, the current set of results at the very least indicate that attention is indeed shifting away from number and future studies may test various dimension to ask about the interplay among them and the interaction with culture. However— importantly— whatever the salient dimension may be, it changes with culture: Japanese speaking children were more affected by the increase in set size and shifted attention more readily for larger sets than English speakers. The finding is predicted by aspects of the language and by the accumulating evidence that English-speaking Westerners may be more object-oriented, whereas East Asian Japanese speakers may be more likely to distribute attention more holistically across a visual scene, representing properties of a group rather than
individuals (e.g., Duffy, Toriyama, Itakura, & Kitayama, 2009; Kitayama, Duffy, Kawamura, & Larsen, 2003; Kuwabara & Smith, 2012; Kuwabara, Son & Smith 2011; Masuda & Nisbett, 2001; Nisbett & Masuda, 2003).
The findings are theoretically informative on two grounds: (1) they suggest that whatever the processes are for quantification—they are malleable and, at the very least, are influenced by language and/or cultural factors and (2) they suggest that the likelihood of discrete and continuous representations of quantities lie on a continuum with the bias for discrete representations moveable as a function of set size and difficulty of number discrimination. Because Japanese speakers more readily view scenes holistically, the representation of the discrete individuals may be more easily overtaken by the
representation of cumulative dimensions or gestalt properties— properties such as density, spatial frequency, or total area covered by items. This idea is supported by research
investigating Japanese and English speakers’ memory for visual scenes (e.g., scenes with multiple items). In such studies, Japanese speakers remember the relational and holistic properties (the background color or the configuration of items) whereas English speakers encode and remember the individual items (e.g., Masuda & Nisbett, 2001). Moreover, recent eye-tracking studies indicate that eye movements— where and for how long people fixate on various aspects of scenes— varies by culture; East Asians fixate more on the contextual properties of a scene (the background) than Westerners who tend to fixate longer on individual, focal objects (e.g., Chua, Boland, & Nisbett, 2004). The current results, in the context of this larger scope of cross-cultural findings, suggest that the same cultural factors that lead to different baselines for what is visually salient or memorable as well as eye-movements also appear to affect quantity representation— a process that has sometimes been discussed as universal (e.g., Feigenson, Dehane, & Spelke, 2004).
Future studies may use eyetracking ask how these different cultural groups attend to these sets of varying quantity or whether experimentally manipulating visual attention through priming may also lead to variation in what dimensions of quantity is represented.
How do these findings fit within the current framework of the ANS? One possibility is that the ANS—as a system that encodes and represents number— is responsible only for number comparison and thus there must be limits on the kinds of stimulus arrays and contextual factors that lead to robust activation of the ANS: sets that are not too crowded or too dense or numerous most readily engage the ANS and do so most robustly within cultural contexts that prime individuals to individuate objects in the environment (U.S. and English language). Alternatively, the same unified system for representing quantity may be responsible for the full pattern of findings, including those probe trials on which participants matched arrays by number and those trials on which they matched arrays in by total amount. That is the quantity system may represent multiple (interacting) dimensions and the saliency or weight of these dimensions may shift under particular contexts. A subtle finding in the results may be interpreted as consistent with this idea: there was increased precision on Standard Trials for the largest sets when number and area were correlated (Experiment 2)—a phenomenon we did not expect but that has been also recently observed in adults (Prather, 2014). These results fit into an understanding of a quantity system that in engaged by and represents multiple magnitude dimensions (e.g., Cantlon & Brannon, 2007; Gebius & Reynvoet, 2012b; Lorenco & Longo 2011; Walsh, 2003). This is seen when number and area are both leading to the correct answer: accuracy increases with set size increases (as in the Standard trials in Experiment 2) and performance gains the added boost in total area representation. When area does not correlate with number (Probe Trials), however, these
dimensions may perceptually compete. However, it is not simply that multiple dimensions are always represented in the same way, but rather—as our results
demonstrate— that these dimensions shift in and out of saliency and combine with one another in different ways depending on the developmental history of the individual and the judgment context (in this case set size).
Finally, our data also contribute to a growing body of literature that suggest that number is indeed a salient dimension—possibly more so than certain other continuous extent dimensions. All children were biased to represent and match based on number for easy ratio differences—even for large set sizes—and English speaking children never showed a systematic shift to surface area as a function of set size—only when ratio for number was too difficult to discriminate. What is the origin of this bias? Although our data cannot speak directly to how early such a bias might arise, previous work has, to date, left it unclear as to whether young infants are in fact attentive to number and some work suggests that the number bias may not be present in infants and may be especially weak for the representation of small sets (see Cantrell & Smith, 2013b for a review; see also Cordes & Brannon, 2009 and Starr, Libertus, & Brannon, 2014 for an alternative view). Learning language and learning to count discrete objects may be relevant factors in the bias to compare small sets by number (Carey, 2004, 2009; Gelman & Gallistel, 1978; Slusser, Ditta, & Sarnecka, 2013). If this is so, it would provide a route through which the cultural/linguistic differences observed in Experiment 1 may be explained. There is previous research to lead us to conclude that culture and experience with
cardinal principals may play a significant role in an attentional bias to number, at least in certain contexts such as difficult-to-compare ratios: In a study that used a similar match-to-samples tasks with monkeys, Cantlon and Brannon (2007) found that, whereas all
monkeys attended to and compared sets based on number for easy ratios regardless of training history, the monkey in their study who had never had any training with number showed a systematic decrease in attention to number as the numerical ratio decreased and in fact showed an increase in attention to area. This finding is very similar to our own results and suggests a pathway for the observed cultural differences— with languages that do or do not mandatorily mark discrete quantity and/or cultures that do or do not encourage attention to objects as individuals.
In conclusion, the present experiments demonstrate that whatever the system(s) is that is responsible for quantity judgments, it is flexible and shifts to other dimensions when set sizes are large. Further, culture plays a role in these attentional biases that operate in quantity representation.
References
Abreu-Mendoza, R. A., Soto-Alba, E. E., & Arias-Trejo, N. (2013). Area vs. density: influence of visual variables and cardinality knowledge in early number comparison. Frontiers in psychology, 4.
Barner, D., Inagaki, S., & Li, P. (2009). Language, thought, and real nouns. Cognition, 111(3), 329-344.
Beran, M. J., Johnson-Pynn, J. S., & Ready, C. (2008). Quantity representation in children and rhesus monkeys: Linear versus logarithmic scales. Journal of experimental child psychology, 100(3), 225-233.
Brannon, E. M., Abbott, S., & Lutz, D. J. (2004). Number bias for the discrimination of large visual sets in infancy. Cognition, 93(2), B59-B68.
Cantlon, J. F., & Brannon, E. M. (2007). How much does number matter to a monkey (macaca mulatta)? Journal of Experimntal Psychology: Animal Behavior Processes, 33(1), 32-42.
Cantlon, J. F., Platt, M. L., & Brannon, E. M. (2009). Beyond the number domain. Trends in cognitive sciences, 13(2), 83-91.
Cantlon, J. F., Safford, K. E., & Brannon, E. M. (2010). Spontaneous analog number representations in 3‐year‐old children. Developmental science, 13(2), 289-297. Cantrell, L., & Smith, L. B. (2013a). Set size, individuation, and attention to shape.
Cognition, 126(2), 258-267.
Cantrell, L., & Smith, L. B. (2013b). Open questions and a proposal: A critical review of the evidence on infant numerical abilities. Cognition, 128(3), 331-352.
Carey, S. (2004). Bootstrapping & the origin of concepts. Daedalus, 133(1), 59-68. Carey, S. (2009). The origin of concepts. Oxford University Press.
Clearfield, M. W., & Mix, K. S. (1999). Number versus contour length in infants' discrimination of small visual sets. Psychological Science, 10(5), 408-411. Clearfield, M. W., & Mix, K. S. (2001). Amount versus number: Infants' use of area and
contour length to discriminate small sets. Journal of Cognition and Development, 2(3), 243-260.
Colunga, E., & Smith, L. B. (2005). From the lexicon to expectations about kinds: a role for associative learning. Psychological review, 112(2), 347.
Cordes, S., & Brannon, E. M. (2008). The difficulties of representing continuous extent in infancy: Using number is just easier. Child development, 79(2), 476-489. Dakin, S. C., Tibber, M. S., Greenwood, J. A., & Morgan, M. J. (2011). A common
visual metric for approximate number and density. Proceedings of the National Academy of Sciences, 108(49), 19552-19557.
Defever, E., Reynvoet, B., & Gebuis, T. (2013). Task and age dependent effects of visual stimulus properties on children’s explicit numerosity judgments. Journal of Experimental Child Psychology.
Dehaene, S. (1997). The number sense: How the mind creates mathematics. Oxford University Press.
Duffy, S., Toriyama, R., Itakura, S., & Kitayama, S. (2009). Development of cultural strategies of attention in North American and Japanese children. Journal of experimental child psychology, 102(3), 351-359.
Dukette, D., & Stiles, J. (1996). Children's analysis of hierarchical patterns: Evidence from a similarity judgment task. Journal of Experimental Child Psychology, 63(1), 103-140.
Feigenson, L., Carey, S., & Spelke, E. (2002). Infants' discrimination of number vs. continuous extent. Cognitive psychology, 44(1), 33-66.
Feigenson, L., Dehaene, S., & Spelke, E. (2004). Core systems of number. Trends in cognitive sciences, 8(7), 307-314.
Gebuis, T., & Gevers, W. (2011). Numerosities and space; indeed a cognitive illusion! A reply to de Hevia and Spelke (2009). Cognition, 121(2), 248-252.
Gebuis, T., & Reynvoet, B. (2012a). The interplay between nonsymbolic number and its continuous visual properties. Journal of Experimental Psychology: General, 141(4), 642.
Gebuis, T., & Reynvoet, B. (2012b). The role of visual information in numerosity estimation. PloS one, 7(5), e37426.
Gelman, R., & Gallistel, C. (1978). Young children's understanding of numbers. Halberda, J., & Feigenson, L. (2008). Developmental change in the acuity of the"
Number Sense": The Approximate Number System in 3-, 4-, 5-, and 6-year-olds and adults. Developmental psychology, 44(5), 1457.
Huntley-Fenner, G., & Cannon, E. (2000). Preschoolers' magnitude comparisons are mediated by a preverbal analog mechanism. Psychological Science, 11(2), 147-152.
Hurewitz, F., Gelman, R., & Schnitzer, B. (2006). Sometimes area counts more than number. Proceedings of the National Academy of Sciences, 103(51), 19599-19604. Hyde, D. C., & Wood, J. N. (2011). Spatial attention determines the nature of nonverbal
number representation. Journal of cognitive neuroscience, 23(9), 2336-2351. Imai, M., & Gentner, D. (1997). A cross-linguistic study of early word meaning:
Imai, M., & Mazuka, R. (2003). Re-evaluating linguistic relativity: Language-specific categories and the role of universal ontological knowledge in the construal of individuation. Language in mind: Advances in the study of language and thought, 429-464.
Inagaki, S., & Barner, D. (2009). Countability in absence of count syntax: Evidence from Japanese quantity judgments. Studies in language sciences, 8.
Jordan, K. E., & Brannon, E. M. (2006). A common representational system governed by Weber’s law: Nonverbal numerical similarity judgments in 6-year-olds and rhesus macaques. Journal of Experimental Child Psychology, 95(3), 215-229.
Kaufman, E. L., Lord, M. W., Reese, T. W., & Volkmann, J. (1949). The discrimination of visual number. The American journal of psychology, 62(4), 498-525.
Kitayama, S., Duffy, S., Kawamura, T., & Larsen, J. T. (2003). Perceiving an object and its context in different cultures A cultural look at new look. Psychological Science, 14(3), 201-206.
Kuwabara, M., & Smith, L. B. (2012). Cross-cultural differences in cognitive
development: Attention to relations and objects. Journal of experimental child psychology, 113(1), 20-35.
Kuwabara, M., Son, J. Y., & Smith, L. B. (2011). Attention to context: US and Japanese children's emotional judgments. Journal of Cognition and Development, 12(4), 502-517.
Li, P., Dunham, Y., & Carey, S. (2009). Of substance: The nature of language effects on entity construal. Cognitive psychology, 58(4), 487-524.
Li, P., Ogura, T., Barner, D., Yang, S. J., & Carey, S. (2009). Does the conceptual distinction between singular and plural sets depend on language?. Developmental psychology, 45(6), 1644.
Lourenco, S. F. & Longo, M. R. (2011). Origins and development of generalized
magnitude representation. In S. Dehaene and E. Brannon (Eds.) Space, Time, and Number in the Brain: Searching for the Foundations of Mathematical Thought. Elsevier.
Masuda, T., & Nisbett, R. E. (2001). Attending holistically versus analytically: comparing the context sensitivity of Japanese and Americans. Journal of personality and social psychology, 81(5), 922.
Mazuka, R., & Friedman, R. S. (2000). Linguistic relativity in Japanese and English: Is language the primary determinant in object classification?. Journal of East Asian Linguistics, 9(4), 353-377.
Middleton, E. L., Wisniewski, E. J., Trindel, K. A., & Imai, M. (2004). Separating the chaff from the oats: Evidence for a conceptual distinction between count noun and mass noun aggregates. Journal of Memory and Language, 50(4), 371-394.
Morgan, M. J., Raphael, S., Tibber, M. S., & Dakin, S. C. (2014). A texture-processing model of the ‘visual sense of number’. Proceedings of the Royal Society B: Biological Sciences, 281(1790), 20141137.
Mussolin, C., Nys, J., & Leybaert, J. (2012). Relationships between approximate number system acuity and early symbolic number abilities. Trends in Neuroscience and Education, 1(1), 21-31.
Nisbett, R. E., & Masuda, T. (2003). Culture and point of view. Proceedings of the National Academy of Sciences, 100(19), 11163-11170.