CONTRIBUTORS AND PARTICIPANTS
Editors:Hilde Kruse NORM-VET, The Norwegian Zoonosis Centre
Gunnar Skov Simonsen NORM, Department of Microbiology, University Hospital of Tromsø The following persons contributed to the writing of this report:
Hege Salvesen Blix WHO Collaborating Centre for Drug Statistics Methodology Kari Grave VETLIS / The Norwegian School of Veterinary Science
Einar Heldal The National Health Screening Service / The National Tuberculosis Register Merete Hofshagen NORM-VET, The Norwegian Zoonosis Centre
Hilde Kruse NORM-VET, The Norwegian Zoonosis Centre Jørgen Lassen The National Institute of Public Health Ane Nødtvedt NORM-VET, The Norwegian Zoonosis Centre Per Sandven The National Institute of Public Health
Gunnar Skov Simonsen NORM, Department of Microbiology, University Hospital of Tromsø Martin Steinbakk NORM, Department of Microbiology, University Hospital of Tromsø The following institutions participate in the NORM-VET surveillance system:
The Municipal Food Control Authorities The Norwegian Food Control Authority The Norwegian Animal Health Authority
The National Institute of Public Health Jørgen Lassen / Trine-Lise Stavnes
The National Veterinary Institute Gudmund Holstad / Tormod Mørk / Ellen Christensen / Hanne Tharaldsen The Norwegian Zoonosis Centre Merete Hofshagen / Hilde Kruse / Ane Nødtvedt
The following institutions participate in the NORM surveillance system:
Laboratory of Enteric Pathogens, The National Institute of Public Health Jørgen Lassen / Trine-Lise Stavnes Department of Microbiology, Ullevål University Hospital Turid Mannsåker / Thea Bergheim Department of Immunology and Microbiology, Haukeland University Hospital Asbjørn Digranes / Berit Riksheim Department of Microbiology, University Hospital of Trondheim Per Leiv Svarva / Randi Valsø Lyng
Department of Microbiology, University Hospital of Tromsø Gunnar Skov Simonsen / Merethe Elise Olsen Department of Microbiology, Central Hospital of Oppland Rolf Arne Sandnes / Ingunn Haavemoen
Telelab A/S, Skien Yngvar Tveten / Anne Ragnhild Oseid
Department of Microbiology, Akershus Central Hospital Martin Steinbakk / Liselotte Buarø Department of Microbiology, Central Hospital of Rogaland Elisebet Haarr / Tone Roa
Department of Microbiology, Central Hospital of Nordland Liisa Mortensen / Karstein Korsvik The following persons are members of the NORM-VET steering group:
Gunnar Hagen The Norwegian Animal Health Authority Nina Krefting Aas The Norwegian Food Control Authority Ellen Mari Grande The National Agricultural Inspection Service Kåre Fossum The National Veterinary Institute
Hilde Kruse The Norwegian Zoonosis Centre
The following persons were members of the NORM reference group in 2000: E. Arne Høiby The National Institute of Public Health
Reidar Hjetland Department of Microbiology, Central Hospital of Sogn og Fjordane Eirik Holten Department of Microbiology, Central Hospital of Akershus
Asbjørn Digranes Department of Immunology and Microbiology, Haukeland University Hospital Inger Sofie Samdal Vik Department of Microbiology, County Hospital of Møre og Romsdal, Molde
ISSN: 1502-2307
CONTENTS
I. Sammendrag (norsk) ………. 4
II. Summary (English)……… 7
III. Introduction ……….. 10
IV. Demographic data……….………. 11
V. Consumption of antimicrobial agents A. Animal consumption……… 12
B. Human consumption ………..……….. 15
VI. Occurrence of antimicrobial resistance A. Feed / animals / food Bacteria from feed Escherichia coli……….………… 18
Bacteria from animals Staphylococcus spp. ………..………... 19
Bacteria from food Escherichia coli …..……….. 25
Enterococcus spp.……….. 26
Coagulase positive Staphylococcus spp.……….…….. 28
B. Zoonotic and other food-borne microorganisms Salmonella …..……….. 29
Shigella spp..………. 36
Yersinia enterocolitica……….. 37
Campylobacter spp.….……….. 38
C. Human clinical isolates Blood culture Escherichia coli ……….……… 42
Klebsiella spp. ………... 43
Enterococcus spp. ……….………. 45
Streptococcus pneumoniae ……… 46
Staphylococcus aureus ……….……….……… 48
Respiratory tract Haemophilus influenzae ……… 49
Streptococcus pneumoniae ……… 51
Urinary tract Escherichia coli ……… 52
Klebsiella spp. ……….………. 54
Enterococcus spp. ……… 55
Tuberculosis Mycobacterium tuberculosis ……… 57
Appendix 1 Collection of data on animal consumption of antimicrobial agents………. 58
Appendix 2 Collection of data on human consumption of antimicrobial agents………. 59
Appendix 3 Sampling, microbiological methods and data handling in NORM-VET……… 60
Appendix 4 Sampling, microbiological methods and data handling of zoonotic infections…………. 62
Appendix 5 Sampling, microbiological methods and data handling in NORM………. 64
I.
SAMMENDRAG
Forbruket av antibiotika til dyr i Norge ligger på etmoderat nivå sammenlignet med mange andre industrialiserte land, og forbruksmønsteret er i hovedsak gunstig. Det totale salget av veterinære antibakterielle midler godkjent for terapeutisk bruk til dyr i Norge var 5750 kg i 2000, noe som utgjør en 39% reduksjon siden 1995. Andelen penicilliner av det totale forbruket økte fra 36% i 1995 til 44% i 2000. I samme periode sank aminoglykosidenes andel av det totale forbruket fra 27% til 20%. I 2000 utgjorde penicilliner den største andelen av forbruket (44%), fulgt av sulfa (27%), aminoglykosider (20%), tetracykliner (3%), trimetoprim og derivater (3%), og andre antibakterielle midler (4%). Det totale salget av veterinære antibakterielle midler godkjent for terapeutisk bruk til oppdrettsfisk i Norge utgjorde 685 kg i 2000, og kinoloner representerte 76% av dette forbruket. I løpet av de siste 13 årene har forbruket av antibakterielle midler i oppdrettsnæringen blitt redusert med 99% samtidig som produksjonen av oppdrettsfisk er mangedoblet. Denne reduksjonen tilskrives først og fremst innføring av effektive vaksiner, men bedrede miljøforhold i oppdrettsnæringen har også hatt betydning.
Antibakterielle vekstfremmere benyttes ikke lenger i husdyrproduksjonen i Norge. Avoparcin ble forbudt i 1995 og virginiamycin i 1998. Bacitracin er ikke forbudt, men benyttes ikke lenger som fôrtilsetningsstoff. Årlig forbruk av koksidiostatika har vært på samme nivå de siste seks årene, selv om forbruksmønsteret har endret seg. Narasin har dominert bruken siden 1996, mens bruken av andre ionofore koksidiostatika har sunket. Den relativt gunstige situasjonen med hensyn til bruk av antibiotika i norsk landbruk gjenspeiler seg i en moderat forekomst av antibiotikaresistens blant bakterier isolert fra norske husdyr og animalske produkter.
Noe resistens ble avdekket ved undersøkelse av
Escherichia coli fra hundefôr. Resistens mot henholdsvis streptomycin, tetracyklin, sulfonamider og ampicillin ble hyppigst observert. Det ble ikke påvist nedsatt følsomhet overfor kinoloner.
Forekomsten av resistens blant Staphylococcus aureus
fra så vel klinisk som subklinisk mastitt hos ku er fortsatt på et relativt lavt nivå. Forekomsten av resistens var imidlertid høyere blant isolater fra subklinisk mastitt sammenlignet med isolater fra klinisk mastitt. Resistensfrekvensene gjenspeiler antibiotikaforbruket, i og med at terapeutisk vanlig brukte antibiotika som penicillin, streptomycin og trimetoprim/sulfa var de stoffene det oftest ble påvist resistens overfor. Det ble påvist en betydelig høyere forekomst av resistens blant koagulase-negative stafylokokker fra mastitt hos ku sammenlignet med S. aureus-isolatene.
S. intermedius fra hudinfeksjoner hos hund var ofte resistente mot sulfonamider, penicillin, fusidinsyre og tetracyklin. En betydelig andel var resistente mot erytromycin, spiramycin, klindamycin og streptomycin. Forekomsten av resistens mot trimetoprim/sulfa er fortsatt meget lav, mens resistens mot cefalosporiner og fluorokinoloner fortsatt ikke påvises. Stafylokokker fra øreinfeksjoner var hyppigere resistente mot fusidinsyre
sammenlignet med stafylokokker fra øvrige hudinfeksjoner, mens det motsatte var tilfellet når det gjaldt pencillinresistens.
Til sammen 36% av E. coli fra kyllingkjøtt ble klassifisert som resistente mot ett eller flere av de antibiotika som inngikk i undersøkelsen; 16% mot ett, 11% mot to og 9% mot tre eller flere. Resistens mot sulfonamider ble hyppigst observert, etterfulgt av resistens mot henholdsvis streptomycin, tetracyklin, ampicillin, trimetoprim og nalidixinsyre. Til sammen 64 % av enterokokkene fra kyllingkjøtt ble klassifisert som resistente mot ett eller flere av de antibiotika som inngikk. Samlet sett var 38% av isolatene resistente mot kun ett antibiotikum, 22% mot to, og 4% mot fire eller flere antibiotika. Resistens mot bacitracin ble hyppigst observert, etterfulgt av resistens overfor tetracyklin, erytromycin, spiramycin, vankomycin og streptomycin (høygradig). Det er noe terapeutisk bruk av tetracyklin i norsk kyllingproduksjon.
Til sammen 25 % av E. coli fra svinekjøtt ble klassifisert som resistente mot ett eller flere av de antibiotika som inngikk i undersøkelsen; 5% mot ett, 7% mot to og 12% mot tre eller flere. Resistens mot streptomycin ble hyppigst observert, etterfulgt av resistens mot sulfonamider, tetracyklin, trimetoprim og ampicillin. Disse antibiotika brukes ofte terapeutisk i norsk svineproduksjonen. Det ble også observert noe resistens mot kloramfenikol, kanamycin og gentamicin. Til sammen 36% av enterokokkene fra svinekjøtt ble klassifisert som resistente mot ett eller flere av de antibiotika som inngikk. Sett under ett var 24% av isolatene resistente mot kun ett antibiotikum, 9% mot to og 2% mot tre eller flere antibiotika. Resistens mot tetracyklin ble hyppigst observert, etterfulgt av resistens mot bacitracin, trimetoprim, streptomycin (høygradig), erytromycin, spiramycin, kloramfenikol og gentamicin. Resultatene fra resistensundersøkelsene av indikatorbakterier fra norsk kylling- og svinekjøtt var i overensstemmelse med resultatene fra tilsvarende undersøkelser i Norge i 1998. Dataene viser at fekale indikatorbakterier i norsk svine- og kyllingkjøtt kan være resistente mot ulike typer antibiotika. Generelt ble det hyppigst observert resistens mot de antibiotika som er blitt mest benyttet i de respektive næringer. Det synes følgelig å være en sammenheng mellom bruk av antibiotika til matproduserende dyr og forekomst av bakterier som uttrykker resistens mot tilsvarende antibiotika i kjøttprodukter fra slike dyr.
Blant S. aureus fra tankmelk i storfe- og geitebesetninger ble det påvist noe resistens mot penicillin og streptomycin. Forekomsten av resistens mot de ulike antibiotika er i overensstemmelse med bildet som er beskrevet for S. aureus fra klinisk mastitt hos storfe. Alle ni Salmonella-isolater fra dyrefôr samt alle 14 S.
Typhimurium-isolater fra norske dyr var følsomme for alle antibiotika som inngikk i undersøkelsen. Det ble ikke gjort funn av S. Enteritidis hverken fra dyr eller dyrefôr. Av de 22 Salmonella-isolatene fra dyr som ikke var S. Typhimurium, ble to klassifisert som
multiresistente – begge fra måker. To S. Typhimurium-isolater fra importerte næringsmidler, fra henholdsvis belgisk svinekjøtt og fransk kalkunkjøtt, ble identifisert som multiresistente DT104. Isolatet fra kalkunkjøtt var også resistent mot nalidixinsyre og viste intermediær følsomhet for ciprofloxacin. Øvrige salmonellaisolater fra næringsmidler var følsomme for de fleste antibiotika som inngikk i undersøkelsen, med unntak av at en relativt høy andel viste redusert følsomhet for henholdsvis kloramfenikol og tetracyklin.
Når det gjelder salmonella fra mennesker, var forekomsten av resistens blant S. Enteritidis moderat sammenlignet med S. Typhimurium og “Salmonella
andre enn S. Enteritidis og S. Typhimurium”. De rapporterte resistensfrekvensene er dessverre ikke delt inn i importerte tilfeller og tilfeller smittet i Norge. Blant
S. Enteritidis-isolatene ble det påvist noe resistens mot henholdsvis tetracyklin, kloramfenikol, ampicillin og trimetoprim/sulfa, samt en relativt høy forekomst av resistens mot nalidixinsyre. Blant de øvrige salmonellaisolatene var det en høy forekomst av resistens mot henholdsvis kloramfenikol, tetracyklin, og ampicillin, og i noe mindre grad mot nalidixinsyre og trimetoprim/sulfa. Til sammen 33% av S. Typhimurium-isolatene ble identifisert som multiresistente DT104, hvorav 80% fra importerte tilfeller. Av de multiresistente DT104-isolatene var 6% resistente mot nalidixinsyre. Forekomsten av resistens blant isolater av Shigella spp. fra mennesker var relativt høy. En betydelig andel av isolatene var resistente mot tetracyklin, trimetoprim/sulfa, kloramfenikol, ampicillin og nalidixinsyre. Andelen av salmonella- og shigella-isolater som var resistente mot ciprofloxacin var lav. Imidlertid uttrykte en betydelig andel intermediær følsomhet for ciprofloxacin, og mange av disse var også resistente mot nalidixinsyre.
Blant isolater av Yersinia enterocolitica fra mennesker ble det påvist noe resistens mot kloramfenikol. Ett isolat var resistent mot nalidixinsyre, mens 13% var intermediært følsomme for ciprofloxacin.
Isolater av Campylobacter jejuni og C. upsaliensis fra katt og hund var stort sett følsomme for de antibiotika som inngikk, med unntak av streptomycin, hvor 5% av
C. jejuni og 90% av C. upsaliensis var resistente. Ett isolat av C. upsaliensis fra hund var resistent mot nalidixinsyre og intermediært følsomt for ciprofloxacin. Campylobacter-isolatene fra kyllingkjøtt var i hovedsak følsomme for de antibiotika som inngikk, bortsett fra ett isolat som var resistent mot nalixidinsyre og gentamicin. En betydelig andel av campylobacter-isolatene fra mennesker var resistente mot tetracyklin samt mot nalidixinsyre og ciprofloxacin. For alle disse var andelen resistente isolater høyere for C. coli enn for C. jejuni. En relativt stor andel av C. coli isolatene var resistente mot erytromycin.
Norsk Overvåkingssystem for Antibiotikaresistens hos Mikrober (NORM) ble etablert på bakgrunn av økende antibiotikaresistens i mange land. Enkelttilfeller av meticillinresistente S. aureus (MRSA), pneumokokker med nedsatt følsomhet for penicillin (PNSP), Enterobacteriaceae med utvidet β-laktamaseproduksjon (ESBL), vankomycinresistente enterokokker (VRE) og
multiresistente Mycobacterium tuberculosis har også blitt rapportert fra Norge. Den foreliggende rapport dokumenterer imidlertid at antibiotikaresistens fortsatt var et begrenset problem i norsk helsevesen i år 2000. Kun ett enkelt MRSA-isolat ble påvist blant 158 S. aureus blodkulturisolater. Fire av 127 Klebsiella spp. blodkulturisolater produserte ESBL (3.2%), ingen av 168
E. coli blodkulturisolater hadde denne fenotypen. 2.6% av 340 pneumokkisolater fra luftvegsprøver ble kategorisert som intermediært følsomme for penicillin G, men alle disse isolatene hadde MIC-verdier (minste hemmende konsentrasjon) på 0.125 mg/L som er det laveste trinn i den ikke-følsomme kategorien. Blant 167 pneumokokk-isolater fra blodkulturer ble det påvist to stammer som ikke var fullt følsomme for penicillin G. Disse isolatene hadde MIC-verdier på henholdsvis 1 og 2 mg/L. Alle pneumokokkisolater fra blodkulturer ble kategorisert som følsomme for cefotaxim, det klinisk mest brukte cefalosporinet ved mistanke om systemisk pneumokokk- infeksjon. Det ble ikke funnet noen tilfeller av VRE. Som tidligere rapportert gjennom Meldesystemet for infeksjonssykdommer (MSIS) og Det norske tuberkuloseregisteret ble det i år 2000 påvist tre tilfeller av multiresistent M. tuberculosis blant 160 isolater (1.9%) fra pasienter som ikke tidligere er blitt behandlet for tuberkulose (MSIS rapport 2001. 29:18-19). Multiresistens er i denne sammenheng definert som resistens mot minst rifampicin og isoniazid.
I tillegg til effektiv overvåkning av disse spesielt viktige resistensfenomenene inneholder NORM 2000 detaljert informasjon om mange av de vanligst brukte antibiotika i Norge og de vanligste humanpatogene bakterier i daglig klinisk praksis. Majoriteten av S. aureus blodkultur-isolater produserer β-laktamase (74.5% av 158) mens kun 7.4% av 355 H. influenzae luftvegsisolater har denne egenskapen. Det er fortsatt høy grad av følsomhet for aminoglykosider blant Enterobacteriaceae (98.8% i E. coli og 99.2% i Klebsiella spp. blodkulturisolater), men 7.4% høygradig gentamicinresistens blant 121
Enterococcus spp. blodkulturisolater gir grunn til bekymring. 12.4% av enterokokkisolatene har nedsatt følsomhet for ampicillin. Man har grunn til å frykte at nedsatt ampicillinfølsomhet hos enterokokker kan bli et utbredt problem i norsk helsevesen slik det allerede har vist seg å være ved enkelte sykehus. Det høye nivået av nedsatt følsomhet for ampicillin og cefuroxim hos E. coli
(98.2% nedsatt følsomhet for eller resistens mot ampicillin og 94.7% nedsatt følsomhet for eller resistens mot cefuroxim) og Klebsiella spp. (99.2% nedsatt følsomhet for eller resistens mot ampicillin og 82.6% nedsatt følsomhet for eller resistens mot cefuroxim) må sees i sammenheng med brytningspunktene som er definert av Den norske arbeidsgruppen for antibiotikaspørsmål (AFA). Det samme kan være tilfelle for makrolid-resistens i H. influenzae (18.9% nedsatt følsomhet for, og 78.3% resistens mot erytromycin blant 355 luftvegs-isolater), mens utviklingen av erytromycinresistens hos S. pneumoniae (2.4% i blodkulturisolater og 2.1% i luftvegsisolater) bør følges nøye. Makrolidresistens i Streptococcus pyogenes ble ikke undersøkt i NORM 2000, men vil bli inkludert i overvåkningsprogrammet på et senere tidspunkt. En annen resistensmekanisme som bør være gjenstand for
spesiell oppmerksomhet er forekomsten av fluorokinolonresistens i E. coli og Klebsiella spp. Problemet var fortsatt begrenset i NORM 2000 (henholdsvis 4.2% og 7.1% nedsatt følsomhet for ciprofloxacin i E. coli og Klebsiella spp. blodkultur-isolater), men forekomsten av høygradig nalidixinsyre-resistens i urinvegsisolater (3.2% blant 729 E. coli og 1.7% blant 58 Klebsiella spp.) antyder et potensiale for videre utvikling av kinolonresistens. Når man vurderer resultatene fra undersøkelsen av urinvegsisolater er det viktig å huske på at de fleste isolatene kommer fra forholdsvis banale infeksjoner. Flertallet av pasienter er trolig blitt empirisk behandlet med førstelinje-preparater, og forekomsten av resistens er derfor sannsynligvis ikke representativ for bakteriepopulasjon ved nydiagnostisert urinvegsinfeksjon.
Det er antagelig mange årsaker til den lave forekomsten av antibiotikaresistens i Norge, men totalforbruket av antibiotika og fordelingen av forbruk mellom ulike antibiotikagrupper så vel i sykehus som i allmenn-medisinen er utvilsomt en viktig faktor. Totalforbruket av antibiotika til systemisk bruk (ATC gruppe J01) hos mennesker var 16.3 DDD/1000 innbyggere/dag hvilket er sammenlignbart med nivået i resten av Skandinavia, men lavt i forhold til mange andre europeiske land (Cars
et al., Lancet 2001;1851-53) (DDD=definerte døgn-doser). Salget av antibiotika har vært forholdsvis stabilt gjennom mange år. Det høyeste totalsalget av antibiotika ble registrert i 1993 med 17.8 DDD/1000 innbyggere/ dag, siden da har salget sunket jevnt. I år 2000 ble det påvist en svak reduksjon på 1% målt i DDD. Penicillinene (ATC gruppe J01C) utgjorde 43% av totalforbruket. De β-laktamase følsomme penicillinene (J01CE) og de bredspektrede penicillinene (J01CA) utgjorde henholdsvis 28.6% og 12.4% av totalsalget. Salget av penicilliner har vært stabilt over de siste 5 år. Det har imidlertid vært en endring i forbruket fra β -laktamase følsomme penicillinene (fra 31% J01CE i 1995 til 28% i 2000) til bredspektrede penicilliner (henholdsvis 10 og 12%). Tetracykliner utgjorde 19% av totalforbruket, salget har sunket med 34% siden 1993. Makrolidene (J01FA) utgjorde 9% av totalforbruket.
Methenamine, som brukes til profylakse mot urinvegsinfeksjoner, utgjorde 12% av totalforbruket; salget har økt med 50% siden 1995. Salget av cefalosporiner er begrenset (3% av totalforbruket) men har økt jevnt over de siste år. Salget av makrolider og aminoglykosider har vært stabilt, mens salget av sulfonamider og trimetoprim har sunket med 34% siden 1995. Salget av disse stoffene utgjorde 7% av totalforbruket i år 2000. Det har vært en svak men jevn stigning i forbruket av fluorokinoloner. Forbruket utgjør fortsatt kun 2% av totalforbruket, men økningen har vært på hele 35% siden 1995.
Den lave forekomsten av antibiotikaresistens vist for år 2000 må ikke føre til selvtilfredshet. Årsakene til antibiotikaresistens er fortsatt kun delvis avdekket, og det gjenstår mye arbeid med hensyn til å definere en forsvarlig antibiotikapolitikk. Mange mikrobearter er enda ikke inkludert i NORM/NORM-VET og bør undersøkes nærmere i kommende år. Nye antimikrobielle midler blir regelmessig introdusert på markedet, og mulig resistensutvikling mot disse stoffene bør overvåkes nøye. For å bevare den gunstige situasjonen vi for øyeblikket har i Norge, må alle deler av samfunnet bidra slik det er beskrevet i ”Regjeringens tiltakssplan for å motvirke antibiotikaresistens (2000-2004)”. NORM og NORM-VET har viktige roller å spille i både overvåkning og forebyggelse av antibiotikaresistens. Utdanning og økt bevissthet omkring resistensproblemer vil føre til at kvaliteten i det diagnostiske arbeidet blir hevet på mange laboratorier. Standardisering av lokale resistensdata muliggjør sammenlikning av resultatene mellom ulike sykehus og regioner. Data innsamlet i NORM kan brukes lokalt slik at spesifikke tiltak kan settes i verk før resistensproblemer kommer ut av kontroll. På det nasjonale plan bør resultatene fra NORM/NORM-VET brukes når brytningspunkter for følsomhet og resistens skal defineres og retningslinjer for antibiotikabruk skal utformes. Den foreliggende rapport er derfor kun et utgangspunkt i det videre arbeidet for å forebygge og motvirke utvikling og spredning av antibiotikaresistens.
II.
SUMMARY
The use of antimicrobial agents in animals in Norway islow compared to many other industrialized countries, and the consumption pattern is rather favourable. The total sale of veterinary antibacterial drugs approved in Norway for therapeutic use in animals was 5 750 kg in 2000, a 39% decrease since 1995. The proportion of penicillins of the total use increased from 36% in 1995 to 44% in 2000. In the same period, the proportion accounted for by aminoglycosides decreased from 27% to 20 %. In 2000, penicillins represented the most frequently used drugs, followed by sulfonamides (27%), aminoglycosides (20%), tetracyclines (3%), trimethoprim and derivatives (3%), and others (4%). The total sale in Norway of veterinary antibacterial drugs for therapeutic use in farmed fish was 685 kg active substance in 2000, of which quinolones accounted for 76%. During the past 13 years, the total use of antibacterial drugs in farmed fish has decreased by 99%. In the same period, the total production has increased manifold. This decrease in antibacterial consumption is mainly attributed to the introduction of effective vaccines, although improved management and husbandry in aquaculture also play a role.
Antibacterial growth promoters are no longer used in Norwegian animal production. Avoparcin was banned in 1995 and virginiamycin in 1998. Bacitracin has not been banned, but is no longer in use as a growth promoter. The annual consumption of coccidiostats has remained stable through the past six years. Since 1996, narasin has been the most commonly used coccidiostat, and the sale of the other substances in this group has been decreasing. The relatively favourable situation with regard to usage of antimicrobials in Norwegian animal food production is reflected in a moderate occurrence of antimicrobial resistance among bacteria from Norwegian animals and animal products.
Antimicrobial susceptibility testing of E. coli from commercially available meat by-products intended for canine consumption revealed some resistance. Resistance to streptomycin, tetracycline, sulphonamides and ampicillin, respectively, were most common. No reduced susceptibility to quinolones was observed.
The occurrence of resistance among Staphylococcus aureus from clinical and subclinical mastitis in cows remained quite low. However, the occurrence was relatively higher among isolates from subclinical mastitis as compared to those from clinical mastitis. The resistance frequencies for the various antimicrobials reflect the usage; penicillin, streptomycin, and sulfonamides/trimethoprim being commonly used for clinical purposes. Resistance in coagulase negative staphylococci from mastitis in cows was considerably more abundant as compared to S. aureus isolates.
S. intermedius from skin infections in dogs were frequently resistant to sulfonamides, penicillin, fucidic acid, and tetracycline. Also, a considerable proportion of the isolates were resistant to erythromycin, spiramycin, clindamycin, and streptomycin, respectively. Resistance to trimethoprim/sulfonamides has remained very low, whereas resistance to cephalosporins as well as to
fluoroquinolones has remained negligible. Staphylococci from ear infections tend to be more frequently resistant than staphylococci from other skin infections.
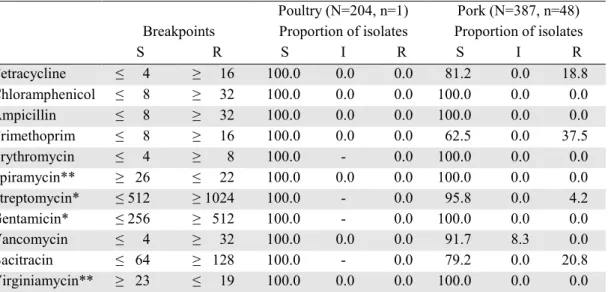
A total of 36% of E. coli from poultry meat were classified as resistant to one or more of the antimicrobials included; 16% to one, 11% to two, and 9% to three or more antimicrobials. Resistance to sulfonamides was most common, followed by resistance to streptomycin, tetracycline, ampicillin, trimethoprim, and nalidixic acid. A total of 64% of the enterococci from poultry meat were classified as resistant to one or more of the antimicrobials included. In total, 38% of the isolates were resistant to only one antimicrobial, 22% to two, and 4% to three or more antimicrobials. Resistance to bacitracin was most common, followed by resistance to tetracycline, erythromycin, spiramycin, vancomycin, and streptomycin (high-level). There is some use of tetracycline for clinical purposes in Norwegian poultry production.
A total of 25% of E. coli from pork were classified as resistant to one or more of the antimicrobials included; 5% to one, 7% to two, and 12% to three or more antimicrobials. Resistance to streptomycin was most common, followed by resistance to sulfonamides, tetracycline, trimethoprim, and ampicillin - all these antimicrobials being commonly used for clinical purposes in swine production. Some resistance to chloramphenicol, kanamycin, and gentamicin was also observed. A total of 36% of the enterococci from pork meat were classified as resistant to one or more of the antimicrobials included. In total, 24% of the isolates were resistant to only one antimicrobial, 9% to two, and 2% to three or more antimicrobials. Resistance to tetracycline was most common, followed by resistance to bacitracin, trimethoprim, streptomycin (high-level), erythromycin, spiramycin, chloramphenicol, and gentamicin.
The results from the susceptibility testing of indicator bacteria from pork and poultry meat were in accordance with results from similar surveys of Norwegian poultry and pork in 1998.The results show that faecal indicator bacteria from pork and poultry meat of Norwegian origin may be resistant to various kinds of antimicrobials. In general, resistance was most commonly observed to the antimicrobials most commonly used in the respective productions. Thus, there appears to be an association between the use of antimicrobials in animal production and the occurrence of resistance to the same antimicrobials among bacteria from related food products.
Among S. aureus isolates from bulk milk tank samples from dairy cows and goats some resistance to penicillin and streptomycin was detected. The prevalence of resistance to the various antimicrobials is in accordance with what was found for S. aureus isolates from clinical mastitis in cows.
All nine isolates of Salmonella from animal feeds and all 14 isolates of S. Typhimurium from Norwegian animals were susceptible to all antimicrobials included. No S.
Enteritidis was isolated from animal feed or animals. Out of the 22 isolates of Salmonella other than S. Typhimurium from animals, two were multiresistant, both isolated from seagulls. Two of the S. Typhimurium isolates from imported food, one from Belgian pork and one from French turkey, were identified as multiresistant
S. Typhimurium DT104. The isolate from turkey was also resistant to nalidixic acid and intermediately susceptible to ciprofloxacin. The other Salmonella
isolates from food were susceptible to most antimicrobials included, except for a relatively high proportion showing reduced susceptibility to tetracycline and/or chloramphenicol.
With regard to Salmonella isolates from humans, the occurrence of resistance among S. Enteritidis was moderate as compared to S. Typhimurium and “Salmonella other than S. Enteritidis and S.
Typhimurium”. Unfortunately, the resistance frequencies reported are not stratified on domestically acquired and imported cases. Among the S. Enteritidis isolates, some resistance to tetracycline, chloramphenicol, ampicillin, and trimethoprim/sulfonamides, respectively, was observed, as well as a relatively high occurrence of resistance to nalidixic acid. Among the other salmonella isolates, a high occurrence of resistance to chloramphenicol, tetracycline, and ampicillin, and to a somewhat lesser degree, to nalidixic acid and trimethoprim/sulfonamides, was observed. In total, 33% of the S. Typhimurium isolates were identified as multiresistant DT104, 80% of these from imported cases. Of the multiresistant DT104 isolates, 6% were also resistant to nalidixic acid.
The occurrence of resistance among human isolates of
Shigella spp. was relatively high. A considerable proportion of the isolates were resistant to tetracycline, trimethoprim/sulfonamides, chloramphenicol, ampicillin, and nalidixic acid, respectively. In general, the proportion of Salmonella and Shigella isolates being resistant to ciprofloxacin was low. However, a considerable proportion expressed intermediate susceptibility to ciprofloxacin, and many of these were also resistant to nalidixic acid.
Some resistance to chloramphenicol was observed among human isolates of Yersinia enterocolitica. One isolate was resistant to nalidixic acid, whereas 13% were classified as intermediately susceptible to ciprofloxacin. The Campylobacter jejuni and C. upsaliensis isolates from cats and dogs were in general susceptible to the antimicrobials included, except that 90% of the C. upsaliensis and 5% of the C. jejuni isolates expressed resistance to streptomycin. One C. upsaliensis isolate from a dog was resistant to nalidixic acid and intermediately susceptible to ciprofloxacin. The
Campylobacter spp. isolates from poultry meat were in general susceptible to the antimicrobials included except for one that was resistant to nalidixic acid and gentamicin. A considerable proportion of the
Campylobacter spp. isolates from human patients were resistant to tetracycline and to the quinolones nalidixic acid and ciprofloxacin, respectively, the proportion being higher for C. coli as compared to C. jejuni isolates. The proportion of isolates that were resistant to erythromycin was relatively high for C. coli isolates.
The NORM surveillance program was established in response to reports from other countries where antimicrobial resistance among human pathogens is now commonplace. Methicillin resistant S. aureus (MRSA), penicillin non-susceptible pneumococci (PNSP), Enterobacteriaceae containing extended spectrum β -lactamases (ESBL), vancomycin resistant enterococci (VRE) and multiresistant Mycobacterium tuberculosis
have also occasionally been reported from Norway. However, the present report documents that antimicrobial resistance was still a limited problem in Norwegian hospitals and general practice in the year 2000. Only a single MRSA isolate was detected among 158 blood culture isolates included in the program. Four out of 127 Klebsiella spp. blood culture isolates were ESBL producers (3.2%), none of 168 E. coli blood culture isolates displayed this phenotype. 2.6% of 340 respiratory tract pneumococcal isolates were categorized as intermediately susceptible to penicillin G, but these isolates all had MIC (minimal inhibitory concentrations) values of 0.125 mg/L which is the lowest level of non-susceptibility. Among the 167 pneumococcal blood culture isolates, two isolates were non-susceptible to penicillin G with MIC values of 1 and 2 mg/L, respectively. All pneumococcal blood culture isolates were categorized as susceptible to the 3rd generation cephalosporin cefotaxime. No VRE were detected. As previously reported through the Norwegian Surveillance System for Communicable Diseases (MSIS) and the Norwegian Tuberculosis Register, in the year 2000, only three of 160 (1.9%) M. tuberculosis isolates from patients not previously treated for tuberculosis were multiresistant when defined as resistant to at least rifampicin and isoniazid (MSIS rapport 2001. 29: 18-19). In addition to efficient surveillance of these prime examples of antimicrobial resistance problem pheno-types, NORM 2000 provides detailed information about many of the most commonly used antibiotics used in Norway and many of the most important human pathogens seen in daily clinical practice. The majority of
S. aureus blood cultures isolates produced β-lactamases (74.5% of 158), whereas this capacity was only detected in 7.1% of 355 H. influenzae respiratory tract isolates. The susceptibility to aminoglycosides was still very high among Enterobacteriaceae (98.8% in E. coli and 99.2% in Klebsiella spp. blood culture isolates), but the 7.4% of 121 Enterococcus spp. blood culture isolates with high-level resistance to gentamicin gives reason for concern. 12.4% non-susceptibility to ampicillin among these enterococcal isolates may also indicate future problems as have already been experienced in some Norwegian hospitals. The high levels of non-susceptibility to ampicillin and cefuroxime in E. coli (98.2% non-susceptibility to ampicillin and 94.7% non-non-susceptibility to cefuroxime) and Klebsiella spp. (99.2% non-susceptibility to ampicillin and 82.6% non-non-susceptibility to cefuroxime) must be interpreted in context with the breakpoints defined by the Norwegian Reference Group on Antibiotic Susceptibility Testing (AFA). The same may be true for macrolide resistance in H. influenzae
(18.9% intermediately susceptible and 78.3% resistant to erythromycin among 355 respiratory tract isolates), while the occurrence of erythromycin resistance in S.
pneumoniae gives reason for concern (2.4% in blood culture isolates and 2.1% in respiratory tract isolates). Macrolide resistance in Streptococcus pyogenes was not monitored in NORM 2000 but will be included in the program on a later date. Another resistance mechanism that deserves further attention is the level of fluoroquinolone resistance in E. coli and Klebsiella spp. The problem was still limited in NORM 2000 (4.2% and 7.1% non-susceptiblity to ciprofloxacin among blood culture isolates of E. coli and Klebsiella spp., respectively), but the occurrence of high-level resistance to nalidixic acid in urinary tract isolates (3.2% among 729 E. coli and 1.7% among 58 Klebsiella spp. isolates) indicates a potential for further development of quinolone resistance. When reading the resistance data on urinary tract pathogens, the reader should keep in mind that most of these isolates originate from infections of limited severity. The majority of patients have presumably been empirically treated with first-line antibiotics, and the rates of resistance are therefore probably not representative for pathogens in newly diagnosed urinary tract infections.
There are probably many reasons for the low level of antimicrobial resistance in Norway, but the level and profile of antimicrobial consumption in both hospitals and general practice is undoubtedly an important factor. The overall consumption of antibacterials for systemic use (ATC group J01) in humans was 16.3 DDD/1000 inhabitants/day, which is comparable to the level in the rest of Scandinavia, but lower than in many other European countries (Cars et al., Lancet 2001:1851-53) (DDD=Defined Daily Doses). Sales of antibacterials have remained relatively unchanged for many years. The highest total sale of antibacterials ever was registered in 1993 with 17.8 DDD/1000 inhabitants/day. Since then the sales have been decreasing. In 2000, a small decrease of 1% measured in DDDs was seen. The penicillins (ATC group J01C) represented 43% of the total antimicrobial use. The β-lactamase sensitive penicillins (J01CE) and penicillins with extended spectrum (J01CA) represented 28.6% and 12.4%, respectively. The sales of penicillins have been stable over the past 5 years. There has, however, been a change in use from the β-lactamase sensitive penicillins (31% of J01 in 1995 to 28% in 2000) to penicillins with extended spectrum (10% and
12% respectively). Tetracyclines represented 19% of total use. The sales have decreased by 34% since 1993. The macrolides (J01FA) represented 9% of the total use. The urinary prophylactic agent methenamine represented 12% of total use; the sales have increased by 50% since 1995. The sales of cephalosporins, although limited, have also increased over the years and represented 3% of the total antibacterials in the year 2000. The sales of the macrolides and aminoglycosides are stable, but the sales of sulfonamides and trimethoprim have decreased by 34% since 1995. The sales equal 7% of total sales in 2000. There has been a small, but stable increase in quinolone use over the years. It represented only a minor fraction (2%) of the antibacterials, but the increase has been 35% since 1995.
The low level of antimicrobial resistance revealed in 2000 should not lead to complacency. The causes of antimicrobial resistance are not fully understood, and much work remains to be done in order to define prudent antimicrobial practices. Many bacterial species have not yet been included in NORM/NORM-VET and will need closer attention in the years to come. New antimicrobials are regularly introduced, and possible development of resistance to these compounds should be closely monitored. In order to preserve the favourable situation we presently have in Norway, all parts of society must participate as described in the Plan of Action to Combat Resistance to Antibiotics (2000–2004) (Royal Ministry of Health and Social Affairs, March 7th 2000). NORM and NORM-VET have important roles to play, not only in surveillance, but also in the prevention of anti-microbial resistance. Education and increased awareness of antimicrobial resistance will improve the quality of diagnostic procedures in many laboratories, and standardization of local resistance data will enhance comparability between regions and hospitals. Data generated in NORM can be used locally to specifically target challenges before the situation gets out of control. On the national level, results from NORM and NORM-VET should be used when susceptibility breakpoints are defined and antibiotic guidelines are issued. The present report is therefore only a starting point for further efforts to prevent and contain antimicrobial resistance.
III. INTRODUCTION
Antimicrobial resistance is an increasing problemworldwide. It affects the treatment of infectious diseases in both humans and animals resulting in increased morbidity and mortality, as well as increased costs. It is well established that there is an association between the usage of antimicrobial agents and the occurrence of resistance. The selective pressure of antimicrobial usage is a key issue in the epidemiology of resistance. Moreover, resistance can be disseminated through the spread of resistant pathogenic bacteria themselves or by horizontal transfer of resistance genes from one type of bacteria to another. Such transfer is not limited to closely related bacteria; it can also take place between bacteria of different evolutionary and/or ecological origin. Antimicrobial usage and resistance in one compartment can thus have consequences for the occurrence of resistance in another compartment. When addressing antimicrobial resistance – the occurrences, causes, consequences, and preventive measures – one must therefore take a holistic view encompassing both usage and resistance in human and veterinary medicine, as well as in the food production sector.
In recent years, several countries have implemented surveillance programs for antimicrobial resistance and antimicrobial usage. Many programs focus primarily on human consumption and resistance, but some countries also include data concerning veterinary medicine and food production. This broad approach was supported by the EU in 1998 through the Copenhagen declaration and more recently at the conference in Visby, Sweden 2001. The WHO has published similar guidelines. In response to the growing concern about antimicrobial resistance, the Norwegian Ministry of Health and Social Affairs issued a national action plan against antimicrobial resistance (2000–2004) in March 2000. Again, the importance of monitoring both the human and veterinary sector, including food production, was emphasized. A
surveillance program for antimicrobial resistance in human pathogens was established in Norway in 1999 – NORM. Ten medical microbiological laboratories participated in the year 2000, and the program is coordinated by the Microbiological Department at the University Hospital of Tromsø. A continuous monitoring program for antimicrobial resistance in the veterinary and food sector was established in 2000 – NORM-VET. NORM-VET is coordinated by the Norwegian Zoonosis Centre in Oslo. A detailed surveillance system for all drug prescription in Norway including antimicrobials is presently being discussed.
This report presents the results from NORM and NORM-VET for the year 2000. In addition, data on the consumption of antimicrobial agents in humans and animals in Norway are presented. The data will serve as a basis for the interpretation and evaluation of trends in antimicrobial usage and the occurrence of resistance in Norway in the future. The results from this report may not be directly comparable to results from monitoring programs in other countries due to differences in sampling schemes, methodology, and breakpoints for resistance and susceptibility. However, the extensive use of MICs (minimal inhibitory concentrations) and other continuous parameters of resistance will ensure comparability with similarly structured surveillance programs. Standardization of sampling schemes and microbiological methods ensure that repeated investigations can demonstrate changes in resistance levels and patterns and how these changes may be related to usage of antimicrobials. The data from NORM/ NORM-VET 2000 should therefore form a basis for further efforts to prevent and combat antimicrobial resistance.
The editors would like to thank all those who contributed to data collection and writing of this report.
IV. DEMOGRAPHIC DATA
To facilitate comparison of Norwegian data onconsumption of antimicrobial agents and occurrence of resistance with corresponding figures from other countries, basic demographical data concerning both
human and animal populations are presented. The data are collected by Norwegian authorities as indicated for each table.
TABLE 1. Human population in Norway as of January 1s t, 2000. Data provided by Statistics Norway.
Age group All Males Females
0 to 4 years 302 387 155 258 147 129
5 to 14 years 592 330 304 038 288 292
15 to 24 years 544 122 277 343 266 779
25 to 44 years 1 330 900 678 497 652 403
45 to 64 years 1 025 726 518 169 507 557
65 years and older 683 032 283 835 399 197
All age groups 4 478 497 2 217 140 2 261 357
TABLE 2. Livestock population in Norway as of January 1s t, 2000. Data provided by Statistics Norway.
Animal category Animals Herds
Cattle, total 1 018 700 29 400
Dairy cows (incl. in above total) 318 000 22 400
Goats, total 71 200 1 400
Dairy goats (incl. in above total) 53 100 700
Sheep, winterfed 1 081 400 21 600
Swine, total 654 000 4 500
Swine, breeding animals > 6 months 93 800 3 400 Egg laying hens (>20 weeks of age) 3 216 800 3 800
Broilers 480
Turkeys 100
Ducks and geese 100
TABLE 3. Number of animals slaughtered in 2000*. Data provided by The Norwegian Food Control Authority (terrestrial animals) and Directorate of Fisheries (fish).
Animal category Slaughtered animals
Horse 2 300 Cattle 381 300 Goats 21 400 Sheep 1 158 600 Swine 1 366 800 Poultry 39 915 800 Ostrich 300 Reindeer 26 300 Farmed salmon** 432 666 Farmed trout** 45 953
* Rounded to nearest hundred ** Amount in 1 000 kg, ungutted fish
V.
CONSUMPTION OF ANTIMICROBIAL AGENTS
A.
ANIMAL CONSUMPTION
Antibacterial growth promoters and coccidiostats
Data on the usage of the different substances and categories of feed additives was obtained from the Norwegian Agricultural Inspection Service. Table 4 summarizes the total sales of antibacterial growth promoters and coccidiostats in Norway for the period 1994-2000.In 1995, the glycopeptide avoparcin that had been on the Norwegian market since 1986 as a growth promoter in poultry production was prohibited because an association between the use of this antibacterial feed additive and the occurrence of vancomycin resistant enterococci in animal husbandry was reported. The same year the Norwegian food animal production industries voluntarily abandoned the use of all antibacterial growth promoters. Since then, there has been almost no use of antibacterial
growth promoters in Norwegian food animal production. In 1998, the streptogramin virginiamycin was officially prohibited due to reports from other countries of an association between the use of this drug and the occurrence of enterococci being resistant to quinupristin-dalfopristin, a combination of streptogramins used in human medicine.
Coccidiostats, however, are still being used in Norwegian poultry production. The total sales, in kg active substance, are at the same level as before the ban of the antibacterial growth promoters was implemented. However, the pattern of use has changed. Narasin has since 1996 dominated the use of coccidiostats, whereas the use of other ionophores has decreased correspondingly.
TABLE 4. Total sales of antibacterial growth promoters and coccidiostats in Norway 1994-2000. Total sales in kg active substance Compound
1994 1995 1996 1997 1998 1999 2000
Avoparcin 982 419* Prohibited Prohibited Prohibited Prohibited Prohibited
Zincbacitracin 234 129 64 27 0 0 0
Virginiamycin 0 0 0 0 0* Prohibited Prohibited
Total antibacterial growth promoters 1 216 548 64 27 0 0 0
Lasalocid 3 896 996 480 471 193 208 80
Monensin 844 3 422 891 561 485 557 776
Salinomycin 482 214 27 0 0 27 233
Narasin 0 24 3 508 3 343 3 530 4 062 4 486
Total ionophore coccidiostats 5 222 4 656 4 906 4 375 4 208 4 854 5 575
Amprolium/etopabat 165 156 116 582 174 201 135
Total other coccidiostats 165 156 116 582 174 201 135
* Prohibited part of the year
Usage of veterinary antibacterial drugs for therapeutic use
Data on sales of antibacterial drugs were collected fromall the Norwegian drug wholesalers. Although this report primarily presents resistance data for 2000, trends in the prescribing patterns of veterinary antibacterial drugs for the period 1995-2000 are included to show the preceding antibacterial load in the domestic animal population and in Norwegian fish farming.
The majority of the agents included in this report are approved as pharmaceutical formulations both for food producing animals, horses, and/or dogs and cats. Therefore, the sales figures presented represent overall sales data of veterinary antibacterial drugs.
Table 5 summarizes the amount of veterinary anti-bacterial drugs approved for therapeutic use in domestic animals in Norway delivered by wholesalers in 2000. They are presented according to the main groups of
antibacterial agents, and show the usage for the various routes of administration. The total usage for each group of substance is given in Figure 1, while Figure 2 illustrates the proportion of the total sale for the various main groups of antibacterial substances. Both figures present annual sales data for the period 1995-2000. The total sales of veterinary antibacterial agents approved for therapeutic use in animals in 2000 was 5750 kg active substance, a 39% decrease since 1995. The proportion of penicillins used increased from 36% in 1995 to 44% in 2000. The relative amount of amino-glycosides decreased from 27% to 20% in the same time period,. In 2000, penicillins were the most frequently used drugs (44%), followed by sulfonamides (27%), aminoglycosides (20%), tetracyclines (3%), trimetho-prim and derivatives (3%), and others (4%).
In Norway, medicated feeds and premix for farmed fish are approved by the drug authorities and classified as pharmaceutical formulations. Sales figures, in kg active substance, of such products and premixes containing antibacterial drugs are presented in Table 6. In 2000, the total sale of veterinary antibacterial drugs in Norway for therapeutic use in farmed fish was 685 kg. Quinolones
accounting for 76% of the use. The annual use of antibacterial drugs declined by 99% during the period 1987-2000. In the same period, the total production of farmed fish increased manifold. This decrease in the use of antibacterial drugs is mainly attributed to the introduction of effective vaccines and improved environmental conditions in aquaculture.
TABLE 5. Sales (in kilograms of active substance) in 2000 of veterinary antibacterial drugs approved in Norway for therapeutic use in animals, fish not included. Data were obtained from the Norwegian drug wholesalers.
Groups of substances ATCvet code Active substance or combinations of substances Gastro-intestinal (QA07) Uterine (QG01) Systemic individual (QJ01) Systemic herds (QJ01) Intra-mammary (QJ51)
Tetracyclines QG01AA07 Oxytetracycline 3
QJ01AA02 Doxycycline <0.1
QJ01AA06 Oxytetracycline 82 81
β-lactam QJ01CA01 Ampicillin 20
antibacterials QJ01CA04 Amoxycillin 53 54
QJ01CE09 Phenoxymethylpenicillin < 0.1
QJ01CE09 Procaine penicillin* 1 896
QJ01CE90/
QJ51CE90 Penethamate hydroiodide* 15 6
QJ01CR02/
QJ51RV01 Amoxicillin+clavulanic acid 89 6
QJ51CA51 Ampicillin + cloxacillin 2
Sulfonamides QJ01EQ03 Sulfadimidine + baquiloprim 0.2
and trimethoprim or QJ01EQ09 Sulfadimetoxine + baquiloprim 1
baquiloprim QJ01EQ10 Sulfadiazine + trimethoprim 902
QJ01EQ13 Sulfadoxine + trimethoprim 123
QJ01EQ15 Sulfamethoxypyridazine 485
Lincosamides QJ01FF02 Lincomycin 8
Aminoglycosides QA07AA01 Neomycin 35
QA07AA90 Dihydrostreptomycin (DHS) 162
Quinolones QJ01MA90 Enrofloxacin 17
Others antibacterials QJ01XX92 Tiamulin 6 171
Combinations of
antibacterials QG01AE99
Sulfadimidine + procaine
penicillin* + DHS 227
QJ01RA01 Procaine penicillin* + DHS 645
QJ01RA01 Spiramycin+metronidazole 6
QJ51RC23 Procaine penicillin* + DHS 604
QJ51RC25 Penethamate hyd.* + DHS 51
Total per route of administration: 197 230 4 348 306 669
Total: 5 750 *Calculated as benzylpenicillin
Table 6. Total sales (in kilograms of active substance) for the period 1995-2000 of veterinary antibacterial drugs for therapeutic use in farmed fish in Norway. Data were obtained from Norwegian wholesalers and feed mills.
Groups of substances ATCvet code Active substance 1995 1996 1997 1998 1999 2000
Tetracyclines QJ01AA06 Oxytetracycline 70 27 42 55 25 15
Amphenicols QJ01BA90 Florfenicol 64 64 123 135 65 148
Antibacterial quinolones QJ01MB07 Flumequine 182 105 74 53 7 52
QJ01MB91 Oxolinic acid 2 800 841 507 436 494 470
0 2000 4000 6000 8000 10000 19 95 1996 1997 1998 1999 2000 K g ac tive s ub st ance
Others
Aminoglycosides
Sulfonamides
Trimethoprim and
derivat.
Penicillins
FIGURE 1. Sales (in kg active substance) in 1995–2000 of veterinary antibacterial drugs (QA07AA; QG01AA; QG01AE; QJ01; QJ51) for therapeutic use in Norway, fish not included. (Others: Macrolides, lincosamides, quinolones, and imidazoles). 0,0 % 10,0 % 20,0 % 30,0 % 40,0 % 50,0 % 1995 1996 1997 1998 1999 2000
Others
Aminoglycosides
Sulfonamides
Trimethoprim and derivat.
Penicillins
Tetracyclines
FIGURE 2. Sales (as percentage of total sales) for the period 1995–2000 of veterinary antibacterial drugs (QA07AA; QG01AA; QG01AE; QJ01; QJ51) in Norway, fish not included (Others: Macrolides, lincosamides, quinolones, and imidazoles).
Others
Aminoglycosides Sulfonamides
Trimethoprim and derivatives Penicillins
Tetracyclines Others
Aminoglycosides Sulfonamides
Trimethoprim and derivatives Penicillins
B.
HUMAN CONSUMPTION
In 2000, the overall consumption of antibacterials for systemic use (ATC group J01) in humans represented 16.3 DDD/1000 inhab./day. Sales of antibacterials have remained relatively unchanged for many years. The
highest total sale of antibacterials ever was registered in 1993; 17.8 DDD/1000 inhabitant/day. Since then the sale has been decreasing. In 2000, a small decrease of 1% measured in DDDs was seen.
TABLE 7. Human consumption of antibacterial agents in Norway 1995-2000 by ATC groups. The consumption is presented as Defined Daily Doses (DDD)/inhabitants/day and % change 1995-2000. Collection of data on human consumption of antimicrobial agents is presented in Appendix 2.
ATC Groups of substances 1995 1996 1997 1998 1999 2000 Change (%)
1995-2000
J01AA Tetracyclines 4.14 3.66 3.55 3.37 3.19 3.17 - 23.4
J01BA Amphenicols 0.01 0.005 0.01 0.00 0.01 0.00
J01CA Penicillins with extended spectrum 1.72 1.733 1.87 1.90 1.96 2.01 + 17.0 J01CE β-lactamase sensitive penicillins 5.41 5.08 5.32 5.12 5.01 4.66 - 13.8 J01CF β-lactamase resistant penicillins 0.186 0.21 0.24 0.27 0.32 0.35 + 88.2 J01CR Combination of penicillins 0.004 0.01 0.02 0.01 0.01 0.01 + 122.5
J01DA Cephalosporins 0.444 0.435 0.41 0.43 0.46 0.50 + 12.0
J01DF Monobactams 0.00 0.00 0.00 0.00 0.00 0.00
J01DH Carbapenems 0.01 0.006 0.01 0.01 0.01 0.02
J01EA Trimethoprim and derivatives 0.986 0.93 0.90 0.87 0.84 0.79 - 19.9
J01EB Short-acting sulfonamides 0.01 0.001 0.00 0.00 0.00 0.00
J01EC Intermediate-acting sulfonamides 0.001 0.003 0.00 0.00 0.00 J01EE Comb. of sulfonamides and
trimethoprim, incl. derivatives
0.800 0.64 0.55 0.47 0.42 0.38 - 52.5 J01FA Macrolides 1.48 1.404 1.48 1.50 1.48 1.47 - 0.7 J01FF Lincosamides 0.10 0.101 0.10 0.11 0.11 0.12 + 25.8 J01GB Other aminoglycosides 0.05 0.047 0.05 0.05 0.05 0.04 J01MA Fluoroquinolones 0.25 0.259 0.27 0.29 0.32 0.34 + 38.1 J01MB Other quinolones 0.02 0.016 0.01 0.01 0.01 0.01
J01XA Glycopeptide antibacterials 0.01 0.006 0.01 0.01 0.00 0.01
J01XB Polymyxins 0.00 0.002 0.00 0.00 0.00 0.00
J01XC Steroid antibacterials 0.002 0.003 0.00 0.00 0.00 0.00
J01XD Imidazole derivatives 0.054 0.053 0.06 0.06 0.06 0.06 + 16.7
J01XE Nitrofuran derivatives 0.393 0.393 0.38 0.38 0.37 0.37 - 6.4
J01XX Other antibacterials 1.29 1.44 1.61 1.75 1.91 1.95 + 51.1 Total 17.4 16.4 16.8 16.6 16.6 16.3 - 6.3 0 1 2 3 4 5 6 7 8 1973 1976 1979 1982 1985 1988 1991 1994 1997 2000 DDD/ 1000 i nha bi ta nt s/ da y P enic illines (J 01C) T etrac yc lines (J 01A) M ac rolides and linc os am ides (J 01F )
S ulfonam ides and trim ethoprim (J01E)
FIGURE 3. Sales of penicillins (J01C), tetracyclines (J01A), macrolides and lincosamides (J01F), and sulfonamides and trimethoprim (J01E) in Norway 1973-2000.
Penicillins (J01C) Tetracyclines (J01A)
Macrolides and lincosamides (J01F) Sulfonamides and trimethoprim (J01E)
The penicillins (ATC group J01C) represent 43% of the total antimicrobial use. The β-lactamase sensitive penicillins (J01CE) and penicillins with extended spectrum (J01CA) represent 28.6% and 12.4% respectively. The sales of penicillins have been stable over the last 5 years. There has, however, been a shift in use from the β-lactamase-sensitive penicillins (31% of J01 in 1995 to 28% in 2000) to penicillins with extended specter (10% and 12% respectively).
The tetracyclines (J01A) represent 19% of the total use. The sales have been steadily decreasing by 34% since 1993. The macrolides (J01FA) represent 9% of the total use. The urinary prophylactic agent methenamine
represents 12% of total use. The sales have increased by 50% since 1995.
The sales of cephalosporins, although little, have also been increasing over the years and now represent 3% of the total sales of antibacterials. The sales of macrolides and amino-glycosides are stable, but the sales of sulfonamides and trimethoprim are decreasing - by 34% since 1995. The sales equals 7% of total sales in 2000. There has been a small, but stable increase in quinolone use over the years. It represents only a minor fraction (2%) of total antibacterial sales. However, the increase has been 35% since 1995.
FIGURE 4. Relative amount of antibacterial agents for systemic use in 2000 in Defined Daily Doses (DDD). Groups of antibacterials are represented by ATC numbers as follows: J01A tetracyclines, J01C penicillins, J01D cephalosporins, carbepenems and monobactams, J01E sulfonamides and trimethoprim, J01F macrolides and lincosamides, J01M quinolones, and J01X others.
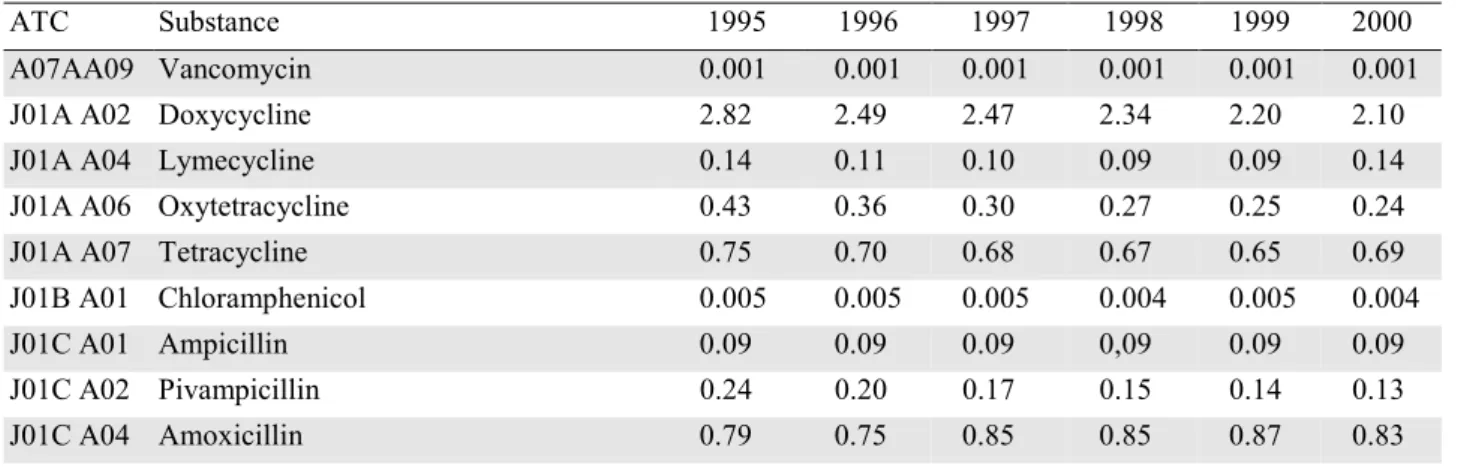
TABLE 8. Human consumption of single antibacterial agents for systemic use in Norway in 2000 (ATC group J01). Sales given in DDD/1000 inhabitants/day. Collection of data on human consumption of antibacterial agents is presented in Appendix 2.
ATC Substance 1995 1996 1997 1998 1999 2000
A07AA09 Vancomycin 0.001 0.001 0.001 0.001 0.001 0.001
J01A A02 Doxycycline 2.82 2.49 2.47 2.34 2.20 2.10
J01A A04 Lymecycline 0.14 0.11 0.10 0.09 0.09 0.14
J01A A06 Oxytetracycline 0.43 0.36 0.30 0.27 0.25 0.24
J01A A07 Tetracycline 0.75 0.70 0.68 0.67 0.65 0.69
J01B A01 Chloramphenicol 0.005 0.005 0.005 0.004 0.005 0.004 J01C A01 Ampicillin 0.09 0.09 0.09 0,09 0.09 0.09 J01C A02 Pivampicillin 0.24 0.20 0.17 0.15 0.14 0.13 J01C A04 Amoxicillin 0.79 0.75 0.85 0.85 0.87 0.83 continued …
J01A
20 %
J01C
43 %
J01D
3 %
J01E
7 %
J01F
10 %
J01X
15 %
J01M
2 %
1995 1996 1997 1998 1999 2000 J01C A08 Pivmecillinam 0.60 0.69 0.75 0.81 0.86 0.96 J01C A09 Azlocillin 0.0001 0.0001 0.0001 J01C A11 Mecillinam 0.002 0.003 0.003 0.003 0.004 0.004 J01C E01 Benzylpenicillin 0.20 0.19 0.19 0.21 0.23 0.21 J01C E02 Phenoxymethylpenicillin 5.21 4.89 5.13 4.91 4.78 4.45 J01C F01 Dicloxacillin 0.08 0.13 0.16 0.19 0.22 0.25 J01C F02 Cloxacillin 0.10 0.08 0.08 0.08 0.10 0.10
J01C R02 Amoxicillin and enzyme inhibitor 0.004 0.01 0.02 0.01 0.01 0.01
J01C R05 Piperacillin and enzyme inhibitor 0.0001
J01D A01 Cefalexin 0.26 0.25 0.22 0.22 0.22 0.26 J01D A03 Cefalotin 0.04 0.04 0.04 0.04 0.05 0.05 J01D A05 Cefoxitin 0.0005 0.0004 0.0004 0.0004 0.0004 0.0004 J01D A06 Cefuroxim 0.11 0.11 0.11 0.12 0.13 0.13 J01D A10 Cefotaxim 0.01 0.01 0.02 0.03 0.04 0.04 J01D A11 Ceftazidim 0.02 0.02 0.01 0.01 0.01 0.01 J01D A13 Ceftriaxone 0.001 0.004 0.007 0.008 0.011
J01D A63 Ceftriaxone, combinations 0.00003 0.0001 0.0001 0.0001
J01D F01 Aztreonam 0.0008 0.0008 0.0007 0.0005 0.0008 0.001
J01D H02 Meropenem 0.002 0.004 0.008 0.012
J01D H51 Imipenem and enzyme inhibitor 0.007 0.006 0.007 0.007 0.006 0.006
J01E A01 Trimethoprim 0.99 0.93 0.90 0.87 0.84 0.79
J01E B02 Sulfamethizole 0.005 0.001 0.0002 0.001 0.002
J01E C20 Sulfonamides, combinations 0.001 0.003 0.003 0.003 0.0004 J01E E01 Sulfamethoxazol and trimethoprim 0.80 0.64 0.55 0.47 0.42 0.38
J01F A01 Erythromycin 1.18 1.03 1.04 1.06 1.01 1.00 J01F A02 Spiramycin 0.09 0.06 0.05 0.04 0.03 0.02 J01F A09 Clarithromycin 0.06 0.17 0.22 0.24 0.26 0.26 J01F A10 Azithromycin 0.14 0.14 0.17 0.17 0.18 0.19 J01F F01 Clindamycin 0.09 0.10 0.10 0.11 0.11 0.12 J01F F02 Lincomycin 0.003 0.001 J01G B01 Tobramycin 0.03 0.02 0.03 0.03 0.03 0.02 J01G B03 Gentamicin 0.006 0.007 0.006 0.006 0.006 0.006 J01G B07 Netilmicin 0.02 0.02 0.02 0.02 0.02 0.02 J01M A01 Ofloxacin 0.07 0.07 0.07 0.06 0.06 0.05 J01M A02 Ciprofloxacin 0.18 0.19 0.20 0.23 0.26 0.29 J01M B02 Nalidixic acid 0.02 0.02 0.01 0.01 0.01 0.01 J01X A01 Vancomycin 0.005 0.005 0.005 0.005 0.004 0.005 J01X A02 Teicoplanin 0.0002 0.0009 0.0009 0.001 0.0007 0.0012 J01X B01 Colistin 0.002 0.002 0.004 0.003 0.003 0.003 J01X C01 Fusidic acid 0.002 0.003 0.003 0.003 0.003 0.003 J01X D01 Metronidazole 0.052 0.052 0.056 0.056 0.060 0.063 J01X D02 Tinidazole 0.002 0.001 J01X E01 Nitrofurantoin 0.39 0.39 0.38 0.38 0.37 0.37 J01X X05 Methenamin 1.29 1.44 1.61 1.75 1.91 1.95 P01AB01 Metronidazole 0.20 0.20 0.18 0.18 0.18 0.18
IV. OCCURRENCE OF ANTIMICROBIAL RESISTANCE
A.
BACTERIA FROM FEED, ANIMALS AND FOOD
Bacteria from feed
TABLE 9. Escherichia coli isolates from dog food (meat by-products) (n=70). Breakpoints (mg/L), MIC50, MIC90, MIC range (mg/L) and proportion of isolates susceptible (S), intermediately susceptible (I) and resistant (R) to various antimicrobial agents are shown. Sampling, laboratory methods, and data handling are described in Appendix 3.
Breakpoints (mg/L) Proportion of isolates (%) MIC range (mg/L) MIC50 MIC90
S R S I R Tetracycline ≤ 4 ≥ 16 86.6 0.0 13.4 0.75 - 256 1 96 Chloramphenicol ≤ 8 ≥ 32 94.0 1.5 4.5 1.5 - > 256 4 6 Ampicillin ≤ 8 ≥ 32 89.6 0.0 10.4 1 - > 256 3 512 Cefuroxime ≤ 4 ≥ 32 95.5 3.0 1.5 1 - 32 2 3 Trimethoprim ≤ 8 ≥ 16 95.5 - 4.5 0.19 - > 32 0.5 0.75 Sulfonamides ≤ 256 ≥ 512 88.1 0.0 11.9 4 - > 256 64 512 Streptomycin ≤ 4 ≥ 8 79.1 - 20.9 1.5 - > 256 3 128 Gentamicin ≤ 4 ≥ 16 100.0 0.0 0.0 0.25 - 2 0.75 1 Kanamycin ≤ 16 ≥ 64 98.5 0.0 1.5 1 - 256 3 3 Neomycin* ≥ 25 ≤ 20 100.0 0.0 0.0 21 - 32 Nalidixic acid ≤ 16 ≥ 32 100.0 - 0.0 1 - 6 2 3 Enrofloxacin ≤ 0.5 ≥ 2 100.0 0.0 0.0 0.012 - 0.25 0.047 0.064 * The susceptibility to neomycin was tested using disk diffusion (Neo-Sensitabs, Rosco).
COMMENTS:
The isolates included were from dog food and treats, either of imported or Norwegian origin, purchased in pet stores in Norway. Dried pig ears, dried skin and penises from cattle as well as other frozen meat by-products were among the products tested.
Seven of the isolates were resistant towards one of the antimicrobial agents included, seven isolates towards two, and five isolates towards five or more anti-microbials. The five multiresistant isolates were from dried swine products, out of which three were from Norway and two were of unknown origin.
The data show that resistance to streptomycin, tetracycline, sulfonamides and ampicillin, respectively, was most common. These antimicrobials have been and/or are still commonly used for clinical purposes in food producing animals in Norway and elsewhere.
All veterinary preparations containing chloramphenicol were withdrawn from the Norwegian market in 1992. However, various studies, including this, have shown that E. coli with reduced susceptibility to chloramphenicol still can be isolated from food producing animals in areas where chloramphenicol has been used in the past.
One of the isolates of Norwegian origin was resistant to the cephalosporin cefuroxime, and one was resistant to kanamycin. No antimicrobial preparations containing cephalosporins or kanamycin are approved for veterinary use in Norway.
No reduced susceptibility to the quinolones nalidixic acid and enrofloxacin was observed. Although enrofloxacin is approved for therapeutic use in animals in Norway, the veterinary consumption of this drug is very low.
Bacteria from infections in animals
Staphylococcus
spp. from mastitis in cows
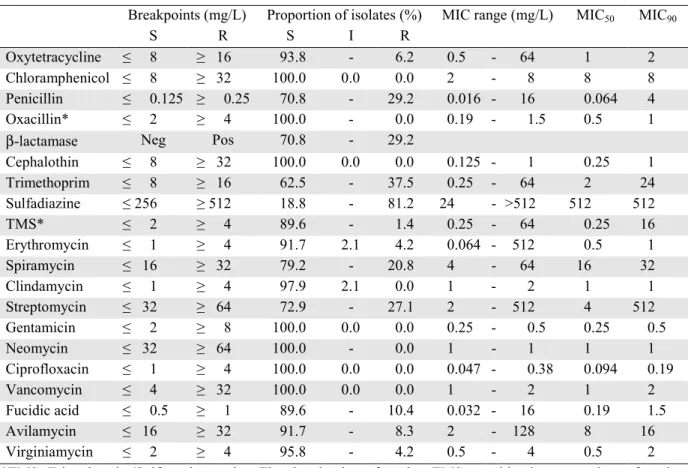
TABLE 10. Staphylococcus aureus isolates from clinical mastitis in cows (n=123). Breakpoints (mg/L), MIC50, MIC90, MIC range (mg/L) and proportion of isolates susceptible (S), intermediately susceptible (I) and resistant (R) to various antimicrobial agents are shown. Sampling, laboratory methods, and data handling are described in Appendix 3.
Breakpoints (mg/L) Proportion of isolates (%) MIC range (mg/L) MIC50 MIC90
S R S I R
Oxytetracycline ≤ 8 ≥ 16 99.2 - 0.8 0.25 - 32 1 1
Chloramphenicol ≤ 8 ≥ 32 91.1 8.9 0.0 1 - 16 8 8
Penicillin ≤ 0.125 ≥ 0.25 95.1 - 4.9 0.032 - 16 0.64 0.125
Oxacillin* ≤ 2 ≥ 4 97.6 - 2.4 0.5 - 3 0.5 1
β-lactamase Neg Pos 95.1 - 4.9
Cephalothin ≤ 8 ≥ 32 99.2 0.8 0.0 0.125 - 16 0.25 0.25 Trimethoprim ≤ 8 ≥ 16 100.0 - 0.0 0.38 - 1.5 0.75 1 Sulfadiazine ≤ 256 ≥ 512 90.2 0.0 9.8 48 - 512 96 192 TMS** ≤ 2 ≥ 4 100.0 - 0.0 0.125 - 0.25 0.25 0.25 Erythromycin ≤ 1 ≥ 4 98.4 1.6 0.0 0.094 - 2 0.5 1 Spiramycin ≤ 16 ≥ 32 98.4 - 1.6 8 - 32 16 16 Clindamycin ≤ 1 ≥ 4 99.2 0.8 0.0 1 - 2 1 1 Streptomycin ≤ 32 ≥ 64 95.9 - 4.1 2 - 512 8 16 Gentamicin ≤ 2 ≥ 8 100.0 0.0 0.0 0.25 - 2 0.5 1 Neomycin ≤ 32 ≥ 64 100.0 - 0.0 1 - 2 1 1 Ciprofloxacin ≤ 1 ≥ 4 100.0 0.0 0.0 0.094 - 0.38 0.19 0.25 Vancomycin ≤ 4 ≥ 32 100.0 0.0 0.0 1 - 4 1 2 Fucidic acid ≤ 0.5 ≥ 1 98.4 - 1.6 0.064 - 16 0.19 0.19 Avilamycin ≤ 16 ≥ 32 99.2 - 0.8 4 - 32 8 16 Virginiamycin ≤ 2 ≥ 4 100.0 - 0.0 0.5 - 1 0.5 1 * Three isolates were resistant to oxacillin. These were tested for the presence of the mecA gene and found to be negative.
**TMS=Trimethoprim/Sulfamethoxazole. The breakpoints for the TMS combination are given for the trimethoprim component only.
TABLE 11. Staphylococcus aureus isolates from clinical mastitis in cows (n=123). Distribution (%) of MIC values (mg/L). Shaded areas in each row indicate susceptibility (no shade), intermediate susceptibility (light grey) and resistance (dark grey).
0.032 0.064 0.125 0.25 0.5 1 2 4 8 16 32 64 128 256 ≥ 512 Oxytetracycline 1 25 67 7 1 Chloramphenicol 4 7 80 9 Penicillin 2 85 8 1 1 3 Oxacillin 73 22 2 2 Cephalothin 42 51 5 1 1 Trimethoprim 33 65 3 Sulfadiazine 32 47 12 10 TMS* 2 98 Erythromycin 2 1 81 14 2 Spiramycin 17 81 2 Clindamycin 99 1 Streptomycin 2 30 47 15 2 1 3 Gentamicin 11 60 25 3 Neomycin 94 7 Ciprofloxacin 38 55 7 Vancomycin 61 37 2 Fucidic acid 4 43 51 1 1 Avilamycin 36 49 15 1 Virginiamycin 73 27
*TMS=Trimethoprim/Sulfamethoxazole. The breakpoints for the TMS combination are given for the trimethoprim component only.
TABLE 12. Staphylococcus aureus isolates from subclinical mastitis in cows (n=118). Breakpoints (mg/L), MIC50, MIC90, MIC range (mg/L) and proportion of isolates susceptible (S), intermediately susceptible (I) and resistant (R) to various antimicrobial agents are shown. Sampling, laboratory methods, and data handling are described in Appendix 3.
Breakpoints (mg/L) Proportion of isolates (%) MIC range (mg/L) MIC50 MIC90
S R S I R
Oxytetracycline ≤ 8 ≥ 16 100.0 - 0.0 0.5 - 4 1 1 Chloramphenicol ≤ 8 ≥ 32 97.5 2.5 0.0 3 - 16 8 8 Penicillin ≤ 0.125 ≥ 0.25 91.5 - 8.5 0.032 - 16 0.064 0.125 Oxacillin ≤ 2 ≥ 4 100.0 - 0.0 0.19 - 1 0.5 1
β-lactamase Neg Pos 92.4 - 7.6
Cephalothin ≤ 8 ≥ 32 100.0 0.0 0.0 0.125 - 1 0.25 0.25 Trimethoprim ≤ 8 ≥ 16 100.0 - 0.0 0.38 - 1.5 0.75 1 Sulfadiazine ≤ 256 ≥ 512 76.3 - 23.7 16 - 512 128 512 TMS* ≤ 2 ≥ 4 100.0 - 0.0 0.125 - 0.25 0.25 0.25 Erythromycin ≤ 1 ≥ 4 100.0 0.0 0.0 0.094 - 1 0.5 0.5 Spiramycin ≤ 16 ≥ 32 97.5 - 2.5 0.25 - 64 16 16 Clindamycin ≤ 1 ≥ 4 100.0 0.0 0.0 0.5 - 1 1 1 Streptomycin ≤ 32 ≥ 64 96.6 - 3.4 2 - 512 8 16 Gentamicin ≤ 2 ≥ 8 100.0 0.0 0.0 0.25 - 2 0.5 1 Neomycin ≤ 32 ≥ 64 100.0 - 0.0 1 - 2 1 1 Ciprofloxacin ≤ 1 ≥ 4 100.0 0.0 0.0 0.032 - 0.25 0.125 0.19 Vancomycin ≤ 4 ≥ 32 100.0 0.0 0.0 1 - 4 1 2 Fucidic acid ≤ 0.5 ≥ 1 99.2 - 0.8 0.032 - 3 0.125 0.19 Avilamycin ≤ 16 ≥ 32 100.0 - 0.0 2 - 16 4 8 Virginiamycin ≤ 2 ≥ 4 100.0 - 0.0 0.5 - 1 0.5 1 *For footnote, see Table 11.
TABLE 13. Staphylococcusaureus isolates from subclinical mastitis in cows (n=118). Distribution (%) of MIC values (mg/L). Shaded areas in each row indicate susceptibility (no shade), intermediate susceptibility (light grey) and resistance (dark grey).
0.032 0.064 0.125 0.25 0.5 1 2 4 8 16 32 64 128 256 ≥ 512 Oxytetracycline 28 70 2 1 Chloramphenicol 14 84 3 Penicillin 3 82 6 1 1 1 2 4 Oxacillin 1 72 27 Cephalothin 45 48 6 1 Trimethoprim 29 69 3 Sulfadiazine 1 11 43 21 24 TMS* 3 98 Erythromycin 2 4 86 9 Spiramycin 1 22 75 1 2 Clindamycin 2 98 Streptomycin 8 38 36 14 1 2 2 Gentamicin 19 48 28 5 Neomycin 92 8 Ciprofloxacin 1 2 58 40 Vancomycin 66 31 3 Fucidic acid 1 3 56 39 1 1 Avilamycin 3 50 42 6 Virginiamycin 84 16
*For footnote, see Table 11.
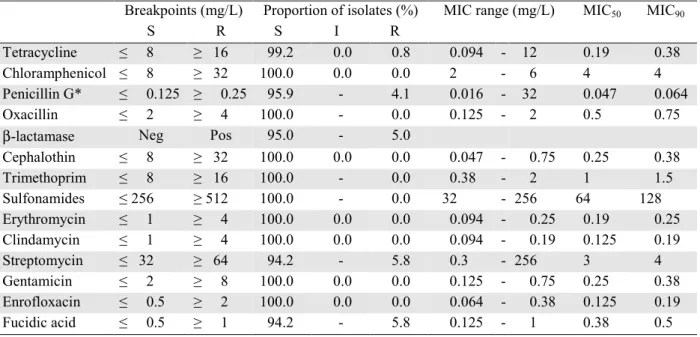
TABLE 14. Coagulase negative staphylococci (CNS) isolates from mastitis in cows (n=48). Breakpoints (mg/L), MIC50, MIC90, MIC range (mg/L) and proportion of isolates susceptible (S), intermediately susceptible (I) and resistant (R) to various antimicrobial agents are shown. Sampling, laboratory methods, and data handling are described in Appendix 3.
Breakpoints (mg/L) Proportion of isolates (%) MIC range (mg/L) MIC50 MIC90
S R S I R
Oxytetracycline ≤ 8 ≥ 16 93.8 - 6.2 0.5 - 64 1 2 Chloramphenicol ≤ 8 ≥ 32 100.0 0.0 0.0 2 - 8 8 8 Penicillin ≤ 0.125 ≥ 0.25 70.8 - 29.2 0.016 - 16 0.064 4 Oxacillin* ≤ 2 ≥ 4 100.0 - 0.0 0.19 - 1.5 0.5 1
β-lactamase Neg Pos 70.8 - 29.2
Cephalothin ≤ 8 ≥ 32 100.0 0.0 0.0 0.125 - 1 0.25 1 Trimethoprim ≤ 8 ≥ 16 62.5 - 37.5 0.25 - 64 2 24 Sulfadiazine ≤ 256 ≥ 512 18.8 - 81.2 24 - >512 512 512 TMS* ≤ 2 ≥ 4 89.6 - 1.4 0.25 - 64 0.25 16 Erythromycin ≤ 1 ≥ 4 91.7 2.1 4.2 0.064 - 512 0.5 1 Spiramycin ≤ 16 ≥ 32 79.2 - 20.8 4 - 64 16 32 Clindamycin ≤ 1 ≥ 4 97.9 2.1 0.0 1 - 2 1 1 Streptomycin ≤ 32 ≥ 64 72.9 - 27.1 2 - 512 4 512 Gentamicin ≤ 2 ≥ 8 100.0 0.0 0.0 0.25 - 0.5 0.25 0.5 Neomycin ≤ 32 ≥ 64 100.0 - 0.0 1 - 1 1 1 Ciprofloxacin ≤ 1 ≥ 4 100.0 0.0 0.0 0.047 - 0.38 0.094 0.19 Vancomycin ≤ 4 ≥ 32 100.0 0.0 0.0 1 - 2 1 2 Fucidic acid ≤ 0.5 ≥ 1 89.6 - 10.4 0.032 - 16 0.19 1.5 Avilamycin ≤ 16 ≥ 32 91.7 - 8.3 2 - 128 8 16 Virginiamycin ≤ 2 ≥ 4 95.8 - 4.2 0.5 - 4 0.5 2 *TMS=Trimethoprim/Sulfamethoxazole. The breakpoints for the TMS combination are given for the trimethoprim component only.