Bayesian Model Averaging application on
Energy consumption model In Saudi Arabia
ABSTRACT:The paper attempts to establish the determinants of energy use in Saudi Arabia over the period (1971 - 2011) Using Bayesian model averaging approach (BMA). In the literature, there are several explanatory variables that have been used as
determinants of energy consumption. However, these models have the problem of uncertainty regarding the best choice of the variables and the model specification. Thus the use of BMA will solve the model uncertainty. The choice of the variables did not limit to previous studies’ explanatory variables but extended to include some socio-economic effects. The study concludes that among the nine variables that have been applied, export and industry value added are the first and second most
important variables affecting energy consumption; the carbon dioxide comes third then population growth considered the fourth effective variable to influence energy consumption in Saudi Arabia.
Introduction:
According to the U.S energy Information Administration (EIA), Saudi Arabia is still the world’s second-largest petroleum liquids and crude oil producer behind the United States (2014). Since 1960’s, Saudi Arabia has been blessed by abundant of nonrenewable fossil fuels energy sources on which its economy basically depends. The consumption and production of fossil fuels generally result on the emissions of carbon dioxide (CO2), which is the main drive of recent environmental concern like climate change and global warming.
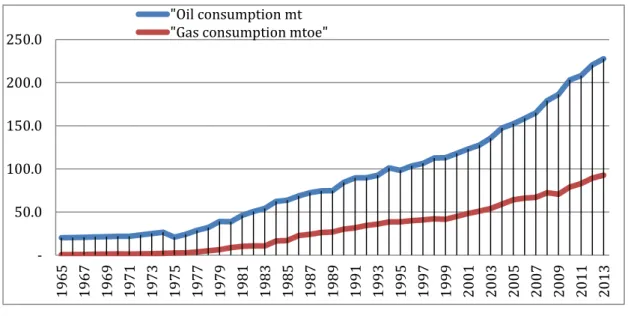
Saudi Arabia’s petroleum consumption in the area of fuel transportation and direct crude oil burn for power generation is considered the largest in the Middle East. In 2014, It was considered the world’s eighth largest country of oil consumption with approximately 2,968 thousand barrels per day. Also, it is considered the world’s
seventh largest country of natural gas consumption with around 3,637 billion cubic feet. Energy consumption in Saudi Arabia is shown in Figure 1 Since 1960’s, the energy consumption has been increasing highly depending on oil and gas for energy generation. Beginning of 1970s, it seems there were some energy mix as a
diversification on energy consumption, yet apparently oil was and still maintaining the control.
source: BP (2015)
Population also expected to contribute on the increasing of energy consumption in Saudi Arabia. The annual growth of population in Saudi Arabia is approximately 1.9% in 2014.This increasing of population would increase the demand for electricity which increase the energy consumption and since Saudi Arabia still depends heavily on oil and natural gas as a source of producing energy, then the environment is expected to heavily impacted. According to the World Bank (Development Indicator) data as it is shown in Figure 2, the trend of the growth rates of real GDP, energy use and CO2 emitted per capita from 1970- 2011. It is obvious that within the late 1970’s, Saudi Arabia’s economy per capita was shrinking while within the period from 2001-2010, the economic growth has increased by nearly 28%. Apparently, the energy consumption per capita is stably accelerating and this
-50.0 100.0 150.0 200.0 250.0 1965 1967 1969 1971 1973 1975 1977 1979 1981 1983 1985 1987 1989 1991 1993 1995 1997 1999 2001 2003 2005 2007 2009 2011 2013 "Oil consumption mt
"Gas consumption mtoe"
Figure 1 : Energy Consumption Pattern in Saudi Arabia (1965 – 2013)
Mil lion tonne s of oi l equival ent (mt oe )
contributes in increasing the CO2 emissions per capita for decades even after Saudi Arabia’s ratification of Kyoto Protocol in 2005, which aims generally to decrease the CO2 emissions.
Figure 2
Over the last decade, hundreds of studies has been done to see the impact of some factors on the energy consumption. A large number of explanatory variables have been used in the literature as determinants of energy consumption. There are various different economic theories that are compatible with one another( Mehara & Rezaei, 2015). Some theories support the inclusion of particular variables while most techniques of including or excluding variables are arbitrary. Some theories include general variables without the method of measuring these variables like “human capital” which leads to a possible problem of uncertainty. Thus a model Averaging is used to tackle this problem where it works on finding the best estimates of the model and not finding the best model!
This paper applies the Bayesian model averaging to assess how
socioeconomic factors influence energy consumption in Saudi Arabia during (1971-2011). It starts with the literature review of energy consumption determinants in general and then providing the methodology and the data that are utilized. Lastly, it presents the empirical results and then the conclusion.
Literature review of Energy Consumption Determinants: 0 5 10 15 20 0 5000 10000 15000 20000 25000 1971 1981 1991 2001 2011 Doll ars of GDP & KG of Oil Equ ivalent pe r ca pi ta
GDP Growth, Energy Use and CO2 Emissions per
capita
Energy use per capita GDP per capita CO2 emissions per capita to ns of CO 2 emi tt edCarbon dioxide emissions:
The CO2 emission is a result from non-renewable energy and it increases particularly from fossil fuels consumption. The environmental concern about the consequences of increasing of CO2 emission like global warming, from energy consumption brought attention to some policy makers to take use alternative renewable energy. However, Since Saudi Arabia is heavily dependent on fossil fuels to generate power, the intensity of CO2 emission is used in the model.
Prices of ( oil and natural gas and electricity):
Asafu-Adjaye (2000) examines the causality among energy consumption, energy price and economic growth model in some Asian developing countries where he found that energy consumption and energy prices are mutually casual. Also, recent study of Osigwe and Arawomo ( 2015 ) which concludes a significant relationship between energy consumption and energy prices in Nigeria, one of the Organization of the Petroleum Exporting Countries( OPEC). Since energy prices vary by energy sources and it is hard to find comparable series on energy prices for Saudi Arabia, it is suggested by Mahadevan and Asafu-Adjaye (2007) to use consumer price index instead of energy prices as the are expected to be sufficiently reflected in the consumer prices index base year 2010.
Energy needs:
Energy consumption can be influenced by the population growth as with the increasing of population, the demand for electricity is assumed to be increased. Barliwala and Reddy( 1993) in “Energy consumption and population” showed that population growth increase the need of energy which is explained by the various human activities. Some studies exposes that China and India are the most populated countries and at the same time the among the highest energy consumers in the world.
Economic growth:
Over decades, there have been various studies on the relationship between economic growth and energy consumption, which is summarized through four scenarios. First, neutral hypotheses where there is no causal relationship between
energy consumption and economic growth. See (Yu and Hwang, 1984; Yu and Choi, 1985). Second, growth hypothesis where the causality runs from energy
consumption to economic growth as if saying that the increase in energy use will increase economic growth see (Akraca and Long (1979), Stern (1993,2000), and Soytas and Sari (2006). Third, the conservation hypothesis where reducing energy consumption will nor reduce economic growth see ( Kraft and Kraft (1978), Erol and Yu (1989), and Sari et al. (2008). Since Saudi Arabia is an energy dependent country and an exporter of fossil fuels commodities, conservation policies may negatively impact the economic growth.
Export:
Most of recent studies examine the impact of export on energy consumption with the assumption that some particular export industries that specialized on petroleum industry would consume more energy. Smyth and Lean (2010) investigated the causal relationship among energy consumption, labor capital, economic growth and export finding a bi-directional causality between energy consumption and export in Malaysia. Thus real export price in $US variable has been used.
Industrialization:
Jones,1991 and Samouilidis and Mitropoulos, 1984 illustrate that industrialization contribute in increasing energy usage due to the high value added manufacturing as it needs more energy than other manufacturing. Moreover, they showed that particular industries that Saudi Arabia is specialized of like petroleum refining, primary metals and chemicals are tend to use more energy than other industries. The study used industry value added as a % of GDP as an industrialization measure. Investment: (Foreign Direct Investment FDI)
Different studies have indicated that foreign investment might have either negative or positive externalities. Investment needs energy consumption so the expansion of investment in industrial sector will induce energy consumption to support the manufacturing process. Mielnik and Goldemberg (2000) and Sadorsky (2010) have found a positive significant relationship between FDI and energy consumption. On the other hand, some studies shows the negative impact of FDI on energy
consumption see Bento (2011). Therefore, the growth of FDI is employed in the
Financial development:
Some studies suggest that financial development can affect energy use. Financial development assist in increasing industrial growth, which creates demand for infrastructure and in turn affects in increasing energy use. For example, Sadorsky(2011), Shahbaz and Lean, (2012) shows that financial development increases the use of energy. Thus, domestic credit provided by banking sector % of GDP has been used.
Human Capital:
Human capital might affect energy consumption in different ways. Human capital may increase the environmental concerns that result from fossil fuels energy consumption like air pollution and global warming. The growth of human capital generally impacts the economic growth, as it is a consequence and condition of economic growth.
Methodology:
Leamer (1978, Sections 4.4_4.6) presented the first basic Bayesiam model averaging. Then followed and developed by Madigan and Raftery 1994; Hoeting et al. 1999. The approach of BMA is characterized by its flexibility with respect of size and exact specification of a model. Moreover, it uses the uniform prior which means it does not need a priori selection of any model. Also, the weighted average over all statistical models is the base of the inference. The BMA was demonstrated as a useful tool in econometrics as it accounts for the model uncertainty. It application has been extended and recently to include studies by León-González and Montolio (2004), Sala-i-Martin et al. (2004) and Masanjala and Papageorgiou (2007).
Considering a linear regression model where the dependent variable is energy consumption (y) is the dependent variable and it is regressed on an intercept say α, and a number of explanatory variables chosen from a set of K variables in matrix X of dimension n× 𝐾. β is the full k-dimensional vector of regression coefficients. ε follows an n-dimensional Normal distribution with zero mean and identity covariance matrix.
y = αn + Xi βi + ε ε ∼ N(0, σ2 I)
important characteristic about BMA. The estimates of the coefficients are not based on one model but derived from averaging model of estimated coefficient in every single variable with 2K where K is the number of explanatory variables. So in this case we have (9) explanatory variables so 29= 512 which means estimating 512 variable combinations and ( 512 ) models. The model weights is derived from posterior model probabilities based on Bayes’ theorm:
p(Mi|y, X) =𝐩(𝐲|𝐌𝐢,𝐗)𝐩(𝐌𝐢) 𝐩(𝐲|𝐗) = 𝐩(𝐲|𝐌𝐢,𝐗)𝐩(𝐌𝐢)
∑𝟐𝒌𝒔=𝟏𝐩(𝐲|𝐌𝐬,𝐗)𝐩(𝐌𝐬)
where p(Mi|y, X) is the posterior model probability (PMP) and it is proportional to1, since the integrated likelihood p(y|X) is constant over all models which donates that it is simply a multiplicative term, the marginal likelihood of the model p(y|Mi, X) the probability of the data given the model Mi
times the prior model probability p(Mi) which reflects the prior belief of the model and it is usually set to be a uniform prior probability for each model proportional to 1 to show the lack of prior knowledge. Various studies have used different options for the prior which include Zellner’s g prior, in this study I will use the ’unit information prior’ (UIP), which sets g = N for all models and therefore it attributes the same information to the prior for every single observation.
In this case UIP g-prior( g=N=41)
Data:
A time series data of the ten variables between the period ( 1971 - 2011 ) have been utilized as the available data constrained by this period. The description of each variables is shows in table ( 1 ) and are collected from Saudi Arabian Monetary Agency (SAMA) , World Bank development indicator, Federal Reserve Bank of St Louis, and the Energy Information Administration (EIA). The energy consumption is represented by Energy use (kg of oil equivalent ). Because there is no data for energy prices, OPEC oil prices over the consumer price index in Saudi Arabia of base year 2010 is used to proxy energy prices
Table ( 1 ) Variables used in the model Variable Description EN GDPG SEN CO2 FDI DCP IVA POPG ENP lnEX
Natural log of energy use (kg of oil equivalent ) Gross domestic product growth (annual %) School enrollment, tertiary (%gross)
Carbon dioxide intensity (Kg per Kg of oil equivalent energy use) Foreign direct investment, net inflows (% of GDP)
Domestic credit provided by financial sector (% of GDP) Industry, value added (% of GDP)
Population growth (annual %)
OPEC oil price over consumer price index of base year 2010 used as a proxy of energy use
Natural log of real export prices, calculated by the author dividing nominal deflator of export by the consumer price index.
Empirical Results:
The coefficient result can be seen in the table(2) as it shows all the variable symbols with the corresponding statistics.
The first corresponding statistic column represents the posterior inclusion probability (PIP) which shows the importance of the variables in explaining the data. It thus illustrates the “robustness” of the variables in BMA analysis, and a value of 0.5 and greater is recommended (Raftery, 1995). We can see that with 99%, all of posterior model mass rely on models that include export and industry value added, 97% on carbon dioxide and 87% on population growth. While the rest of the variables do not seem to matter much. The second column represent the coefficient averaged over all models. It is obvious that exports and school enrollment have positive coefficients over all models. The third column gives us the coefficients’ posterior standard deviation (Post SD) gives further evidence of the coefficient so we can have an evident that export is positive. The fourth column shows the sign certainty of the ’posterior probability of a positive coefficient expected value conditional on inclusion’ represented in
“Cond.Pos.Sign”. in the model we can see that SEN and export are having a corresponding 100% expected value with positive signs, while the expected value of the negative sign for carbon dioxide, population growth and industry value added are nearly zero.
Model performing:
Table (3) shows a comparative on the best-performed model. From the 512 models I have just chosen the best 4 models. Each model includes the posterior model probability and the best model is with 35% posterior model probability (PMP) and it includes export, population growth, carbon dioxide and industry value added. The second best model has a 9% PMP is having the same variables in the first model plus the school enrollment. The third best model has 6% PMP including the same variables on the first best model plus gross domestic product growth. The fourth and fifth best model have a 5% as domestic credit provided by financial sector and
energy price are included to the first best model variables respectively. The posterior expected model size in the study is 4.8 which is the sum of the PIPs.
Table(3) Best Five Model Performance:
Conclusion:
The paper studies the model in a different approach by considering model uncertainty and using the Bayesian model averaging to treat the misspecification problem of the model and become with the best estimates. Thus, the BMA technique was applied to demonstrate the influential determinants of energy
consumption in Saudi Arabia. In addition, various kind of variables have been utilized in the literature as significant determinants of energy consumption so the study include these variables and add some socioeconomics variables to investigate the determinant factors on energy consumption. The results indicate that export , industry value added, carbon dioxide and population growth are the main factors or determinants that impact energy consumption in Saudi Arabia. Export has a positive influence on energy consumption, which is logical as Saudi Arabia’s exports based mainly on energy export, oil, therefore it will influence energy consumption
positively. Population growth, industry value added, and carbon dioxide are having a negative influence on energy consumption, which is not on common results from other studies as population growth is expected to have positive impact on energy consumption as well as the industry value added. However, the conditional posterior probability signs for these three variables were nearly zero. Finally, the study draws a very significant results regarding the most determinant variables affecting energy consumption in Saudi Arabia especially at the recent time where there are some intention to implement policies to increase prices of domestic energy while the BMA
shows that the price of energy does not included in the best model of variables determining energy consumptions.
References:
- Asafu-Adjaye,John,2000. “The Relationship between energy consumption, energy prices and economic growth: time series evidence from Asian developing countries” Energy Economics, Elsevier, Vol. 22(6), 615-625
- Augustine C. Osigwe & Damilola Felix Arawomo, 2015. “ Energy consumption, energy prices and economic growth: Causal Relationship based on error correction model”, International Journal of Energy Economics and Policy, 408-414.
- Bayesian Model Averaging with BMS for BMS Version 0.3.0 Stefan Zeugner May 5, 2011
- Clyde, M. (1999a). Bayesian model averaging and model search strategies (withdiscussion). In Bayesian Statistics 6. (J. M. Bernardo, A. P. Dawid, J. O. Berger and A. F. M. Smith, eds) Oxford Univ. Press.157–185.
- Consumption among ECO Countries; Based on Bayesian Model Averaging and Weighted-Average Least Square. International Letters of Social and
Humanistic Sciences, Vol.54, 96-109.
- Economic report of the BP statistical review of world energy, 2015.
http://www.BP.com
, http://www.eia.gov
- IEA, 2015.World Energy Outlook, International Energy Agency, Paris.
- Kraft, J., Kraft, A. 1978. On the relationship between energy and GNP. Journal of Energy and Development 3, 401–403.
- George, E. I. (1999). Discussion of “Model averaging and model searchby M. Clyde.” In Bayesian Statistics 6 (J. M. Bernardo, J. O. Berger, A. P. Dawid and A. F. M. Smith, eds.) Oxford University Press
- Leamer, E. Edward.(1987). Specification Searches: Ad Hoc Inference with Nonexperimental Data.
- Lean,H.H.andR.Smyth.2010b. “Multivariate Granger Causality between electricity generation,exports, prices and GDP in Malaysia .Energy 35, 3640-3648
- Lukasz A. Drozd and Jaromir B. Nosal Jan, 2011. “Understanding International Prices: Customers as Capital” TECHNICAL APPENDIX (not intended for
publication)
- Mahadevan, Renuka. 2007. “Energy consumption, economic growth and
prices: A reassessment using panel VECM for developed and developing countries”. Energy Policy Journal, 2481-2490
- Mahadevan, Renuka & Asafu-Adjaye, John, 2007. “Energy consumption, economic growth and prices: A reassessment using panel VECM for
developed and developing countries” Energy Policy, Elsevier, vol. 35(4), 2481-2490.
- Mehrara, M., 2007. Energy consumption and economic growth: The case of oil exporting countries. Energy Policy 35, 2939–2945.
- Mehrara, M., Rezaei, Razi. 2015. Determinants of Renewable Energy U.S. Energy Information Administration, 2014. Saudi Arabia – Country Analysis Breif. http://www.eia.gov/countries/cab.cfm?fips=SA.
- Raftery, E. Adrian. (1995) Bayesian Model Selection in Social Research. Sociological Methodology, Vol.25. 111-163.
- Saudi Arabian Monetary Agency (SAMA) http://www.sama.gov.sa/en-us/EconomicReports/Pages/default.aspx
- Viallefont, V., Raftery, A. E. and Richardson, S. (1998). Variable selection and Bayesian Model Averaging in case-control studies. Technical Report 343, Dept. Statistics, Univ. Washington.
- World Bank, Consumer Price Index for Saudi Arabia retrieved from FRED, Federal Reserve Bank of St.Louis.
- World Bank, World Development Indicators for Saudi Arabia,
http://data.worldbank.org/
- Yu, E. S. H., Hwang, B. K. (1984) The Relationship between Energy and GNP, Further Results. Energy Economics 6(3): 186-190.
- Yu, E. S. H., Choi, J. Y. (1985) The Causal Relationship between Energy and GNP: An International Comparison. Journal of Energy and Development 10(2): 249-272.