The Multiple Pheromone Ant Clustering Algorithm
and its application to real world domains
Jan Chircop
Aston University, Birmingham, United Kingdom Email: [email protected]Christopher D. Buckingham
Aston University, Birmingham, United Kingdom Email: [email protected]Abstract—The Multiple Pheromone Ant Clustering Algorithm (MPACA) models the collective behaviour of ants to find clusters in data and to assign objects to the most appropriate class. It is an ant colony optimisation approach that uses pheromones to mark paths linking objects that are similar and potentially members of the same cluster or class. Its novelty is in the way it uses separate pheromones for each descriptive attribute of the object rather than a single pheromone representing the whole object. Ants that encounter other ants frequently enough can combine the attribute values they are detecting, which enables the MPACA to learn influential variable interactions. This paper applies the model to real-world data from two domains. One is logistics, focusing on resource allocation rather than the more traditional vehicle-routing problem. The other is mental-health risk assessment. The task for the MPACA in each domain was to predict class membership where the classes for the logistics domain were the levels of demand on haulage company resources and the mental-health classes were levels of suicide risk. Results on these noisy real-world data were promising, demonstrating the ability of the MPACA to find patterns in the data with accuracy comparable to more traditional linear regression models.
I. INTRODUCTION
Clustering is the task of partitioning data sets into categories of common likeness. It can be a complex problem to unravel because the boundaries between classes are often ambiguous and non-linear. If the data set has high dimensionality, it can be extremely difficult to understand the inherent structure and exploit it with an appropriate clustering algorithm. This has led to a large variety of approaches seeking to optimise cluster analysis, including ones modelled on insect behaviour.
This paper investigates how computer models of ants can help humans sort data into meaningful classes using cluster analysis. A brief review of relevant ant models is provided before explaining how the MPACA works. The main aim of the paper is to show how it can provide meaningful results from real-world data and an example from the logistics industry is used. The paper concludes with a discussion of the model, its effectiveness, and how it can be applied to additional data sets.
II. BACKGROUND
Swarm intelligence (SI) is the phenomenon whereby intel-ligent behaviour emerges from the interactions of numerous separate entities with low-level cognitive capacities [1], [4], [5], [6]. There are many examples in the insect world but the focus of this paper is on ants and specifically ant colony
optimisation (ACO). Two ant behaviours have fuelled many of the computer models, one for sorting larvae or corposes and the other foraging for food. The so-called Basic Model (BM) [8] comes from the sorting of ant bodies into piles and is often referenced as the Standard Ant Clustering Algorithm (SACA). It works by assessing the similarity of bodies with others in the same location. In contrast, ant foraging depends on laying down pheromone trails that guide other ants towards objects in which they are interested. It is used to optimise paths between objects, either to link similar ones or to find the shortest paths. The MPACA is based on this type of ACO algorithm.
Using scents or pheromone to form paths is a form of stigmergy, where information is placed in the environment for communication purposes [7], [24]. Shorter paths have ants returning to them more quickly and the pheromone is less affected by evaporation. Together, these phenomena attract ants to locations containing objects with similar attributes and are the driving forces for cluster formation. For the MPACA model applied to real-world domains in this paper, objects are placed within a multidimensional graph space, as others have done [20], [26]. Its main innovation is by having multiple pheromones that distinguish ants within colonies rather than more normally between them [10]. The next section summarises the latest version of the MPACA, which was in-troduced as a clustering algorithm in [41] and applied to some standard data sets. The goal of this paper is to show how the MPACA can be used to learn class assignations and be applied to noisy, diverse real-world data in the domains of mental-health risk assessment and predicting resource requirements for logistics companies.
III. OVERVIEW OF THEMPACA
The Multiple Pheromone Ant Clustering Algorithm, MPACA, is not unique by having many different pheromones laid down on trails for objects. However, no previous models attach a specific pheromone to each particular value of every descriptive attribute of an object. Pheromones encourage other ants to follow them via a scent. In the MPACA model, each pheromone type indicates paths towards a specific feature value in the given search space. It is applicable to multiple dimensions and can accommodate both discrete and continu-ous data of any type. Ordinal dimensions are used to set up the hyperdimensional problem space but are first normalised
to help prevent bias due to types of distributions. The values are measured in the number of standard deviations (SD) from the mean,z, where
z= (x−µ)
SD , (1)
x, is the original value andµ, is the mean.
The values of each object along the dimensions of the hyperdimensional space determine its location in the graph and objects are linked by edges to all other objects if the Euclidean distance is within a parameterised maximum. Non-ordinal features are not part of the hyperdimensional space but still participate in learning by having ants leave pheromone traces along the edges corresponding to these features and their particular values. Ants are then placed on every object, with each ant assigned to one attribute and responding to the particular value the object has for that attribute. The ant’s own attribute value becomes the distinctive pheromone it deposits, which it lays whenever leaving an object with a matching value and which it follows if laid by another ant. The upshot is that there will be as many pheromones in the domain as there are distinct attribute values, including nominal features and ordinal dimensions.
Learning takes place by ants following trails matching their own feature value and depositing pheromone from objects if they also have that value. Paths from an object are chosen stochastically based on the amount of matching pheromone compared to the alternatives. The resulting stigmergy means objects with similar feature values will have higher levels of pheromone connecting them because ants will be depositing in both directions along the path compare to ants travelling along edges with different values at each end. Also, the evaporation of pheromone means longer paths tend to have lower levels of pheromone.
The MPACA has a mechanism for ants to learn feature combinations or interactions that might be important for clus-ter analysis and classification. Pheromone trails for different feature values can draw ants into the same locations if they regularly co-occur with the same objects. If the encounters between the ants exceed a parameterised threshold, the ants will combine each other’s features which means they will now only respond to objects having both features. It enables ants to detect feature combinations and thus to pick up non-linear interactions.
Merging colonies is similarly driven by the frequency of ant encounters. Both feature and colony merges are opera-tionalised by recording ant meetings. These take place when an ant, which we will call the “focus” ant for referential clarity, has reached an object and only if its feature set matches that of the object because this means it is in an area of interest to it. The “encounters” data structure of the focus ant is updated at this point by finding all other ants within the vicinity that are also in an area of interest to them, which is the case if they are in deposit mode on a path away from the object that has the focus ant on it or are coming towards the object. If the number of encounters for the focus ant go above a threshold for colony
or feature merging (they have different thresholds), then the focus ant updates its feature and colony properties accordingly. The thresholds have to be exceeded within a certain time span. The time span is measured in the number of steps, where each cycle of the system moves an ant one step along an edge and encounters recorded on a step that goes outside the time window are removed.
A. MPACA parameters
Although the general idea and philosophy of the MPACA has been described, much of the detail resides with how it is parameterised. This will be summarised here so that the actual values used when applying the model to the data can be understood.
• Edges joining objectsOnly ordinal dimensions are used to set up the hyperdimensional problem space. They are normalised as already explained by Equation 1. This gives the same units to all dimensions in the hyperdimensional space and object values are likewise normalised so that they can be placed in their appropriate location in the space. The resulting graph,G, has a vertex,v, for every object and all objects are connected to other objects by an edge,e, but only if is is within a distance parameter,d: relationships between objects further apart are therefore ignored.
• Step size The granularity for measuring differences be-tween objects depends on how small the steps are along the edges. The assumption was made that plus or minus 2 SDs from the mean covers most population values on that dimension except the outliers. A step size of 0.1 SDs gives 40 steps along each dimension, which is enough for meaningful distinctions between objects.
• Pheromone deposition, evaporation, and path choice Pheromone is laid by ants when they leave an object with matching values and the same parameterised amount,
ph, is laid for all ants and all features. A percentage is removed from paths by evaporation on each step and a maximum amount, ph.max, prevents paths increasing levels of pheromone indefinitely, which would overwhelm the influence of other paths.
A residual parameterr, determines the percentage of total matching pheromone on all edges that is placed on each of them by default. It adds uncertainty by allowing ants to go down paths with little or no scent and explore new areas. Given N potential paths from a vertex with pheromone scent s on the first step of each path, where
sis the pheromone matching the features of the ant, the probability of selecting a particular path,p, is given by
P(p) = PN (s+r) i=1
si+(r×N) .
• Detection range for continuous dimensions
Ants responding to a dimension of an object (e.g. length) are given a range around the exact value of their “home” object (the one they are placed on at the start and that defines their feature value). They respond to any value
within this range, which is based on the step size for the dimension.
• Ant complement
The ant complement, ac, determines how many ats are placed on each feature of an object at the start. It defines the population size and influences sensitivity of cluster analysis by increasing encounters between ants. Greater computational load is an inevitable consequence and the balance will depend on the density of objects and dimensionality of space.
• Merging thresholds
The colony threshold,ct, determines when the population density of ants is high enough to trigger the ant joining a colony. The feature threshold,f t, is linked to the number of times a particular feature has been seen in other ants. Both are driven by ant encounters. On each encounter, the ant records the following information of the other ant: the ant identifier (id), the colony id, the carried feature id, the timestep, and a boolean flag holding the deposit mode of the encountered ant at that time stamp. This is put into theAntSeenRecord, within theAntSeenList. The size of the list structure is kept in check by the time stamp which is placed on it. On exceeding the time-window parameter, this encounter is removed.
• Time-window
The time window, tw, defines the maximum number of steps that can be remembered for ant encounters. It helps prevent over-fitting and enables the ACO model to learn new patterns over time if the domain structure changes. • Visibility The number of steps within which an ant
encounter is counted. Any ant within this distance of the ant whose encounters are being calculated (the focus ant in the earlier description) becomes eligible for being recorded as an encounter.
B. Ant movement
Ants move one step at a time and each movement is recorded as one timestep for the whole system. The path or edge to follow is chosen as a probabilistic function of the strength of matching pheromone on the first step of each edge leading from the vertex: the higher the strength, the more likely the path will be chosen, which distinguishes it from [7]. This mechanism does not require any foresight about the potential vertices that can be visited, and has the single restriction that ants cannot go back along an edge they have just traversed.
C. The MPACA Algorithm
Require: Graph space with connecting edges and ants as-signed to each feature.
while (T ermination not met)do for(Each ant in antlist)do
Increment StepN umber against all encounters in AntSeenList by one
if (StepN umber > threshold)then Remove encounter from AntSeenList end if
if(Ant at vertex)then UpdateAntSeenList counts;
if(Ant f eatures match object)then Activate pheromone deposition mode;
Process AntSeenList for colony and feature merging
else
Deactivate pheromone deposition mode; end if
Choose next edge stochastically taking pheromone values into account;
end if
EdgeT raversal ←EdgeT raversal−1;
if(Ant in deposition mode)then deposit pheromone for each feature; end if
end for
if(Stopping criterion reached)then Output cluster definitions;
else
Perform system wide evaporation; end if
end while
In the MPACA, each step of the ants is a single time interval so edges which are n steps long will take n timesteps to traverse. The MPACA terminates when ants reach a stable dy-namic equilibrium in the colonies they form. This is indicated by a consistent number of colonies and a stable population number in each one.
IV. EVALUATION AND RESULTS
The main aim of this paper is to determine the potential of the MPACA for analysing diverse real-world data sets. Two example domains have been chosen, mental-health risk assessment and hub-and-spoke logistics. The domains have extremely high dimensions (over 200 for the mental-health one) and extremely high numbers of cases (many millions for the logistics domain). These present serious challenges for the tractability of the MPACA but the rewards are high. If the MPACA can form accurate clusters, these will have ant populations that represent a detailed analysis of the relative importance of features and feature combinations required for cluster membership.
In each domain, one of the authors is creating a cognitive model of decision making based on human expertise [42], [43] [44]. The aim is to use it within an Intelligent Knowledge-Based System that helps end users optimise their decisions based on the input information and by exploiting mathematical analysis of the underlying database. The MPACA can provide a useful alternative method that analyses the ant population demographics in each colony to form rules about class mem-bership that can complement the cognitive model. The Ant-Miner algorithm [27] and its derivatives have shown how this approach can work and provide data representations that are more comprehensible to users. The main loop of the Ant-Miner algorithm consists of three key steps: rule construction,
rule pruning, and pheromone updating. Results show that Ant-Miner has good classification performance on test data sets and the ability to constrain the number of rules required [27], [28]. The MPACA rules would be constructed from a detailed understanding of how ant features and their combinations differ within the learned classes.
A. Application of the MPACA to hub-and-spoke logistics net-works
Fig. 1. Transportation in a multiple hub-and-spoke logistics system.
Hub-and-spoke logistics networks have a standard modus operandus [45]. They consist of a number of haulage depots which collect and deliver shipments to and from one or more central hubs. Figure 1 shows a simplified diagram of these activities for a network with 3 hubs and 8 depots. In reality, the networks are much larger than this, with over 100 depots feeding the main hub for the one used to evaluate the MPACA in this paper. The idea is that a depot takes its own customers’ shipments to the hub and brings back shipments from any of the other depots that require delivery to the depot’s assigned delivery area.
The problem depots have is predicting how many shipments will be at the hub by the end of the day that they are required to deliver. If they take too many lorries to the hub, they will have wasted space on the return trip; if they take too few, they will have to leave shipments behind with costly penalties if the network has to deploy alternative resources to deliver them. In short, if depots could be informed early in the day about the total demand (number of shipments) they will have in the day, this will help decision making to optimise their resources.
Clearly some form of automated analysis is required to enable decision makers in a hub-and-spoke model make sense of the available information [46] and companies have been investing in information technology to this effect [47]. It is a key subject of the EU FP7 co-funded project ADVANCE [48], where various machine learning approaches are being studied with regard to their appropriateness for providing reliable predictions. The MPACA will be applied to the same data to compare the performance of ACO with more traditional machine learning.
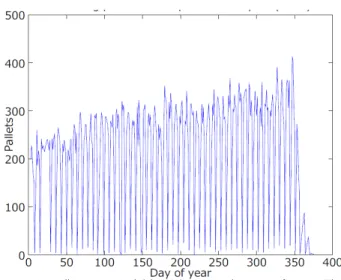
Field work conducted for ADVANCE shows that fluctua-tions in the numbers of shipments (pallets, in this domain) have a deleterious impact on operational performance (Figure 2).
Fig. 2. Fluctuations in the number of pallets each day for a specific depot in the ADVANCE project (the regular very low troughs represent the weekends).
Such peaks and troughs may appear over the whole network, where the total number of shipments passing through a hub varies widely, as well as on a local level where individual depots experience large changes in numbers from day to day even though the overall network numbers may remain stable. Interviews with depot managers revealed a desire for knowing whether they would have more than or less than the expected number of shipments on a particular day. They could then gear up for additional resources or offer to take on other depots’ shipments if spare capacity was likely. To explore the potential of the MPACA in supporting hug-and-spoke decision making, the first step was to find out how well it could predict whether the demand was above or below the mean and compare this with the machine learning program chosen for ADVANCE [40].
1) Predicting shipments: The machine learning program used to compare with the MPACA consists of two main processes: select the most appropriate attributes for a depot and then learn the accompanying linear regression model for predicting the number of shipments or total demand at the end of the day [40]. The attributes used to predict demand include the known current demand (what has already been committed to the hub) and a number of other variables to do with stages of shipment orders, when they were made, and so on. These numbers obviously change as the day progresses so models were learned for separate time points. In fact, a separate regression model was learned for each depot at selected times of each day for each day of the week.
The attribute-selection process picked out 15 of the most influential variables from sixty potential ones and these were used to learn the regression model. The same ones, including the known end-of-day demand, were used by the MPACA to set up the hyperdimensional graph space. Each object (or day in this domain) was assigned to one of two classes: “above” if the known demand was above the mean and “below” otherwise. At the start of learning, the ants were assigned to
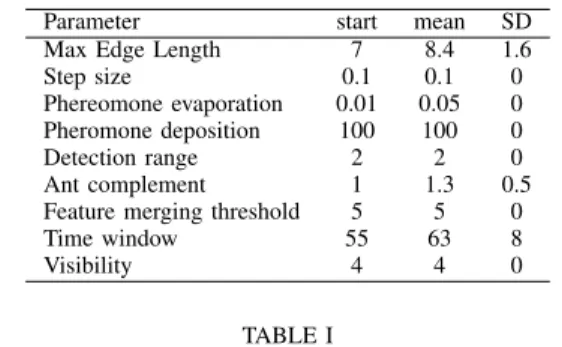
Parameter start mean SD Max Edge Length 7 8.4 1.6
Step size 0.1 0.1 0
Phereomone evaporation 0.01 0.05 0 Pheromone deposition 100 100 0
Detection range 2 2 0
Ant complement 1 1.3 0.5 Feature merging threshold 5 5 0
Time window 55 63 8
Visibility 4 4 0
TABLE I
PARAMETER SETTINGS FOR THEMPACA. THE START VALUE IS THE ONE SET AT THE BEGINNING OF LEARNING AND THE MEAN AND STANDARD
DEVIATION(SD)ARE THE AVERAGE VALUES AS THESE PARAMETERS WERE MANUALLY VARIED OVER THE13TRAINING CYCLES
the colony matching the class of their starting object. The ants then moved around the graph according to the algorithm described earlier until they had formed population clusters,
Testing was conducted by putting the unknown objects into the hypergraph but with the known-demand dimension removed. In other words, the outcome information about these unknown objects was not included in the domain. They were assigned to the colony that had the nearest centroid (multidimensional mean), measured as the Euclidean distance from the object to that point. This provided the MPACA with the ability to predict whether the demand was going to be greater than or less than normal for the day depending on whether it was in the colony for total known demand above the mean or below the mean. The method differs from the MPACA’s origins in cluster analysis [41] by exploiting known outcomes through supervised learning: the the actual number of shipments required for delivery is made part of the hyperdimensional space for learning and then removed when classifying unknown cases.
2) Results: Four depots were tested at two different times of the day, 12.00 and 15.00, on a Wednesday. The mean number of shipments for the depots was around 100 (which equates to between two and three lorry loads). Thirteen separate training and testing cycles were conducted for the MPACA and the results were compared with the machine-learning regression model using precision, which is the percentage of outcomes and predictions agreeing with each other with respect to the total sample size of predictions. The sample for each depot consisted of 206 days and these were randomly divided into two equal sets for training and testing.
Table I shows the parameter settings at the beginning and end of learning, where the parameters are in the same order as described in Section III-A. Automated search was not conducted over the parameter space so these are manual settings based on estimates of the optimal initial settings. The mean and SD show that little variation was used to improve the results but this is mainly due to each cycle being set man-ually. It is likely that a hill-climbing parameter search would produce better results but it is computationally extremely time-consuming and requires optimising the MPACA experimental code.
Precision
Depot Time ML MPACA SD
2 12:00 79 68 0.01 3 12:00 83 68 0.01 5 12:00 60 72 0.01 7 12:00 77 74 0.01 2 15:00 74 74 0.02 3 15:00 75 79 0.01 5 15:00 52 80 0.02 7 15:00 65 78 0.00 MPACA mean 71 74 0.01 TABLE II
RESULTS FOR PREDICTING WHETHER DEMAND WILL BE ABOVE OR BELOW THE AVERAGE FOR THAT DAY FOR FOUR DEPOTS AT TWO TIMES.
MLGIVES THE MACHINE-LEARNING REGRESSION MODEL PREDICTION AND THEMPACAPRECISION IS ITS MEAN FOR13LEARNING AND TESTING CYCLES. THE FINAL STANDARD DEVIATION(SD)COLUMN
GIVES THESDOF THE MEAN ACROSS THE CYCLES.
Table II compares the prediction precision of the MPACA with the machine-learning regresson program produced by ADVANCE [40]. These are preliminary results that are de-signed to provide an indication of the MPACA’s potential for application to real-world data and clearly there are many more sophisticated ways of testing it. Nevertheless, the outcome is promising, with the MPACA having a mean precision equal to the standard regression method. The variation for which of the two models is better for a particular depot and time is probably due to using categorical outcomes where outcome demands only marginally above or below the mean are equally weighted with those having much larger deviations.
B. Mental health risk assessment
The mental-health risk-assessment data relates to the de-velopment of the Galatean Risk and Safety Tool, GRiST [49]. GRiST helps mental-health practitioners assess patients’ risks of suicide, self-harm, harm to others, self-neglect, and vulnerability. It is based on the assessment knowledge of multidisciplinary practitioners working in all areas of mental health and was designed to disseminate their expertise to services where people did not have a specialist mental-health training.
The MPACA will be tested on the suicide risk data collected by GRiST. The input patient information consists of 138 individual items of information or patient cues. Each of these patient vectors has a clinical risk evaluation given to it by the assessor and the database contains more than 50,000 patient records. However, the data varies in its completeness because the circumstances of assessment often mean only some areas are of interest at any particular time. Therefore, clinical judgements are not based on full vectors, and may have less than 50 per cent of the values present. The output risk judgements are along a sliding scale from 0 (minimum risk) to 10 (maximum risk), which means there are no output classes for categorical assignment. Instead, the judgements map to fuzzy risk labels such as minimum, low, medium, high, and maximum.
The aim of analysing the GRiST suicide data is to determine whether input data can predict clinical judgements accurately.
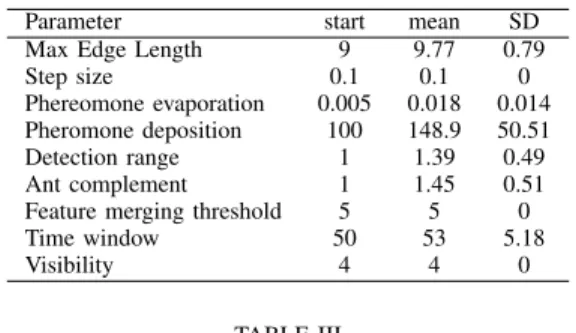
Parameter start mean SD Max Edge Length 9 9.77 0.79
Step size 0.1 0.1 0
Phereomone evaporation 0.005 0.018 0.014 Pheromone deposition 100 148.9 50.51 Detection range 1 1.39 0.49 Ant complement 1 1.45 0.51 Feature merging threshold 5 5 0
Time window 50 53 5.18
Visibility 4 4 0
TABLE III
PARAMETER SETTINGS FOR THEMPACAAS APPLIED TO THEGRIST
DATASET. THE START VALUE IS THE ONE SET AT THE BEGINNING OF LEARNING AND THE MEAN AND STANDARD DEVIATION(SD)ARE THE
AVERAGE VALUES OVER THE49TRAINING CYCLES
If so, then the decision support system can provide advice to assessors based on the clinical consensus of the several thousand expert mental-health practitioners who provided the judgements in its database.
The most important pragmatic objective for GRiST predic-tions is to minimise the numbers of patients who are placed in either the high-risk category when they are low risk or placed in the low-risk category when they are high risk. To test the ability of the MPACA for doing this, two classes of patients were extracted: those with clinical judgements below 4 and those with judgements above 6 on an integer scale from 0 to 10.
Random-forest classification [50] was one of the most successful methods applied to the GRiST data. Its precision for predicting a judgement within plus or minus one of the clinician’s judgement was 87%. This was based on 25 of the most important variables and where missing variables had imputed values. For testing the potential of the MPACA, the task was made considerably easier by predicting the most important errors: patients stated to be high risk when they were low or vice versa. However, it was based on a smaller sample using only 13 independent variables and there was no necessity to handle missing data.
The same learning and testing approach was used for the MPACA on the risk data as for the logistics data. A sample of 232 cases were used that were randomly split into 50% training and 50% test cases. The training objects were placed in the hyperdimensional space of 13 variables where the training cases also had the known clinical judgement given as an extra dimension. Ants were placed on each object and if the object was in one of the categories to learn, because the clinical-judgement value was below 4 or above 6, then the ants were assigned to the colony associated with that object. After completion of learning, the test cases were added to the hyperdimensional graph but with the clinical judgement dimension removed. Objects were assigned to the class that had the nearest centroid, as for the logistics domain.
Table III displays the initial parameter values for the 49 cycles of training and testing. Once again, the manual manip-ulation of parameters from the start value to improve classifica-tion did not alter them very much, demonstrated by the very
low standard deviation across the 49 cycles. Improvements are obviously possible if automated optimisation was used but these preliminary results show the potential for the MPACA to learn risk judgements. The mean precision, where the MPACA predictions correctly placed test objects into the low clinical risk or high clinical risk categories, was 91.2% with a standard deviation of 0.01. Although this looks like a very good result, it was made easier by only trying to detect gross errors where high and low risks are confused. Attempting to predict the exact judgement between 0 and 10 would obviously be harder but enough encouragement has been given with these initial results to make it worth pursuing.
V. CONCLUSION
This paper has described a new Ant Colony Clustering model called the Multi-Pheromone Ant Clustering Algorithm, MPACA. It was introduced in [41] as a clustering method and was tested on three data sets from the Machine Learning Repository [3]: the Iris, Wine, and Wisconsin Breast Cancer data. This paper gave an overview of the latest incarnation of the MPACA including a detailed description of the algorithm and its parameters. It is unique by having a pheromone for every attribute value of the objects in the domain space. The ants are able to link similar features of objects, to combine the features they detect depending on the frequency with which they meet other ants with the same features, and to form colonies based on local ant population densities. Together, these enable ants to learn the feature profile for different clusters and for mapping colony membership onto those clusters. Where this paper differs from the earlier one is by extending the model to classification learning as well as cluster analysis. In other words, it shows how the MPACA can be adapted for supervised learning and that it should perhaps be renamed a classification/clustering algorithm. Secondly, the paper explored how useful and effective the approach might be when applied to noisy and heterogeneous real-world data sets. These create interesting problems and this paper conducts experiments that determine whether innovations of the MPACA translate into useful outcomes.
Two data sets were used, one for logistics and one for mental health. The structure, dimensionality, and classification objectives differed widely between the two sets but the results show that the MPACA can induce and utilise patterns to produce helpful classification advice. A more stringent test was given to the algorithm for the logistics domain than the mental-health one and the application to both domains could be improved. For the logistics data, having classification decisions based on such broad categories as either above or below the mean does not provide the most interesting output to end users. They need to know how large is the deviation from the mean. In fact, the most important information is whether there will be a peak or trough in demand and the MPACA could easily be adapted to test for these by redefining classes into those where the demand exceeds a given threshold value above or below the mean. This is rather like its application to the mental-health risk data where high and low risk patients
were being discriminated. Of course, this leaves patients with judgements in between these classes without a colony and it would be useful to predict their category as well.
The machine learning regression approach in each domain predicts the actual values of outputs, not just class member-ship, which makes it more informative. Further work on the MPACA will be on how to translate the colony memberships into a similar prediction. Even with the crude assignment mechanism used in this paper, where unknown objects were classified in the class associated with the colony having the nearest multidimensional mean (centroid), it is possible to translate the relative distances from colonies into the degree of membership in the colony. The more membership in a class above or below the mean, the higher the difference between the predicted demand and the mean.
The most productive way of immediately improving the classification output of the MPACA is by using more sophisti-cated assignments of unknown objects to classes after learning. Methods currently under investigation include variants of nearest-neighbour analysis where the number of ants from different colonies is calculated for all nodes within a given radius of the object to be classified. The relative proportions of colony populations can be translated into a probability of class membership using a simple Bayes equation. Alternatively, sophisticated probability density functions could be used as input to the Bayesian probability calculations.
There are many avenues requiring exploration for the MPACA model itself, both with the general mechanism and its parameterisation. At the time of writing, there are problems with merging colonies because domains with multiple clusters eventually merge into just two. Somewhere in the learning and merging process, an optimal configuration will have been achieved but it is not easy to know when; some form of dynamic equilibrium should happen and it should also be detectable so that it is clear when learning has reached an optimum end point.
Parameters are an important influence on the model’s oper-ation and more needs to be discovered about how they exert their influence so that performance can be improved. The cur-rent method is slow and cumbersome, requiring manual setting of parameters, observation of performance, and a new run with adjusted parameters in accordance with conclusions from the observations. A hill-climbing approach where paramters are systematically adjusted to reduce classification errors after learning is the obvious next step. The problem is that ACO methods are computationally expensive and time consuming, requiring careful optimisation of the MPACA code to generate the necessary execution speed.
An important guideline to remember for future research on the MPACA is to avoid chasing performance optimisation without understanding how it is being achieved. Otherwise the particular qualities of the MPACA could be lost or diluted, with improvements failing to come from the metaphor that has motivated the research in the first place.
REFERENCES
[1] C. Blum and D. Merkle, eds, “Swarm intelligence: Introduction and applications”. Springer, 2008.
[2] J.R.J. French and B. M. Ahmed, “The challenge of biomimetic design for carbon-neutral buildings using termite engineering,”Insect Science, vol. 17, no. 2, pp. 154-162, Feb 2010.
[3] K. Bache and M. Lichman. UCI Machine Learning Repository [http://archive.ics.uci.edu/ml]. Irvine, CA: University of California, School of Information and Computer Science, 2013.
[4] S. Gueron, S. A. Levin, and D. I. Rubenstein, “The dynamics of herds: From individuals to aggregations,” Journal of Theoretical Biology, vol. 182, no. 1, pp. 85-98, Sep. 1996.
[5] J.K. Parish and W.M. Hamner, eds. “Animal Groups in Three Dimensions, How Species Aggregate”. Cambridge University Press, 1997.
[6] J. D. Murray,Mathematical Biology: I. An Introduction (Interdisciplinary AppliedMathematics) (Pt. 1), 3rd ed., New York, Springer, Jan. 2007. [7] M. Dorigo, M. Birattari, and T. Stutzle, “Ant colony optimization,”IEEE
Computational Intelligence Magazine, vol. 1, no. 4, pp. 28-39, Nov. 2006 [8] J. L. Deneubourg, S. Goss, N. Franks, A. S. Franks, C. Detrain, and L. Chr´etie, “The dynamics of collective sorting robot-like ants and ant-like robots,” inProceedings of the first international conference on simulation of adaptive behavior on From animals to animats.Cambridge, MA, USA: MIT Press, 1990, pp. 356-363.
[9] M. Dorigo, “Optimization, learning and natural algorithms,” Ph.D. Thesis, Politecnico di Milano, Italy, 1992
[10] A. Dussutour, S.C. Nicolis, G. Shephard, M. Beekman, and D.J.T. Sumpter, “The role of multiple pheromones in food recruitment by ants,” The Journal of Experimental Biology, vol. 212, no. 15, pp. 2337-2348, Aug. 2009.
[11] W. Ngenkaew, S. Ono and S. Nakayama, “Pheromone-based concept in Ant Clustering,” in Proceedings 3rd International Conference on Intelligent System and Knowledge Engineering, ISKE 2008, vol. 1, 17-19 Nov. 2008, pp. 308-312.
[12] M. Middendorf, F. Reischle, and H. Schmeck, “Multi colony ant algorithms,” in emphJournal of Heuristics, vol. 8, no. 3, pp. 305-320, May 2002.
[13] M. Guntsch “Ant Algorithms in Stochastic and Multi-Criteria Environ-ments,” Ph.D. Thesis, Institut AIFB, University of Karlsruhe, Germany, 2004
[14] O.A. Mohamed Jafar and R. Sivakumar, “Ant-based Clustering Algo-rithms: A Brief Survey,”International Journal of Computer Theory and Engineering, vol. 2, no. 5, pp. 1793-8201, October 2010.
[15] N. Labroche, N. Monmarch´e and G. Venturini, “A New Clustering Algorithm Based on the Chemical Recognition System of Ants,” in Procceedings of 15th European Conference on Artificial Intelligence (ECAI2002), Lyon France, 2002, pp. 345-349.
[16] N. Labroche, F.J. Richard, N. Monmarch´e, A. Lenoir and G. Venturini, “Modelling of the Chemical Recognition System of Ants.” [Online]. Available: http://hant.li.univ-tours.fr/webhant/pub/LabRicMonLenVen02a.iwsoesb.pdf
[17] D. Zaharie and F. Zamfirache “Dealing with noise in ant-based clus-tering,” inProceedings of IEEE Congress on Evolutionary Computation, Edinburgh, UK, 2-5 Sept. 2005, pp. 2395-2401.
[18] X-C. Liang, S-F. Chen and Y. Liu, “The study of small enterprises credit evaluation based on incremental AntClust,” inProceedings of the IEEE International Conference on Grey Systems and Intelligent Services, GSIS 2007, Nanjing, China, 18-20 Nov. 2007, pp. 294-298.
[19] H.H. Inbarani and K. Thangavel, “Clickstream Intelligent Clustering using Accelerated Ant Colony Algorithm,” in Proceedings of the In-ternational Conference on Advanced Computing and Communications, ADCOM 2006Surathkal, India, 20-23 Dec. 2006 pp. 129-134. [20] C. Bertelle, A. Dutot, F. Guinand and D. Olivier, “Organization
De-tection Using Emergent Computing,” in International Transactions on Systems Science and Applications (ITSSA), vol. 2, no. 1, pp. 61-69, 2006. [21] V. Ramos, F. Muge and P. Pina. “Self-Organized Data and Image Retrieval as a Consequence of Inter-Dynamic Synergistic Relationships in Artificial Ant Colonies,” inProceedings of Soft Computing Systems: Design, Management and Applications, 2nd Int. Conf. on Hybrid Intelli-gent Systems, AEB02,IOS Press, Frontiers of Artificial Intelligence and Applications, vol. 87, pp. 500-509, Amsterdam, Dec 2002.
[22] I. El-Feghi, M. Errateeb, M. Ahmadi and M. A. Sid-Ahmed, “An adaptive ant-based clustering algorithm with improved environment per-ception,” inProceedings of the 2009 IEEE international conference on
Systems, Man and Cybernetics, SMC 2009, San Antonio, Texas, USA, 11-14 Oct. 2009, pp. 1431-1438.
[23] M. Kothari, S. Ghosh and A. Ghosh, “Aggregation Pheromone Density Based Clustering,” inProceedings of the 9th International Conference on Information Technology (ICIT ’06), IEEE Computer Society, Washington, DC, USA, 18-21 Dec. 2006, pp. 259-264.
[24] P.S. Shelokar, V.K. Jayaraman, and B.D. Kulkarni, “An ant colony approach for clustering,” inAnalytica Chimica Actavol. 509, no. 2, pp. 187-195, 2004
[25] H. Jiang and S. Chen, “A new ant colony algorithm for a general clustering,” inProceedings of the IEEE International Conference on Grey Systems and Intelligent Services 2007, GSIS 2007, Nanjing, China, 18-20 Nov. 2007, pp. 1158-1162.
[26] H. Yang, X. Li, C. Bo and X. Shao, “A Graphic Clustering Algorithm Based on MMAS,” inProceedings of the IEEE Congress on Evolutionary Computation, CEC 2006Vancouver, BC, Canada, 11 September 2006 , pp. 1592-1597.
[27] R.S. Parpinelli, H.S. Lopes, and A.A. Freitas, “Data mining with an ant colony optimization algorithm,” inIEEE Transactions on Evolutionary Computation, vol. 6, no. 4, pp. 321-332, Aug 2002.
[28] R.S. Parpinelli, H.S. Lopes, and A.A. Freitas, “An Ant Colony Based System for Data Mining: Applications To Medical Data,” inProceedings of the Genetic and Evolutionary Computation Conference (GECCO-2001), L. Spector, E. D. Goodman, A. Wu, W. B. Langdon, H. M. Voigt, M. Gen, S. Sen, M. Dorigo, S. Pezeshk, M. H. Garzon, and E. Burke, Eds. San Francisco, California, USA: Morgan Kaufmann, Jul-Nov 2001, pp. 791-797
[29] D. Martens, M. De Backer, R. Haesen, J. Vanthienen, M. Snoeck, and B. Baesens, “Classification with ant colony optimization,” inIEEE Transactions on Evolutionary Computation, vol. 11, no. 5, pp. 651-665, 2007.
[30] D. Elizondo, “The linear separability problem: some testing methods,” inIEEE Transactions on neural networks, vol. 17, no. 2, pp. 330-344, 2006.
[31] J. Handl, J. Knowles, and M. Dorigo, “On the performance of ant-based clustering,” inProceedings of the Third International Conference on Hybrid Intelligent Systems, IOS Press, Frontiers in Artificial Intelligence and Appliations, vol. 104, 2003, pp. 204-213.
[32] Y. Sasaki (2007, October) “The truth of the F-measure,” [Online]. Available: http://www.toyota-ti.ac.jp/Lab/Denshi/COIN/people/yutaka.sasaki/index-e.html
[33] X.F. Huang, Y. Yang and X. Niu “Towards Improving Ant-Based Clustering - An Chaotic Ant Clustering Algorithm,” in Procedings of the International Conference on Computational Intelligence and Security Workshops, CISW ’07, Harbin, China, 15-19 Dec. 2007, pp. 421-424. [34] Y. Yang and M. Kamel, “Clustering ensemble using swarm intelligence,”
inProceedings of the 2003 IEEE Swarm Intelligence Symposium, SIS ’03, 24-26 April 2003, pp. 65-71.
[35] Q-M. Rong, W-C. Wu and L. Li, “Research on Hybrid Clustering Based on Density and Ant Colony Algorithm,”Proceedings of the Second International Workshop on Education Technology and Computer Science,
ETCS ’10, Wuhan, China, 6-7 March 2010, vol. 2, pp. 222-225. doi: 10.1109/ETCS.2010.42
[36] R. Chandrasekar, V. Vijaykumar and T. Srinivasan, “Probabilistic ant based clustering for distributed databases,” in Proceedings of the 3rd International IEEE Conference Intelligent Systems, 2006, London, UK, Sept 2006, pp. 538-545.
[37] C.D. Buckingham, “Psychological cue use and implications for a clin-ical decision support system,” Medical Informatics and the Internet in Medicine, vol. 27, no. 4, pp. 237-251, 2002.
[38] C.D. Buckingham, A. Ahmed, and A.E. Adams, “Using XML and XSLT for flexible elicitation of mental-health risk knowledge,”Medical Informatics and the Internet in Medicine, vol. 32, no. 1, pp. 65-81, 2007. [39] S.E. Hegazy and C.D. Buckingham, “A Method for Automatically Eliciting node Weights in a Hierarchical Knowledge Based Structure for Reasoning with Uncertainty,”International Journal On Advances in Software, vol. 2, no. 1, pp. 76-85, 2009.
[40] P. G. Welch and Z. Kemeny and A. Ekart and E. Ilie-Zudor, “Application of model-based prediction to support operational decisions in logistics networks”. In Proc. AILog, ECAI, 2012.
[41] J. Chircop and C. D Buckingham. A Multiple Pheromone Ant Clustering Algorithm. Proceedings of NICSO 2013, to be published in Studies in Computational Intelligence, Springer, 2013.
[42] C. D. Buckingham and P. Buijs and P. G. Welch and A. Kumar and A. Ahmed, “Developing a cognitive model of decision-making to support members of hub-and-spoke logistics networks”. In Proceedings of the 14th International Conference on Modern Information Technology in the Innovation Processes of the Industrial Enterprises, Eds. Elisabeth Ilie-Zudor, Zsolt Kem´eny, L´aszl´o Monostori, pp 14-30, 2012. [Online]. Avail-able: igor.xen.emi.sztaki.hu/mitip/media/MITIP2012 proceedings.pdf [43] C. D. Buckingham, A. E. Adams, and C. Mace, “Cues and knowledge
structures used by mental-health professionals when making risk assess-ments”.Journal of Mental Health, vol. 17, no. 3, pp. 299314, 2008. [44] C. D. Buckingham and A. Adams, “The grist web-based decision
support system for mental-health risk assessment and management”. In Proceedings of the First BCS Health in Wales/ehi2 joint Workshop, pp. 3740, 2011.
[45] G. Zapfel and M. Wasner, “Planning and optimization of hub-and-spoke transportation networks of cooperative third-party logistics providers”. International Journal of Production Economics, 78(2), pp. 207 220, 2002. DOI: 10.1016/S0925-5273(00)00152-3.
[46] B. MacCarthy and J. Wilson, eds, “Human Performance in Planning and Scheduling”. Taylor & Francis, URL: http://books.google.com/books?id=0wBLHGX1 WIC, 2001.
[47] J. Schumacher and K. Feurstein, “Proceedings of the 3rd European conference on ICT for Transport Logistics”. URL: http://www.ecitl.eu/. 2010.
[48] ADVANCE (last accessed, July 2013), ADVANCE: Advanced predictive-analysis-based decision-support engine for logistics. URL: http://www.advance-logistics.eu/.
[49] GRiST (last accessed, July 2013), Galatean Risk and Safety Tool. URL: http://www.egrist.org/.