Comparing the Capabilities of SVMC and MLC Using
Contingency Matrix and a Novel Template
Innocent Chukwukalo Ezeomedo1 & Joel Izuchukwu Igbokwe2
1. Department of Environmental Management, Chukwuemeka Odumegwu Ojukwu University (COOU), Uli Campus, Nigeria.
2. Department of Surveying & Geoinformatics, Nnamdi Azikiwe University (NUA), Awka, Nigeria. Abstract
Since extraction of useful information from remote sensing data is important, scientists manage to propose efficient algorithms for automatic extraction of constructive information from the satellite imageries. To date, image classification has benefitted from advancements in improved computational power and algorithm development. Therefore, Satellite image classification using GeoEye-1, High Resolution Satellite Image (HRSI) of 2016, Support Vector Machine Classifier (SVMC) and Maximum Likelihood Classifier (MLC) were performed with a view to comparing the capabilities of SVMC and MLC using Post-processing Accuracy Assessment (PAA) and a Novel Template in producing urban land use and land cover map of the area. The objectives include performing supervised classification using SVM and MLC in ENVI Software, analysing the performance of SVM and MLC in mapping geometric features using error matrix and a new template. The methodology used comprise Image acquisition, Image enhancement, Image Sub-setting, Extraction of Regions of Interests (ROIs) and its separability index analysis, supervised classification using SVMC and MLC, Post-Processing Accuracy Assessment, Statistical Analyses, and Preparation of maps. ENVI 5.1 software was used for image processing, masking, spatial data analysis and classification. Microsoft Excel, GraphPad Prism ver.7.0 and IBM SPSS ver.21 were used for statistical analysis. The result of image classification indicates that Nnewi-North L.G.A is having 13.52% of Built-up Areas, 24.23% of Vegetation, 22.05% of Water bodies, Farm lands is equal to 39.40% and open/bare surface is 0.81% using SVMC while MLC result shows that Built-up Areas is14.99%, Vegetation is 13.01%, Water bodies is 34.08%, Farm lands is 36.00% and open/bare surface is 1.32%. Error Matrix and Kappa Coefficient results revealed that SVMC is better than MLC as follows (SVMC overall Accuracy is 98.07% and Kappa Coefficient is 0.97 while MLC overall Accuracy is 82.50% and Kappa Coefficient is 0.76. Additional statistical testing with aggregate mean from SVM and MLC was used to determine the significance of the mean difference using the researcher’s developed template called “Post Confusion Matrix” (PoCoMa). The result showed that the t-statistics is 0.670 with probability value of -0.476 which is greater than 0.05, thus, the null hypothesis was accepted with a deduction that using any of the algorithms (SVM and MLC) yields no significant difference in performance and efficiency of result of the map produced. The overall study revealed that both classifiers are efficient and accurate statistically, without any significant difference but using error matrix analysis, the research revealed that ‘Support Vector Machine Classifier’ is robust in extracting urban landscape from HRSI, especially Built-up areas and open/bare surfaces. The research recommends there is need for periodic urban LULC analysis to guide stakeholders in Planning, Monitoring, and Management of ‘Urban Areas’ among others.
Keywords: Support Vector Machine Classifier (SVMC), Maximum Likelihood Classifier (MLC), Post Confusion Matrix (PoCoMa), High Resolution Satellite Image (HRSI), ENVI 5.1 software, and GraphPad Prism ver.7.0. DOI: 10.7176/JIEA/9-4-06
Publication date:June 30th 2019
1. Introduction
In the recent decades, remote sensing imagery makes the monitoring of the earth surface and atmosphere possible. As the technology of the imagery sensors has improved, the remote sensing images with higher quality have become available. To effectively derive reliable information from satellite data, appropriate classification techniques are essential. A number of classification approaches have been developed over the past decades and a review of these algorithms can be found in Lu and Weng (2007). In this regard, support vector machine, originally based on binary function, is viewed as one of the new ways of improving classification accuracies in remote sensing studies (Foody & Mathur, 2004a; Huang et al., 2007). This is because support vector machine (SVM) has the tendency to minimize classification error by minimizing the probability of misclassifying field data drawn
statistical learning algorithms that have not been extensively exploited in the geospatial science community, (Shi and Yang, 2012). However, processing large images through the SVM classifier is time-consuming at high resolution, so ENVI's SVM provides a hierarchical, reduced-resolution classification process that improves performance without significantly degrading results. It is most effective when operating in areas that contain homogenous features, such as water bodies, parking lots, and fields.
Furthermore, Maximum-Likelihood Classifier (MLC) and Mahalanobis Distance (MD) classifiers are usually regarded as the classic and most widely used supervised classification for satellite images resting on the statistical distribution pattern (Sohn and Rebello 2002). Both classifiers can show less satisfactory successes because their assumption that the data follow Gaussian distribution may not always be held in complex areas (Kapoor, Mehta, Esper, Poljsak-Prijatelj, Quan, Qaisar, Delwart, and Lipkin, 2010; Xie, Sha, and Yu 2008). The advantage of the MLC as a parametric classifier is that it takes into account the variance covariance within the class distributions and for normally distributed data, the MLC performs better than the other known parametric classifiers (Erdas, 1999). However, for data with a non-normal distribution, the results may be unsatisfactory. The first step in the classification process was the development of the classification scheme. The land cover classification scheme consisting of eight main land cover classes (mixed forest, degraded forest, herbaceous wetlands, shrub wetlands, grassland, grassland (open), mixed farmland and water (open) they are developed based on the land cover classification system (FAO, 2005). Maximum likelihood classification assumes that the statistics for each class in each band are normally distributed and calculates the probability that a given pixel belongs to a specific class. Unless you select a probability threshold, all pixels are classified. Each pixel is assigned to the class that has the highest probability (that is, the maximum likelihood). If the highest probability is smaller than a threshold you specify, the pixel remains unclassified. ENVI implements maximum likelihood classification by calculating the following discriminant functions for each pixel in the image (Richards, 1999).
The new generation of machine learning algorithms takes their inspiration from statistical learning theory (Gunn, 1998) and it has changed over time. The fundamental theory of linear classifiers, like support vector machines, dates back to the 1930’s however the work of Rosenblatt (1956) introduced the perception of which the support vector machines is based. Linear large margin classifiers which are the simplest form of the support vector machines have been developed by several researchers, examples can be seen in the work by Vapnik and Lerner in 1963 and a similar paper by Mangasarian in 1965. Generalization of linear large margin classifiers to the nonlinear case can be found in the work of (Boser, Guyon, and Vapnik, 1992). SVM are based on a principle from computational learning theory which is called structural risk minimization principle. In machine learning, support vector machines are supervised learning models with associated learning algorithms that can analyze data and recognize patterns, used for classification and regression analysis. SVMs are systems for efficiently training the linear learning machines in the kernel-induced feature space (Cristianini and Shawe-Taylor, 2000). The first explanation was given by the Vapnik-Chervonenkis (VC) theory1, followed by the theory of large margin classifiers, data dependent structural risk minimization, among others. In computer science, the VC-theory and parts of the theory of large margin classifiers is called PAC-theory (Probably Approximately Correct).
Since extraction of useful information from remote sensing data is important; scientists worldwide have manage to propose efficient algorithms for automatic extraction of constructive information from the satellite imageries. Real-world applications especially in the areas image classification has benefitted from advancements in improved computational power and algorithm development. Therefore, Satellite image classification using GeoEye-1, High Resolution Satellite Image (HRSI) of 2016, Support Vector Machine Classifier (SVMC) and Maximum Likelihood Classifier (MLC) were performed with a view of comparing the capabilities of SVMC and MLC using Post-processing Accuracy Assessment (PAA) and a Novel Template in producing urban land use and land cover map of the area. The objectives include performing supervised classification using SVM and MLC in ENVI Software, analysing the performance of SVM and MLC in mapping geometric features using error matrix and a new template. The success of the SVM depends on how well the process is trained thus Regions of interests (ROIs) was used to train the HRSI and result was compared with that of maximum likelihood classifier.
2. The Study Area
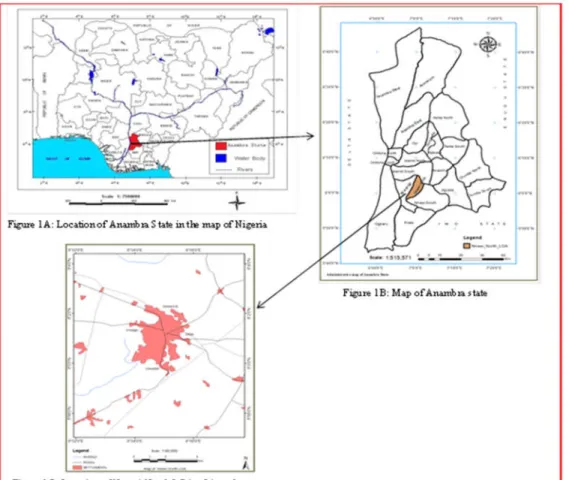
The study area for this research is Nnewi North Local Government Area of Anambra state, South-Eastern region Nigeria, created in 1996 from old Nnewi Local Government Area, spans over 1,076 square miles (2789km2), lying about 25km south of Onitsha in Anambra state, (Amanze, Ezeh and Okoronkwo, 2015). It is located between latitudes 5°59' 41.64''N and 6°03' 28.44''N and longitudes 6°03' 28.44''E and 6°52' 41.64''E (Figure1A), bounded in the north by Idemili South, South West by Ekwusigo, and South East by Nnewi South L.G.As of Anambra State
( Figure1B). The study area is also known as Nnewi Nnewi urban and consists of four large villages (Quarters); Otolo, Umudim, Nnewichi and Uruagu (Figure 1C).
Figure 1: Location of the Study Area
The local government headquarters is located at Umudim; the famous Nkwo market is sited at Uruagu; the Nnamdi Azikiwe University Teaching hospital is situated at Nnewichi while most of the major industries in Nnewi urban area are located at Otolo quarter, (Obeta, 2015). The area witnesses 2 distinctive climatic changes in a year, the dry season and rainy season, with a maximum temperature of 34oC and minimum temperature of 24oC. It has a topical climate influenced by two major trade winds, the warm moist south west trade winds during rainy season (April-October) and the northeast trade wind during dry and dust harmattan (November – march), (U-N Habitat, 2009). The study area falls within the tropical rainforest zone of West Africa, characterized by presence of many tree species types with the dominant of oil palm trees. This vegetation however, degraded by over 30 years of infrastructural development, aggressive industrial and urbanization processes, (Orjiako and Igbokwe, 2009, Phil-Eze 2010).
2.1 The Socio-Economic Status of the area
The traditional monarch of Nnewi is called the Igwe. The present Igwe is his Royal Highness Igwe Kenneth Orizu III, who presides over the affairs of Nnewi. Otolo, a premiere quarter of the four quarters in Nnewi has been outstanding in all aspect of human endeavours. In it seated the mantle of leadership that governs Nnewi in consideration with the Obis of the other quarters for the past decades. Its central success is figured in commercial trade but not limited to it, as its cultural heritage has always been the beacon of light to other neighbouring village, (Ogbuagu, Okoli, Oguoma, Ogbuagu 2010).
and farming. Most of the prime cash crops produced include; oil palm, raffia palm, groundnut, melon, cotton, cocoa, rubber, maize etc. food crops such as yam, cassava, cocoyam, bread fruit, three-leaf yam etc. Nnewi is home to many agro-allied, automobile and manufacturing industries (Amanze et al., 2015, Anambra RHFA Report, 2013). Landuse within the area is not orderly and varies between residential, commercial, industrial and cultural types with each type dominating according to the perceived interest of the landowners, (Phil-Eze 2010).
Nnewi is said to be the second largest economic hub of Anambra state after Onitsha and one of the largest in West Africa, (Brautigam 1997, Orji and Obasi, 2012). Together with Aba and Onitsha, Nnewi forms part of the eastern Nigeria’s “New industrial axis”. Industrialization of the town began around 1970 when Nnewi motor parts traders began marketing their own brand name products instead of the reproductions of "original" parts (Anthony, 2009). The inhabitants are predominantly traders and manufacturers of auto and auto spare parts. It plays a leading role as a centre for the assembly and distribution of motorbikes, spare-parts and other business activities in Nigeria. It has institutions like: Nnamdi Azikiwe University Teaching hospital, Nnewi; College of Health Sciences Nnewi, Odumegwu Ojukwu Polytechnic, Ezinifite, Nnewi South among others, (Anigbogu, Onwuteaka, Edokon and Okoli, 2014).
3. Materials and Methods
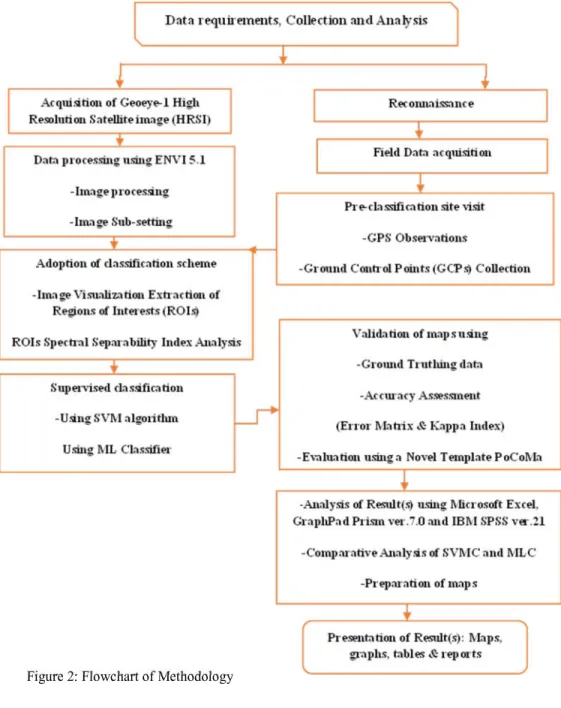
Satellite image classification using GeoEye-1, High Resolution Satellite Image (HRSI) of 2016, Support Vector Machine Classifier (SVMC) and Maximum Likelihood Classifier (MLC) were performed with a view of comparing the capabilities of SVMC and MLC using Post-processing Accuracy Assessment (PAA) and a Novel Template (PoCoMa) in producing urban land use and land cover map of the area. Figure 2: Flow chart of Methodology illustrates the stages involved.
3.1 Data used
The Administrative map of Nigeria, Anambra State and Nnewi North LGA was obtained from office of the Surveyor General of the Federation (SGoF) and was modified by the author in the Remote Sensing and GIS Laboratory, Department of Environment Management, Chukwuemeka Odumegwu Ojukwu University, (2017). Topographical map of study area (published in 1964) was obtained from the Ministry of Surveys and Town Planning, Awka, these data were used mainly for locational description of the study area. While High Resolution Satellite image of Nnewi North LGA (GeoEye-1 Image of 2016) was obtained from DigitalGlobe online in ECW format (Enhanced Compressed Wavelet; a proprietary data format developed by Earth Resource Mapping that is primarily intended for aerial imagery); used supervised image analysis. Microsoft Excel, GraphPad Prism ver.7.0 and IBM SPSS ver.21 were used for statistical analysis.
3.2 Image processing
The methodology used include Image acquisition, Image enhancement, Image Sub-setting, Extraction of Regions of Interests (ROIs) and its separability index analysis also called Bhattacharya distance analysis, supervised classification using SVMC and MLC, Post-processing Accuracy Assessment, Statistical Analyses, and Preparation of maps. ENVI (Environment for visualizing images) (ENVI 5.1) software was used for image processing, masking, spatial data analysis and classification. Microsoft Excel, GraphPad Prism ver.7.0 and IBM SPSS ver.21 were used for statistical analysis, (Figure 2). Firstly, the five Regions of interests (ROIs) were adopted. The selected ROIs were then export to the n-D Visualizer to see the distribution of the points within and between the ROIs. This option is useful for checking the separability of adopted classes before using ROIs as input into supervised classifications. This was now necessary because for good classification results using these ROIs, the groups of pixels for the different ROIs should be separate from each other and should not overlap, thereafter, Image classification and Post-processing, including ground truthing/field verification and Computation of the error matrix to assess accuracy of the job.
4. Result Presentation and Discussion
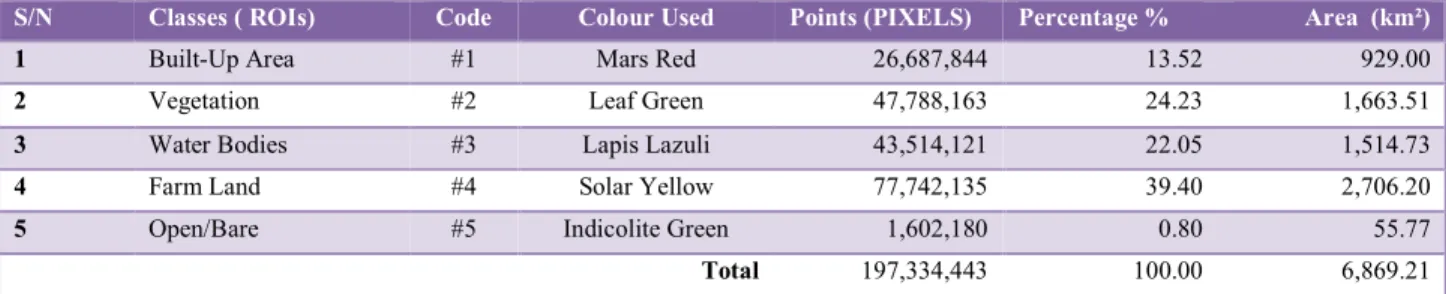
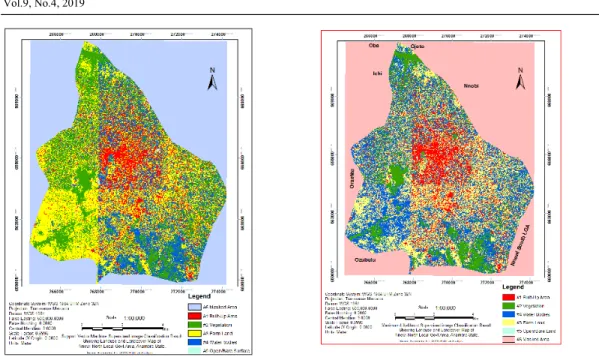
The result of supervised classification image using SVMC and MLC indicates that Nnewi-North L.G.A is having 13.52% of Built-up Areas, 24.23% of Vegetation, 22.05% of Water bodies, Farm lands is equal to 39.40% and open/bare surface is 0.81% using SVMC while MLC result shows that Built-up Areas is 14.99%, Vegetation is 13.01%, Water bodies is 34.08%, Farm lands is 36.00% and open/bare surface is 1.32%. Error Matrix and Kappa
Coefficient results revealed that SVMC is better than MLC as follows (SVMC overall Accuracy is 98.07% and Kappa Coefficient is 0.97 while MLC overall Accuracy is 82.50% and Kappa Coefficient is 0.76. Additional statistical testing with aggregate mean from SVM and MLC was used to determine the significance of the mean difference using the researcher’s developed template called “Post Confusion Matrix” (PoCoMa). The result showed that the t-statistics is -0.439 with probability value of 0.670 which is greater than 0.05, thus, the null hypothesis was accepted with a deduction that using any of the algorithms (SVM and MLC) yields no significance difference in performance and efficiency of result of the map produced.
Table 1: SVM Confusion Matrix (Contingency Matrix) table
Overall Accuracy = (328811760/335285600) =98.07%, Kappa Coefficient = 0.97
Table 2: SVM Summary results comprising the masked area
Table 3: SVM classification Resultexcluding the masked area SVM Classified Classes Ground Truth Unclassified Masked Pixels
Built-up Vegetation Water bodies Farmland Open space Total Error of Commission User’s accuracy Unclassified 0 0 0 0 0 0 0 0 0 0.00 Masked Pixels 0 137951157 0 0 0 0 0 137951157 0 100.00 Built-up 0 0 24020339 0 39843 1576383 1051279 26687844 0.17 99.83 Vegetation 0 0 1015532 21779789 23473652 1519190 0 47788163 10.24 89.76 Water bodies 0 0 1325752 3895335 30825253 7467781 0 77742135 1.50 98.50 Farmland 0 0 0 371737 0 43142384 0 43514121 0.85 99.15 Open space 0 0 0 0 0 0 1602180 1602180 0.00 100.00 Total 0 137951157 27047015 44475019 76854936 47355293 1602180 335285600 Error of Omission 0 0 1.50 3.55 0.36 8.90 0.00 Producer’s accuracy 0.00 100.00 98.50 96.45 99.64 91.10 100.00
S/N Classes ( ROIs) Code Colour Used Points (PIXELS) Percentage % Area (km²)
1 Unclassified 0 black 0.000 0.00000 0.00
2 Built-Up Area #1 Mars Red 26,687,844 7.960 929.00
3 Vegetation #2 Leaf Green 47,788,163 14.253 1,663.51
4 Water Bodies #3 Lapis Lazuli 43,514,121 12.978 1,514.73
5 Farm Land #4 Solar Yellow 77,742,135 23.187 2,706.20
6 Open/Bare #5 Indicolite Green 1,602,180 0.478 55.77
7 Masked Pixels #6 White/Pink 137,934,677 41.139 4,801.51
Total 335,285,600 99.995 11,670.72
S/N Classes ( ROIs) Code Colour Used Points (PIXELS) Percentage % Area (km²)
1 Built-Up Area #1 Mars Red 26,687,844 13.52 929.00
2 Vegetation #2 Leaf Green 47,788,163 24.23 1,663.51
3 Water Bodies #3 Lapis Lazuli 43,514,121 22.05 1,514.73
4 Farm Land #4 Solar Yellow 77,742,135 39.40 2,706.20
5 Open/Bare #5 Indicolite Green 1,602,180 0.80 55.77
Table 4: MLC Confusion Matrix (Contingency Matrix) table
ML: Overall Accuracy = (276605139/335285600) 82.4984% and Kappa Coefficient = 0.7626
Table 5: MLC Result including the masked area
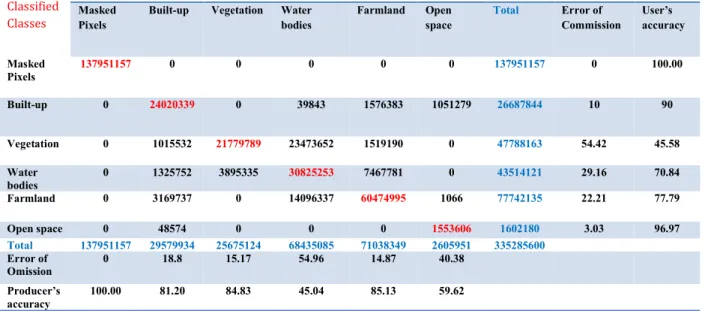
Table 6: MLC Result excluding the masked area MLC
Classified Classes
Ground Truth (Pixels) Masked
Pixels
Built-up Vegetation Water bodies Farmland Open space Total Error of Commission User’s accuracy Masked Pixels 137951157 0 0 0 0 0 137951157 0 100.00 Built-up 0 24020339 0 39843 1576383 1051279 26687844 10 90 Vegetation 0 1015532 21779789 23473652 1519190 0 47788163 54.42 45.58 Water bodies 0 1325752 3895335 30825253 7467781 0 43514121 29.16 70.84 Farmland 0 3169737 0 14096337 60474995 1066 77742135 22.21 77.79 Open space 0 48574 0 0 0 1553606 1602180 3.03 96.97 Total 137951157 29579934 25675124 68435085 71038349 2605951 335285600 Error of Omission 0 18.8 15.17 54.96 14.87 40.38 Producer’s accuracy 100.00 81.20 84.83 45.04 85.13 59.62
S/N Classes ( ROIs) Code Colour Used Points (PIXELS) Percentage % Area (km²)
1 Unclassified 0 black 0.000 0.00000 0.00
2 Built-Up Area #1 Mars Red 29,579,934 8.822 1029.678
3 Vegetation #2 Leaf Green 25,675,124 14.253 893.751
4 Water Bodies #3 Lapis Lazuli 68,435,085 12.978 2382.225
5 Farm Land #4 Solar Yellow 71,038,349 21.187 2472.845
6 Open/Bare #5 Indicolite Green 2,605,951 0.777 90.713
7 Masked Pixels #6 White/Pink 137,951,157 41.144 4802.079
Total 335,285,600 99.999 11,671.291
S/N Classes ( ROIs) Code Colour Used Points (PIXELS) Percentage % Area (km²)
1 Built-Up Area #1 Mars Red 29,579,934 14.98 1,029.678
2 Vegetation #2 Leaf Green 25,675,124 13.01 893.751
3 Water Bodies #3 Lapis Lazuli 68,435,085 34.68 2,382.225
4 Farm Land #4 Solar Yellow 71,038,349 36.00 2,472.845
5 Open/Bare #5 Indicolite Green 2,605,951 1.32 90.713
Figure 3a: SVMC Figure 3b: MLC
Figure 3: Result of Image Classification (a) SVMC (b) MLC
Figure 4: SVMC against MLC showing the Percentage of Nnewi-North LULC
4.1 Post Confusion Matrix (PoCoMa) Statistical Analyses
ENVI can calculate a confusion matrix (contingency matrix) using either a ground truth image or using ground truth ROIs. In each case, an overall accuracy, producer and user accuracies, kappa coefficient, confusion matrix, and errors of commission and omission are reported (the result of confusion matrix used in this section was computed during classification validation, see table 1 and 4. The researcher observed that to analyse the performance of SVMC and Maximum Likelihood Classifier (MLC) in mapping geometric features using overall accuracies and Kappa Statistical Procedures will not totally satisfactory and therefore created more testing parameters (table 8) from their contingency matrix and kappa coefficient, the behavours of the classifiers during image classification. The researcher developed a “Post Confusion Matrix” (PoCoMa) formula from the
contingency matrix, kappa coefficient and the behavours of the image classifiers used for computing and comparing their capabilities. The values obtained were tested using t-statistics (Paired Samples Test) using GraphPad Prism and SPSS statistical software. To analyse the performance of SVM and Maximum Likelihood Classifier (MLC) in mapping geometric features using developed “Post Confusion Matrix” (PoCoMa) template” was analyed as follows:
i. Train your satellite image to obtain ROIs and Ground Truth Image. In these study five classes of ROIs was adopted.
ii. Use the obtain ROIs (representative sample) and Ground Truth Image to perform image classification using any algorithm or classifier of your choice. In this study SVMC and MLC was used.
iii. Perform error matrix and kappa coefficient analysis. This was done to obtain the following: User’s Accuracy, Producer's Accuracy, Error of Omission, Error of Commission and Kappa Coefficient value. iv. The results from (iii) above, error matrix and kappa coefficient analysis was recomputed using the
Developed “Post Confusion Matrix” (PoCoMa) template, this is to obtain the mean average of the summation of the following: all Classes of Interest, User Accuracy, Producer's Accuracy, Error of Omission and Error of Commission.
v. Incorporates the results from (iv) above, in “Post Confusion Matrix” (PoCoMa) table with the conditions that may surround the image classification, for instance, type of classifier used (Support Vector Machine (SVM), Maximum Likelihood (ML), Neural Network (NNC), Bayesian Network (BA), K-Nearest Neigbour (KNN) among numerous others, Rule Base of the software used, the study used ENVI rule base for supervised classification., Time or Speed of accomplishing the task of classification, The memory space taken in the whole process of image analysis and classification Divided by 3600, and was the classification process supervised or unsupervised classification? If it is supervised code it 1 and if unsupervised classification let the code be 0.
vi. Subject the whole parameters to Statistical test. This is to compute the aggregate mean performance properties of classifiers use which must about two in number. In this study, the PoCoMa template was used for computing and comparing their capabilities SVMC and MLC. The values obtained were tested using t-statistics (Paired Samples Test) using GraphPad Prism and SPSS statistical software.
vii. Accept or Reject the Null or Alternate Postulated statement, according to the outcome of the Hypotheses viii.Present your Results.
Table 8: Post Confusion Matrix (PoCoMa) Parameters
S/N PARAMETERS CODE DESCRIPTIONS
1 OA OVERALL ACCURACY
2 KC KAPPA COEFFICIENT
3 UA USER ACCURACY
4 PA PRODUCER'S ACURRACY (AVERAGE VALUE)
5 EOO ERROR OF OMISSION (AVERAGE VALUE)
6 EOC ERROR OF COMMISSION (AVERAGE VALUE)
7 SPD SPEED/TIME (DIVIDED BY 3600)
8 SP SPACE/MEMORY
9 RB RULE BASED
10 SV SUPERVISED
11 ROI REGION OF INTERESTS (ROIs)
12 COI CLASSES OF INTEREST (AVERAGE VALUE)
From the above designed parameters (Table 8) the researcher developed a “Post Confusion Matrix” (PoCoMa) formula that was used for computing and comparing the capabilities of different image classifier. The values obtained were tested using t-statistics (Paired Samples Test) where GraphPad Prism version 7.0 and with SPSS version 21 statistical software was employed for the data analyses.
Table 9: Researcher developed “Post Confusion Matrix” (PoCoMa) tested using MLC Error Matrix result MLC Overall Accuracy = (276605139/335285600) 82.4984% and Kappa Coefficient = 0.7626
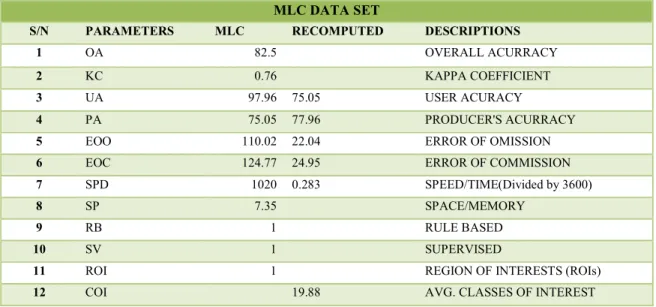
Table 10: Developed “Post Confusion Matrix” (PoCoMa) MLC Result Table
MLC DATA SET
S/N PARAMETERS MLC RECOMPUTED DESCRIPTIONS
1 OA 82.5 OVERALL ACURRACY
2 KC 0.76 KAPPA COEFFICIENT
3 UA 97.96 75.05 USER ACURACY
4 PA 75.05 77.96 PRODUCER'S ACURRACY
5 EOO 110.02 22.04 ERROR OF OMISSION
6 EOC 124.77 24.95 ERROR OF COMMISSION
7 SPD 1020 0.283 SPEED/TIME(Divided by 3600)
8 SP 7.35 SPACE/MEMORY
9 RB 1 RULE BASED
10 SV 1 SUPERVISED
11 ROI 1 REGION OF INTERESTS (ROIs)
12 COI 19.88 AVG. CLASSES OF INTEREST
MAXIMUM LIKELIHOOD CLASSIFIER (MLC)
S/N PARAMETERS BA VG WB FL OP TOTAL AVG.
1 COI 14.99 13.01 34.08 36 1.32 99.4 19.88 %CLASSES OF INTEREST 2 UA 81.29 98.74 95.32 1.92 97.96 375.23 75.05 USER ACURACY 3 PA 92.26 51.52 94.03 51.99 100 389.8 77.96 PRODUCER'S ACURRACY 4 EOO 7.74 48.48 5.97 48.01 0 110.2 22.04 ERROR OF OMISSION 5 EOC 18.71 1.26 4.68 98.08 2.04 124.77 24.95 ERROR OF COMMISSION Total Avg. 214.99 213.01 234.08 236 201.32 1099.4 219.88 42.99 42.60 46.82 47.20 40.26 219.87
Table 11: Researcher developed “Post Confusion Matrix” (PoCoMa) tested using SVMC Error Matrix result
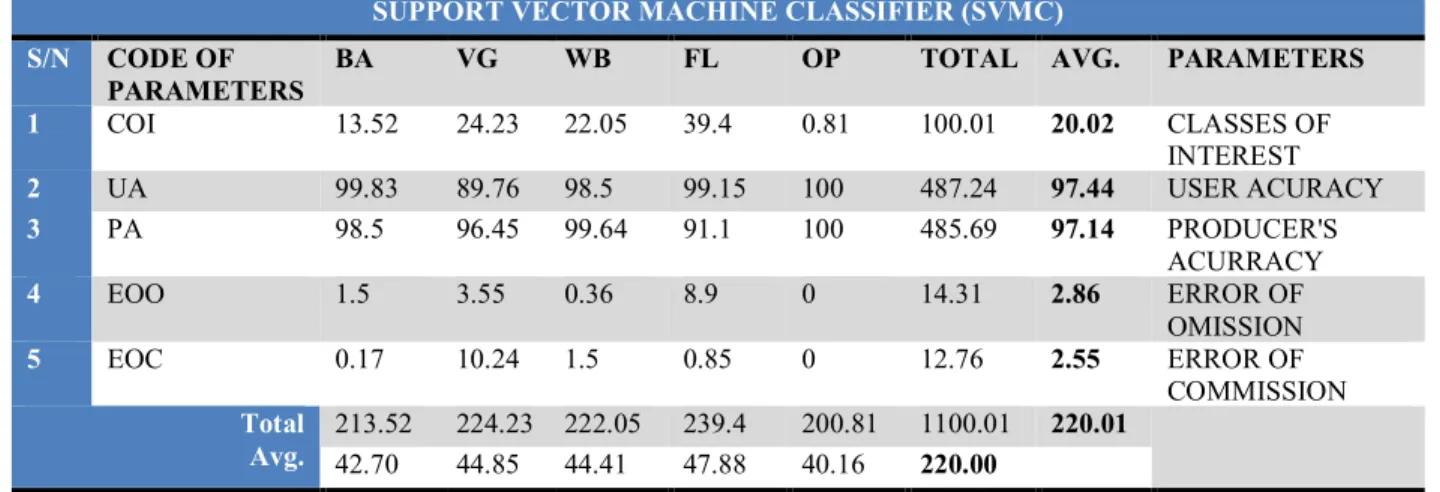
The essence of the “Post Confusion Matrix” (PoCoMa) shown in Table 10 and 11 is to obtain the mean average of the summation of the following: all Classes of Interest, User Acuracy, Producer's Acurracy, Error of Omission and Error of Commission, Table 12.
Table 12: Developed “Post Confusion Matrix” (PoCoMa) SVMC Result Table
SVM DATA SET
S/N PARAMETERS SVMC RECOMPUTED DESCRIPTIONS
1 OA 98.07 OVERALL ACURRACY
2 KC 0.97 KAPPA COEFFICIENT
3 UA 117.448 97.44 USER ACURACY
4 PA 117.138 97.14 PRODUCER'S ACURRACY
5 EOO 14.31 2.86 ERROR OF OMISSION
6 EOC 12.76 2.55 ERROR OF COMMISSION
7 SPD 172800 48 SPEED/TIME
8 SP 19.35 SPACE/MEMORY
9 RB 1 RULE BASED
10 SV 1 SUPERVISED
11 ROI 1 ROIs
12 COI 20.02 CLASSES OF INTEREST
SUPPORT VECTOR MACHINE CLASSIFIER (SVMC) S/N CODE OF
PARAMETERS
BA VG WB FL OP TOTAL AVG. PARAMETERS
1 COI 13.52 24.23 22.05 39.4 0.81 100.01 20.02 CLASSES OF INTEREST 2 UA 99.83 89.76 98.5 99.15 100 487.24 97.44 USER ACURACY 3 PA 98.5 96.45 99.64 91.1 100 485.69 97.14 PRODUCER'S ACURRACY 4 EOO 1.5 3.55 0.36 8.9 0 14.31 2.86 ERROR OF OMISSION 5 EOC 0.17 10.24 1.5 0.85 0 12.76 2.55 ERROR OF COMMISSION Total Avg. 213.52 224.23 222.05 239.4 200.81 1100.01 220.01 42.70 44.85 44.41 47.88 40.16 220.00
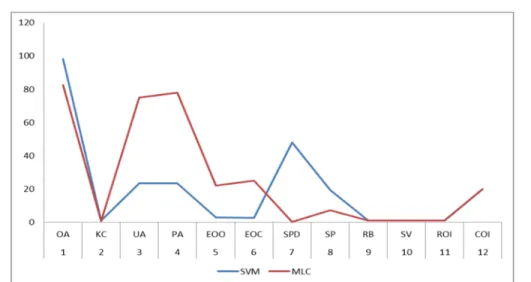
Figure 5: Diagrammatical display of the relationship between the performance properties of SVM and MLC. This relationship between the performance properties of SVM and MLC was tested using Excel spree sheet to first see if it can run in SPSS or GraphPad or not. If it contains error it may not run, Figure 5.
4.2 Hypotheses Testing
1. Null hypothesis (H0): There is no significant difference between the performance of SVMC and MLC.
Table 13: Combine Dataset of Post Confusion Matrix (PoCoMa) from SVMC and MLC
S/N CODE SVM MLC PARAMETERS
1 OA 98.07 82.5 OVERALL ACURRACY
2 KC 0.97 0.76 KAPPA COEFFICIENT
3 UA 23.49 75.05 USER ACURACY
4 PA 23.43 77.96 PRODUCER'S ACURRACY
5 EOO 2.86 22.04 ERROR OF OMISSION
6 EOC 2.55 24.95 ERROR OF COMMISSION
7 SPD 48 0.283 SPEED/TIME
8 SP 19.35 7.35 SPACE/MEMORY
9 RB 1 1 RULE BASED
10 SV 1 1 SUPERVISED
11 ROI 1 1 REGION OF INTERESTS (ROIs)
Figure 6: The summary sheet of the result of Hypotheses one.
Figure 7: The extracted results of Hypotheses one analysis from GraphPad Prism 7.0 software
The single advantage of GraphPad Prism results (Figure 6) over the SPSS is that it is very easy to understand, even if you are not well grounded in statistical analysis and interpretations, for example, see the portion of Figure. 7 encircled in red where “ns means not significant” that is, P Value is not significant and ‘No’ there means that the test for Hypotheses one have no significant different at P<0.05, moreover the whole result can be summarised and presented in a single table, Table 16
Table 14: The extracted results of Hypotheses one analysis from SPSS version 21 statistical software
T-Test
Paired Samples Statistics
Mean N Std. Deviation Std. Error Mean
Pair 1 SVMC 20.1450 12 28.51868 8.23263
Table 15: Comparative Analysis of the Aggregate Mean from SVMC and MLC using SPSS
Table 16: Paired Samples Correlations analysis crosschecked using IBM SPSS
The result from Table 14 and Figure.7 showed that the aggregate mean performance property of SVMC is 20.15 while that of MLC is 26.15. This tends to suggest that there could be a variation in the performance efficiency of map production and reading from SVMC and MLC.
However, the result from Figure 6, 7 and Table 15 compared the aggregate mean from SVMC and MLC to determine the significance of the mean difference. The result showed that the t-statistics is -0.738 with significant (probability) value of 0.476. Since the probability value is not less than 0.05, we cannot reject the null hypothesis that “there is no significant difference in the result from SVMC and MLC”. The study thus concludes that using any of the Algorithms (SVMC and MLC) in ENVI yields no significance difference in performance and efficiency of result of the map produced. This implies that any of the SVM and MLC is as good as each other. The result is also the same when tested using GraphPad Prism 7.0 software and SPSS version 21 statistical software.
5. Conclusion and Recommendations
It is worthy to note that the availability of various algorithms through machine learning approaches improves the capability of image classification in an intelligent way, hence the High Resolution Satellite Image (HRSI) GeoEye-1, (2016) was used to produce urban land use and land cover map of Nnewi North Local Government Area using ENVI Support Vector Machine (SVM) classifier and MLC algorithms. The comparative analysis of SVM and MLC classifiers was tested. The SVM default, the radial basis function kernel (RBF) was used image classification which the developers and some researchers claimed works well in most cases. This study evaluated this claim by using supervised classification of remotely sensed data (GeoEye-1, HRSI) the result was compared using Maximum Likelihood Classifier (MLC) in ENVI Software and the result shows that Support Vector Machine Classifier (SVMC) performs better than the Maximum Likelihood Classifier (MLC) in ENVI Software, however, it be may because SVMC have of a way of dealing with complex and noisy data, however, in other to investigated further the researcher developed a “Post Confusion Matrix” (PoCoMa) formula from the contingency matrix, kappa coefficient and the behavours of the image classifiers and used it for computing and comparing their capabilities of SVMC and MLC. The values obtained were tested using t-statistics (Paired Samples Test) using GraphPad Prism and SPSS statistical software.
The result from t-statistics showed that the aggregate mean performance property of SVMC is 20.15 while that of MLC is 26.15. This tends to suggest that there could be a variation in the performance efficiency of map production and reading from SVMC and MLC. However, when the result was used to compared the aggregate mean from SVMC and MLC to determine the significance of the mean difference. The t-statistics result showed that the probability value is not less than 0.05, thus, the null hypothesis that “there is no significant difference in the result
Paired Samples Test
Paired Differences t df Sig. (2-tailed)
Mean Std. Deviation Std. Error Mean
95% Confidence Interval of the Difference
Lower Upper
Pair 1 SVMC - MLC
-6.00275 28.17573 8.13363 -23.90476 11.89926 -.738 11 .476
Paired Samples Correlations
N Correlation Sig.
software and SPSS version 21 statistical software. The further studies will carry a comparative analysis of the four Kernel types of SVMC in ENVI software with HRSI using the developed “Post Confusion Matrix” formula. The algorithms of the novel template “Post Confusion Matrix” will be developed such that it will merged with the existing ‘Error Matrix’ and improve to execute task automatically, for computing and comparing the capabilities of different image classifier.
References
Amanze J.O, Ezeh C.I and Okoronkwo, M.O (2015). Pattern of Income Diversification strategies among Rural Farmers in Nnewi North Local Government Area of Anambra. Journal of Economics and Sustainable Development Vol. 6, No.5.
Anambra State Ministry of Health and FHI 360. (2013). Anambra State Wide Rapid Health Facility Assessment, Nigeria: Anambra State Ministry of Health and FHI 360.
Anigbogu, T.U, Onwuteaka, C.I, Edoko, T.D, Okoli, M.I (2014). Roles of Small and Medium Scale Enterprises in Community Development: Evidence from Anambra South Senatorial Zone, Anambra State. International Journal of Academic Research in Business and Social Sciences, Vol. 4, No. 8.
Boser, B., Guyon, I., and Vapnik, V. (1992). An Training Algorithm for Optimal Margin Classifiers. In proc. of 5th ACM Annual Workshop on Computational Learning Theory, Pittsburgh, Pennsylvania, pp. 144-152.
Brautigam, D. (1997). Substituting for the State: Institutions and Industrial Development in Eastern Nigeria. World Development Vol. 25, No. 7 Pp. 1063-1080.
Cristianini, N., and Shaew-Taylor, J. (2000): An Introduction to Support Vector Machines and Other Kernel Based Learning Methods. Cambridge, U.K.: Cambridge Univ. Press.
ERDAS Field Guide (1999). University of Massachusetts, Amherst, MA, USA. . Erdas Inc., Atlanta, Georgia. Technical Report 92-8.
Ezeomedo, I.C., (2019) Automatic Identification and Mapping of Urban Features of Nnewi using High Resolution Satellite Image and Support Vector Machine Classifier. Unpublished Ph.D. Dissertation Submitted to the Department of Surveying and Geoinformatics, Nnamdi Azikiwe University, Awka, Nigeria.
FAO, (2005). Land Cover Classification System (LCCS) Classification Concepts and User’s Manual. FAO, Rome, Italy.
Foody, G.M., and Mathur, A., (2004a). A relative evaluation of multiclass image classification by support vector machines” .IEEE Transactions on Geoscience and Remote Sensing 42 (6), 1335–1343.
Gunn, R.S. (1998). Support Vector Machines for classification and regression, “technical report” University of Southampton.
Huang, C., Song, K., Kim, S., Townshend, J. R. G., Davis, P., Masek, J. G., (2007). Use of a dark object concept and support vector machines to automate forest cover change analysis. Remote Sensing of Environment, 112(3), 970-985.
Kapoor A., Mehta N., Esper F., Poljsak-Prijatelj M., Quan P. L., Qaisar N., Delwart E., Lipkin W. I. (2010). Identification and characterization of a new bocavirus species in gorillas. PLoS ONE 5, e11948 10.1371/journal.pone.0011948 [PMC free article].
Mangasarian. O. L. (1965) Linear and nonlinear separation of patterns by linear programming. Operations Research, 13:444– 452.
Lu, D., Weng, Q., (2007). A survey of image classification methods and techniques for improving classification performance. International Journal of Remote Sensing 26 (5), 823–870.
National Population Commission (2007): 2006 Population Census of the Federal Republic of Nigeria Official Gazzette. Vol. 94, No. 24, Lagos.
Obeta, M.C. (2015). Industrial Water Supply in Nnewi Urban Area of Anambra State, South Eastern Nigeria. Journal of Geography, Environment and Earth Science International 2(1): 12-23,
Ogbuagu, C.N, Okoli, U.J, Oguoma V.M, Ogbuagu E.N. (2010). Orphans and Vulnerable Children Affected by Sexual Violence and HIV/AIDS in two Local Government Areas in Anambra State, Southeastern Nigeria. American-Eurasian Journal of Scientific Research 5(1):05-11.
Ojiako, J.C. and Igbokwe, J.I. (2009). Application of Remote Sensing and Multimedia Geographic Information System (GIS) in the Administration of Socio-Economic Activities in Nnewi Urban Area of Anambra State, Nigeria. Environmental Research Journal Volume 3 Issue 2 Pp 60-67
Okpala-Okaka, C., (2011). The Making of Urban Towns: A Comparison of the U.S and Nigerian Experiences. Journal of Environmental Management and Safety, Vol 2. (1)75 – 82.
Onwutalobi, C.A (2009). History of Otolo Nnewi. http://www.codewit.com/africa/1235-history-of-otolo-nnewi-by-anthony-claret-onwutalobi. Available online (Retrieved 10/23/2014).
Orji Uzor E.N., and Obasi, S. N (2012). Properties and Classification of Erosion Prone Soils of Ukpor, Nnewi South L.G.A ,Anambra State Nigeria. Int’l Journal of Agric. and Rural Dev. SAAT FUTO.
Phil-Eze, P.O (2010). Variability of Soil Properties related to Vegetation Cover in Tropical Rainforest Landscape. Journal of Geography and Regional Planning. Vol.3 (7), pp. 177-184.
Richards, J.A., (1999). Remote Sensing Digital Image Analysis, Springer-Verlag, Berlin, p. 240.
Shi Dee and Yang Xiaojun, (2012). Support Vector Machines for Landscape Mapping from Remote Sensor Imagery. Proceedings-AutoCarto 2012 - Columbus, Ohio, USA - September 16-18, 2012.
Sohn, Y., N.S. Rebello, 2002. Supervised and Unsupervised Spectral Angle Classifiers. Photogrammetric Engineering & Remote Sensing, 68; 1271-1280.
UN-HABITAT. (2009). Structure Plan for Anambra State. Nairobi, Kenya: United Nations Human Settlements Programme Publishers.
Vapnik Vladimir N. (1995). The Nature of Statistical Learning Theory. Springer, Berlin Heidelberg New York. Vapnik, Vladimir., (1998): “Statistical Learning Theory”. New York: Wiley.
Vapnik, V. and A. Lerner, (1963). Pattern recognition using generalized portrait method. Automation and Remote Control. Vol.24, 774-780.
Xie, Y., Sha, Z. and Yu, M., (2008). “Remote sensing imagery in vegetation mapping: a review”, Journal of Plant Ecology, vol. 1, pp. 9–23