networks in haematopoiesis from
single-cell gene expression data
Steven Woodhouse
Department of Haematology
University of Cambridge
This dissertation is submitted for the degree of
Doctor of Philosophy
A fundamental challenge in biology is to understand the complex gene regulatory networks which control tissue development in the mammalian embryo, and maintain homoeostasis in the adult. The cell fate decisions underlying these processes are ultimately made at the level of individual cells. Recent experimental advances in biology allow researchers to ob-tain gene expression profiles at single-cell resolution over thousands of cells at once. These single-cell measurements provide snapshots of the states of the cells that make up a tissue, instead of the population-level averages provided by conventional high-throughput experi-ments. The aim of this PhD was to investigate the possibility of using this new high resolu-tion data to reconstruct mechanistic computaresolu-tional models of gene regulatory networks. In this thesis I introduce the idea of viewing single-cell gene expression profiles as states of an asynchronous Boolean network, and frame model inference as the problem of recon-structing a Boolean network from its state space. I then give a scalable algorithm to solve this synthesis problem. In order to achieve scalability, this algorithm works in a modu-lar way, treating different aspects of a graph data structure separately before encoding the search for logical rules as Boolean satisfiability problems to be dispatched to a SAT solver. Together with experimental collaborators, I applied this method to understanding the pro-cess of early blood development in the embryo, which is poorly understood due to the small number of cells present at this stage. The emergence of blood from Flk1+ mesoderm was studied by single cell expression analysis of 3934 cells at four sequential developmental time points. A mechanistic model recapitulating blood development was reconstructed from this data set, which was consistent with known biology and the bifurcation of blood and endothe-lium. Several model predictions were validated experimentally, demonstrating that HoxB4 and Sox17 directly regulate the haematopoietic factor Erg, and that Sox7 blocks primitive erythroid development.
A general-purpose graphical tool was then developed based on this algorithm, which can be used by biological researchers as new single-cell data sets become available. This tool can
deploy computations to the cloud in order to scale up larger high-throughput data sets. The results in this thesis demonstrate that single-cell analysis of a developing organ cou-pled with computational approaches can reveal the gene regulatory networks that underpin organogenesis. Rapid technological advances in our ability to perform single-cell profiling suggest that my tool will be applicable to other organ systems and may inform the develop-ment of improved cellular programming strategies.
I hereby declare that this dissertation is the result of my own work and includes nothing which is the outcome of work done in collaboration except where specifically indicated in the text. Specific details of work arising through collaboration are given in Chapters 4 and 6. The contents of this dissertation are original and have not been submitted in whole or in part for consideration for any other degree or qualification in this, or any other University. The total length of the main body of this dissertation including figure legends is 31,786 words and therefore does not exceed the limit of 60,000 words for such a dissertation.
Steven Woodhouse October 2016
I would like to thank my supervisors, Bertie Göttgens and Jasmin Fisher, who have taught me a lot about biology, haematology, and the process of doing scientific research in gen-eral. I also want to thank Nir Piterman who acted as a third advisor for the technical parts of my PhD and more than once noticed when I was doing something very far from opti-mally. I thank Vicki Moignard: the main results of this PhD came from a collaboration with Vicki, who had already begun the embryonic blood development study when I started my PhD. Also, the members of the two labs I spent my PhD in, the Haematopoietic Stem Cell Lab at the Cambridge Institute for Medical Research and the Programming Principles and Tools group at Microsoft Research Cambridge. Finally, I thank my family for their support throughout my time at Cambridge.
Contents ix
List of Figures xii
Papers arising from this PhD xiv
1 Introduction 1
1.1 Haematopoiesis . . . 2
1.1.1 Development of the haematopoietic system . . . 2
1.1.2 Maintenance of the adult haematopoietic system . . . 5
1.2 Gene Regulatory Networks . . . 7
1.2.1 Regulation of gene expression . . . 7
1.2.2 Modelling gene regulatory networks . . . 12
1.3 Computational analysis of high–dimensional single–cell gene expression data 20 1.3.1 qPCR on the Fluidigm BioMark . . . 22
1.3.2 Single cell RNAseq . . . 23
1.3.3 Visualisation . . . 24
1.3.4 Network reconstruction . . . 31
1.4 Solving combinatorial problems . . . 35
1.4.1 Binary Decision Diagrams . . . 36
1.4.2 Boolean Satisfiability . . . 37
1.4.3 Formal verification and synthesis of computer programs . . . 39
1.5 Aims of this PhD . . . 40
2 Boolean Networks 41 2.1 Definition . . . 41
3 Proposed algorithm 44
3.1 Introduction . . . 44
3.2 Viewing single-cell gene expression data as the state space of a Boolean network . . . 45
3.3 Example: reconstructing an ABN from its state space . . . 48
3.4 Formal definition of the problem . . . 50
3.4.1 Generalising the definition to partial data . . . 51
3.5 A direct encoding . . . 52
3.5.1 Possible update functions . . . 52
3.5.2 Ensuring reachability . . . 54
3.5.3 Enforcing the threshold condition . . . 54
3.6 A compositional algorithm . . . 55
3.6.1 Pruning the set of possible edges and possible update functions . . . 55
3.6.2 Ensuring reachability . . . 56
3.6.3 Final update functions . . . 57
4 Application to haematopoetic data 59 4.1 Introduction . . . 59
4.2 Capturing cells with blood potential during gastrulation . . . 60
4.3 Development of blood progenitor cells is not synchronized . . . 62
4.4 Diffusion maps identify developmental trajectories . . . 66
4.5 Synthesis of a network model for early blood development . . . 68
4.6 Network synthesis predicts direct regulation of Erg . . . 70
4.7 Model execution reveals key switches during development . . . 72
4.8 Conclusions . . . 73
4.9 Materials and Methods . . . 76
4.9.1 Single-cell qRT-PCR . . . 76
4.9.2 Synthesis bootstrapping . . . 76
4.9.3 Assessing sensitivity of synthesised rules to binary discretisation threshold . . . 77
5 Graphical User Interface 78 5.1 Introduction . . . 78
5.2 SCNS is controlled via a web-based graphical interface . . . 79
5.3 SCNS finds stable states and performs model perturbations . . . 80
5.4 SCNS can dispatch computations to the cloud . . . 81
6 Discussion 85
6.1 Gene regulatory network reconstruction from single-cell data . . . 85
6.2 Synthesis in biology . . . 88
6.3 Applicability of SCNS to new data . . . 91
6.4 Improvements to the algorithm . . . 92
6.5 Concluding comments . . . 93
References 95
Appendix A Supporting information for chapter 4 — Synthesised Boolean update
rules 132
Appendix B Supporting information for chapter 4 — Results of repeating
synthe-sis with a more stringent discretisation threshold 134
Appendix C Supporting information for chapter 4 — Results of repeating
1.1 Developmental haematopoiesis . . . 3
1.2 Adult haematopoiesis . . . 6
1.3 Combinatorial transcription factor binding . . . 8
1.4 Regulatory triad . . . 13
1.5 Boolean common myeloid progenitor model . . . 17
1.6 Boolean blood stem cell model . . . 18
1.7 Overview of different single-cell analyses. . . 21
1.8 High-dimensional data . . . 25
1.9 Manifold learning . . . 28
1.10 Relevance networks . . . 32
1.11 Bayesian networks . . . 33
1.12 Binary decision diagrams . . . 36
1.13 Conflict-Driven Clause Learning algorithm for SAT. . . 38
2.1 Attractors in an asynchronous Boolean network . . . 42
2.2 Attractor finding algorithm . . . 43
3.1 Single-cell gene expression measurements . . . 45
3.2 State graph . . . 46
3.3 Boolean update functions for a manually curated network. . . 48
3.4 Boolean network state space . . . 49
3.5 Close-up of Boolean network state space. . . 49
3.6 Synthesised update functions. . . 50
3.7 Boolean formulae representation . . . 52
3.8 Performance of direct encoding and compositional algorithm on example data sets. . . 58
4.2 Development is asynchronous . . . 63
4.3 Diffusion plots identify developmental trajectories . . . 65
4.4 Regulatory network synthesis from single-cell expression profiles . . . 67
4.5 Some states occur in multiple cells . . . 69
4.6 Network analysis predicts transcriptional interactions . . . 71
4.7 Partial correlation analysis . . . 73
5.1 The Single Cell Network Synthesis Toolkit . . . 79
5.2 Upload page . . . 80
5.3 STG page . . . 81
5.4 Selecting initial and target cell classes . . . 82
5.5 Results page . . . 83
5.6 Analysis page . . . 84
1. Transcriptional hierarchies regulating early blood cell development. Victoria
Moignard, Steven Woodhouse, Jasmin Fisher and Berthold Göttgens. (2013). Blood
Cells, Molecules and Diseases.
2. Building an ENCODE-style data compendium on a shoestring. David Ruau,
Fe-licia Ng, Nicola Wilson, Rebecca Hannah, Evangelia Diamanti, Patrick Lombard,
Steven Woodhouse and Berthold Göttgens. (2013).Nature Methods.
3. Single cell analyses of regulatory network perturbations using enhancer
target-ing TAL Effectors suggest novel roles for PU.1 durtarget-ing haematopoietic
specifica-tion. Adam C. Wilkinson, Viviane K. S. Kawata, Judith Schütte, Xuefei Gao, Stella
Antoniou, Claudia Baumann, Steven Woodhouse, Rebecca Hannah, Yosuke Tanaka, Gemma Swiers, Victoria Moignard, Jasmin Fisher, Shimauchi Hidetoshi, Marloes R.
Tijssen, Marella F. T. R. de Bruijn, Pentao Liu and Berthold Göttgens. (2014).
Devel-opment.
4. Decoding the regulatory network of early blood development from single-cell
gene expression measurements. Victoria Moignard*, Steven Woodhouse*, Laleh
Haghverdi, Josh Lilly, Yosuke Tanaka, Adam C. Wilkinson, Florian Buettner, Iain C. Macaulay, Wajid Jawaid, Evangelia Diamanti, Shin-Ichi Nishikawa, Nir Piterman, Valerie Kouskoff, Fabian J. Theis, Jasmin Fisher and Berthold Göttgens. (2015).
Nature Biotechnology. * Equal contribution
5. Synthesising executable gene regulatory networks from single-cell gene
expres-sion data. Jasmin Fisher, Ali Sinan Koksal, Nir Piterman and Steven Woodhouse.
(2015). Computer Aided Verification (CAV).
6. Processing, visualising and reconstructing network models from single cell data.
Steven Woodhouse, Victoria Moignard, Berthold Göttgens and Jasmin Fisher. (2015).
7. Single cell analysis of T cell differentiation reveals three distinct states with
mas-sive acceleration of proliferation.Valentina Proserpio, Andrea Piccolo, Liora
Haim-Vilmovsky, Tapio Lönnberg, Jhuma Pramanik, Kedar Natarajan, Weichao Zhai, Valen-tine Svensson, Gozde Kar, Xiuwei Zhang, Giacomo Donati, Melis Kayikci, Jurij Ko-tar, Andrew N. McKenzie, Ruddy Montandon, Oliver Billker, Steven Woodhouse,
Pietro Cicuta, Mario Nicodemi, Sarah A. Teichmann. (2016). Genome Biology.
8. BTR: training asynchronous Boolean models using single-cell expression data.
Chee Yee Lim, Huange Wang, Steven Woodhouse, Nir Piterman, Lorenz Wernisch,
Introduction
Section 1.3 of this introduction was published in Woodhouse et al. (2015).
Uncovering and understanding the gene regulatory networks (GRNs) which underlie devel-opment and homeostasis is a central issue in molecular cell biology. These GRNs control the self-renewal and differentiation capabilities of the stem cells that maintain adult tissues, and become perturbed in diseases such as cancer. They also specify the complex developmental processes that lead to the initial formation of tissues in the embryo. Understanding how to effectively control GRNs can lead to important insights for the programmed generation of clinically-relevant cell types important for regenerative medicine, as well as into the design of molecular therapies to target cancerous cells.
As biological data becomes more accurate and becomes available in larger volumes, re-searchers are increasingly adopting concepts from computer science to the modelling and analysis of living systems. Formal methods have been successfully applied to gain insights into biological processes and to direct the design of new experiments. New single-cell resolution gene expression measurement technology provides an exciting opportunity for modelling biological systems at the cellular level. Single-cell gene expression profiles pro-vide a snapshot of the true states that cells can reach in the real experimental system, a level of detail which has not been available before, suggesting it may be possible to reconstruct mechanistic computational models of gene regulatory network function directly from data. A major challenge for researchers is to move beyond established methods for the analysis of population average data, to new techniques that take advantage of this single-cell resolution data.
1.1
Haematopoiesis
Haematopoiesis is one of the paradigmatic systems for studying mammalian stem cell bi-ology, due to the ease of access to the blood and bone marrow, and the development of sophisticated techniques for the purification and functional characterisation of stem and progenitor cells (Orkin and Zon (2008)).
In humans, it has been estimated that close to a trillion blood cells are generated every day from the small pool of haematopoietic stem cells (HSCs) which are responsible for maintaining the adult blood system (Ogawa (1993)). HSCs have the ability to both self-renew and to differentiate through a hierarchy of intermediate progenitor cells to the mature cells of all blood lineages (Bryder et al. (2006); Foster et al. (2009); Heng and Painter (2008); Schütte et al. (2012)). Much has been learnt about this process from the study of model organisms, in particular the mouse (Spangrude et al. (1988); Till and McCulloch (1961)). In the mouse, HSCs are functionally defined as cells that are capable of long-term reconstitution of the hematopoietic system of a lethally irradiated recipient animal.
In addition to being a model system for adult stem cell biology, the study of HSCs is also highly clinically relevant. Many leukaemias and haematological malignancies are caused by disruptions to normal cellular decision making, leading to an imbalance in the numbers of different types of blood cell; and bone marrow transplantation represented the first, and still dominant form of stem cell therapy.
While much has been learned about the lineages of the blood system, and the importance of specific transcriptional regulators in normal haematopoiesis and in the development of ma-lignancies, little is known about how these factors are integrated into a wider gene regulatory network that controls cellular decision making. Our understanding of how the hematopoietic system first develops during embryogenesis is also far from complete.
1.1.1
Development of the haematopoietic system
The ontogeny of the haematopoietic system has been studied in detail for over 100 years. Genetic and imaging studies have revealed a complex process that occurs at different de-velopmental time points and at different locations in the embryo and fetus (reviewed in Moignard et al. (2013b)).
Development of the haematopoietic system proceeds in a series of distinct waves. In the mouse, the first, primitive, wave occurs on embryonic day (E)7.5 towards the end of
gas-Figure 1.1Schematic of hematopoietic developmentin-vivoin the developing mouse
em-bryo andin-vitroin embryonic stem cell cultures. Hematopoietic cells derive from the
embryonic mesoderm through a hemangioblast intermediate, with the transcription factor Etv2 implicated in its emergence and/or commitment. Hemangioblast-like cells can also be identified when embryonic stem cells are induced to differentiate, either through em-bryoid bodies in suspension or in adherent culture. The transcription factor Scl then
reg-ulates the transition from the hemangioblast to the hemogenic endothelium, bothin-vivo
and in embryonic stem cell cultures. Clusters of hematopoietic cells form adjacent to the hemogenic endothelium from which hematopoietic precursor cells bud out into the blood vessels, in a process termed endothelial-to-hematopoietic transition, which is regulated by Runx1 (Moignard et al. (2013b)).
trulation, and primarily generates primitive erythrocytes to supply oxygen to the rapidly growing embryo (Baron et al. (2013); Moignard et al. (2013b)). This is followed by a definitive wave, which can be further divided into the production of multipotent erythro-myeloid progenitors with limited potential for expansion on E8.25, and the emergence of the true HSCs that will go on to populate the bone marrow and maintain the blood system throughout adult life, on E10.5. While embryonic stem cell models are able to recapitulate
key aspects of this process, de-novo generation of HSCsin-vitrofrom pluripotent stem cells
is still not possible. The study of the gene regulatory networks and signalling pathways involved in the developmental of the blood system is therefore an active topic of study in molecular haematopoiesis.
1.1.1.1 Primitive haematopoiesis
In the mouse, gastrulation begins after the implantation of the embryo at E6.5, with the formation of the three germ layers (mesoderm, ectoderm and endoderm) that will go on to give rise to the different tissues and organs of the embryo. The blood is one of the first tissues to develop, with primitive erythroid progenitors developing at E7.0-7.5 outside of the embryo-proper from mesodermal progenitors in the yolk sac which express the VEGF receptor, Flk1 (Lux et al. (2008); Moignard et al. (2015); Shalaby et al. (1997)).
Differentiated primitive erythrocytes can be detected by E8.0, which differ from adult-type definitive erythrocytes in the existence of a nucleus, their larger size, and the expression of foetal/embyronic instead of adult globins (Baron et al. (2013)). Megakaryocytes and macrophages can also be detected developing in the yolk sac by this stage (Frame et al. (2013)). Primitive erythrocytes continue to mature after entering circulation at around E8.5, and will eventually enucleate (Baron et al. (2013); Frame et al. (2013); Moignard et al. (2013b)). Development of primitive erythrocytes is dependent on the transcription factors Scl (also known as Tal1), Gata1, Gata2, Lmo2 and EKLF, but, unlike definitive erythrocytes, not on Runx1, c-Myb or Zbp89 (Baron et al. (2013)).
1.1.1.2 Definitive haematopoiesis and the emergence of HSCs
Following primitive haematopoiesis in the yolk sac, there is a second, “transient” wave of haematopoiesis, which also occurs independently of HSCs. This wave begins at around E8.25, primarily in the yolk sac but also in the para-aortic splanchnopleura, the aorta-gonad-mesonephros (AGM) region, the vitelline and umbilical arteries, the placenta and the heart (Frame et al. (2013)). These hematopoietic progenitor cells have definitive ery-throid and myeloid potential, but do not have long-term reconstitution capability. After emergence, the transient progenitors localise to the fetal liver at E10, where they differenti-ate. This second wave of haematopoiesis provides the mid- to late-stage embryo with blood cells and is required for survival until birth, by which time the adult haematopoietic system is established. HSC-independent progenitors with lymphoid potential can also be detected in the yolk sac at around E9.5 (Böiers et al. (2013); Yoshimoto et al. (2011, 2012)). These cells are believed to be distinct from the transient erythro-myeloid progenitors.
Finally, hematopoietic stem cells emerge on E10.5 in very small numbers, migrating to the foetal liver by E12.5 and finally to the bone marrow shortly before birth to establish the adult haematopoietic system (Swiers et al. (2013a,b)). HSCs first emerge from the wall of
the dorsal aorta in the AGM region, and then later at multiple sites in the embryo (Medvinsky and Dzierzak (1996)).
Transient progenitors and HSCs emerge from an endothelial source, through a process known as the endothelial-to-hematopoietic transition (Garcia-Porrero et al. (1995); Jaf-fredo et al. (1998)) which has recently been visualised in real-time using time-lapse imag-ing (Eilken et al. (2009)). This hemogenic endothelium itself develops from a precursor known as the hemangioblast, a multipotent progenitor which also has the potential to give rise to vascular smooth muscle (Lancrin et al. (2009)). The hemangioblast develops from mesodermal cells which express the VEGF receptor, Flk1. Knockouts studies have re-vealed some of the transcriptional regulators involved in this linear process (Moignard et al. (2013b), Figure 1.1). The development of the hemangioblast from Flk1 mesoderm is de-pendent on the transcription factor Etv2 (Kataoka et al. (2013); Moignard et al. (2013b); Wareing et al. (2012)), while Scl is required for the transition from the hemangioblast to the hemogenic endothelium (D’Souza et al. (2005)). The endothelial-to-hematopoietic transi-tion is regulated by Runx1 (Chen et al. (2009); Swiers et al. (2013a,b)).
1.1.2
Maintenance of the adult haematopoietic system
The adult haematopoietic system is maintained by a small pool of haematopoietic stem cells which reside primarily in the bone marrow but can also be found circulating in the blood stream (Figure 1.2). HSCs can make the decision to quiesce, to self-renew or to differentiate through a hierarchy of progressively more lineage-restricted progenitor cells to produce all of the mature adult blood cell types, from oxygen-carrying erythrocytes and platelet-producing megakaryocytes to the cells of the innate and adaptive immune systems. In order to maintain homoeostasis, these cell fate decisions must be carefully regulated in order to produce the correct ratio of each of the mature cell types while maintaining the stem cell pool.
Stem cell decision making is regulated by both internal gene regulatory networks and ex-ternal cytokines which feed information into the inex-ternal regulatory program via signalling pathways. Years of molecular haematology research has identified many of the transcription factors involved in the internal HSC gene regulatory network, the importance of which is highlighted by the fact that their forced expression can commit a stem cell to a specific lin-eage choice, while their absence can result in the depletion of specific linlin-eages, and by the fact that they are often mutated or dysregulated in leukaemia. For example, forced expres-sion of the transcription factor Gata1 is sufficient to drive haematopoietic progenitors toward
Figure 1.2Schematic of the haematopoietic hierarchy. Multipotent stem and progenitor cells in purple, megakaryocyte–erythroid lineage in red, other myeloid lineages in orange, and lymphoid cells in blue. (Moignard et al. (2013a)).
an erythroid/megakaryocytic fate (Heyworth et al. (2002); Kulessa et al. (1995)), while PU.1 promotes alternative myeloid fates (Galloway et al. (2005); Rhodes et al. (2005)). Loss of Gfi1 results in the absence of neutrophil progenitors (Hock et al. (2003)). Scl is often translocated in T-cell acute lymphoblastic leukaemia (Robb et al. (1995)), while Pax5 is often deleted in B-cell leukaemia (Medvedovic et al. (2011)) and the Runx1(AML1)–ETO fusion protein is associated with acute myeloid leukaemia (Mulloy et al. (2002)).
The most dramatic demonstration of the power of transcription factors to control cellular state is the conversion of mature cell types back to a pluripotent state reminiscent of the embryonic stem cell (known as an induced pluripotent stem cell, or iPSC) by introduction of the transcription factors Oct3/4, Sox2, c-Myc and Klf4, for which Yamanaka received the 2012 Nobel Prize in Physiology or Medicine (Takahashi and Yamanaka (2006)). Similar re-programming is possible within the haematopoietic system. For example, B and T cells can
be reprogrammed to macrophages by expression of the transcription factor C/EBPα (Laiosa
Gfi1b and Etv6 into mouse fibroblasts; Hoxa9, Erg, Rora, Sox4 and Myb into human myeloid-restricted precursors; or Run1t1, Hlf, Lmo2, Prdm5, Pbx1, and Zfp37 into com-mitted mouse lymphoid and myeloid progenitors can give rise to HSC-like cells (Doulatov et al. (2013); Pereira et al. (2013); Riddell et al. (2014)).
Another active topic of study is the stem cell microenvironment, or niche, of haematopoietic stem cells. Research suggests that the interaction of HSCs with osteoblasts and vascular cells in the bone marrow modulates self-renewal and quiescence (Kiel and Morrison (2006); Kiel et al. (2007); Sipkins et al. (2005); Yoshihara et al. (2007); Zhang et al. (2003)), and that abnormal niches can be involved in the development of leukaemias (Azizidoost et al. (2015); Evans and Calvi (2015); Perry and Li (2007); Schepers et al. (2013)).
1.2
Gene Regulatory Networks
As mentioned above, much has been learnt from studying leukemic patients and from loss-of-function and over-expression experiments about the transcriptional regulators which are important to the development and maintenance of the haematopoietic system, but relatively little is known about how these regulators are integrated into a wider gene regulatory net-work and how this netnet-work executes the complex program of cell fate decision making.
1.2.1
Regulation of gene expression
Gene regulatory networks are built from non-protein-coding regulatory DNA elements — promoters and enhancers — and the transcription factors and epigenetic regulators which interact with these elements and with each other in order to control gene expression and therefore the identity and function of the cell. In mammals, the DNA which encodes each of the genes of the organism along with these regulatory elements is billions of base pairs long
(∼2.8 billion bp in mouse) and separated into multiple chromosomes. The human genome,
if it was laid out, would be nearly two metres in length (Ball (2003)). In order to compact such a huge amount of genetic material into the cell nucleus, which has a diameter of only a few micrometres, the DNA is supercoiled around proteins called histones to form structures called nucleosomes (Felsenfeld and Groudiner (2003)). Each nucleosome consists of two copies each of four core histone proteins — H2A, H2B, H3, and H4 — wrapped by around 146 base pairs of DNA (Ball (2003); Khorasanizadeh (2004); Kornberg and Lorch (1999); Luger et al. (1997)).
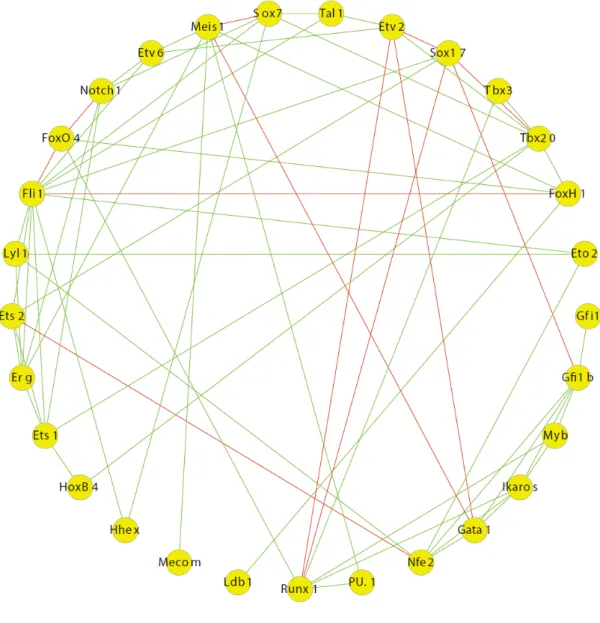
Figure 1.3Scl, Lyl1, Lmo2, Gata2, Runx1, Erg, Fli1 form a heptad of transcription factors which bind together in a complex in a haematopoietic progenitor cell line (Wilson et al. (2010)).
These histones have N-terminal tails which are subject to epigenetic modifications, such as acetylation and methylation, which regulate the accessibility of the wound DNA to tran-scriptional regulators and RNA polymerase (Bannister and Kouzarides (2011); Calo and Wysocka (2013); Dawson et al. (2012)). For example, acetylation of histone 3 lysine 27 (H3K27Ac) is enriched at regulatory elements of genes which can be actively transcribed, while trimethylation of histone 3 lysine 27 (H3K27me3) is associated with epigenetically silenced genes (Alberts et al. (2002); Bernstein et al. (2005); Creyghton et al. (2010); Kouzarides (2007); Rada-Iglesias et al. (2011); Schübeler et al. (2004)). The DNA itself is also subject to epigenetic modifications. Methylation of a promoter region is associated with silenced gene expression (Suzuki and Bird (2008)). Both of these forms of epigenetic regulation can be inherited through cell divisions and can persist in daughter cells (Cedar and Bergman (2011); Klose and Bird (2006)).
Transcription factors are modular proteins which bind to regulatory elements in order to activate or repress gene expression. Transcription factors account for a large proportion of the protein-coding genes in the mammalian genome, with 1700-1900 of the 20000-25000 genes in the human genome predicted to be transcription factors (Messina et al. (2004)). It has been estimated from an integrative study of population microarray data that around 150 to 300 transcription factors are expressed in a given human tissue, accounting for around 6% of the transcriptome (Ravasi et al. (2010); Vaquerizas et al. (2009)).
and bind to short (4-10 base pairs) DNA sequences, known as motifs. The haematopoietic factors Erg, Fli1 and PU.1 are Ets-factors, one of the largest families of transcription factors in mouse and human (Sharrocks (2001)). These factors have an 85-amino acids DNA bind-ing domain with a wbind-inged helix-turn-helix structure (Donaldson et al. (1996); Liang et al. (1994)) which binds to the Ets motif, the GGAW DNA sequence (Sharrocks (2001)). Scl and Lyl1 are basic helix-loop-helix factors (Begley and Green (1999)) which bind the Ebox motif (CANNTG). The Gata family features two zinc finger domains which bind to the WGATAR consensus motif (Ko and Engel (1993)). Runx1 is a core-binding factor which recognises and binds to the Runt binding motif (TGYGGT) (Ito et al. (2015)).
Transcription factors regulate gene expression through their transactivation domains, which bind to accessory proteins that can initiate, prevent, or modulate transcription (Spitz and Furlong (2012); Vaquerizas et al. (2009)). Other factors are believed to act as “pioneer factors”, recruiting chromatin remodelling enzymes which deplete nucleosomes, open up chromatin and make DNA accessible to other transcription factors which can subsequently bind to regulatory elements and mediate transcription (Chen et al. (2014b); Iwafuchi-Doi and Zaret (2014); Zaret and Carroll (2011)). Transcription factors may also be involved in recruiting histone and DNA modifying enzymes to lay down or erase epigenetic marks.
1.2.1.1 Combinatorial transcription factor activity
Transcription factors rarely work alone, and instead form multi-factor complexes which function together to regulate gene expression. These complexes can be formed via direct protein-protein interactions between factors which are bound to nearby motifs (Figure 1.3). Some transcription factors, such as Lmo2, are unable to bind DNA directly, and so rely com-pletely on partner factors to recruit them to regulatory regions. Binding of a transcription factor can therefore occur even if the motif it recognises is not present.
Examination of transcription factor binding patterns through ChIP-sequencing experiments followed by co-immunoprecipitation assays to establish protein-protein interactions iden-tified a heptad of factors (Scl, Lyl1, Lmo2, Gata2, Runx1, Erg, Fli1) which bind together in a complex in a haematopoietic progenitor cell line (Wilson et al. (2010), Figure 1.3).
A well characterised transcription factor complex is the AFF-2, c-Jun, IRF-3/IRF-7, NFκB
complex which regulates expression of interferon-β upon viral infection. Binding of all
fac-tors together is required before transcription is activated (Carey (1998); Merika and Thanos (2001); Panne et al. (2007)). Another example of combinatorial transcription factor regu-lation from haematopoiesis is found at the Scl+19 regulatory element, where the presence
and precise spacing of one Gata and two Ets motifs is required for Scl expression (Ng et al. (2014); Pimanda et al. (2007)).
The combined activity of multiple transcription factors at regulatory elements allows the cell to execute more complex cell fate decisions, where multiple spatial and temporal inputs are fed into a regulatory element and combinatorial logic determines whether the exact conditions are met for the target gene to be expressed, or not (Istrail and Davidson (2005)). The target gene may in turn code for a transcription factor, which then feeds back into regulatory elements, forming a complex gene regulatory network with non-linear logic and feedback loops (Bonzanni et al. (2013); Krumsiek et al. (2011)). This paradigm governs the expression of the stripe patterns during the segmentation of the Drosophila melanogaster embryo, for example (Wilczynski and Furlong (2010)).
Regulatory elements may execute “AND”, “OR”, or dominant repressing “NOT” logic, and more complex combinations of these (Istrail and Davidson (2005); Peter et al. (2012)). To experimentally determine the logic which controls the expression of a gene requires the identification of its regulatory elements the factors which bind to these elements, and the mutation of each binding motif to prevent binding, both individually and in all possible combinations. Additional perturbations may be required to prevent formation of complexes and to distinguish between factors when multiple factors are able to bind to the same site. This is extremely time-consuming, and a computational method which could predict gene regulatory logic from gene expression data alone would have the potential to massively speed up this process.
1.2.1.2 Transcriptional machinery
In eukaryotes, RNA is transcribed by RNA polymerase I, II or III depending on the type of the RNA; with RNA polymerase II (Pol II) responsible for transcribing protein-coding genes to mRNA (Butler and Kadonaga (2002); Goodrich and Tjian (2010); Juven-Gershon and Kadonaga (2010); Kadonaga (2012); Sandelin et al. (2007)). Transcription factors recruit Pol II to core promoters, regions of DNA that are found at -30, -75 and -90 base pairs upstream from the transcription start site. There Poll II assembles together with six general transcription factors that recognise core promoter motifs and perform essential functions such as the unwinding of DNA — TFIIA, TFIIB, TFIID, TFIIE, TFIIF and TFIIH — to form the pre-initiation complex.
Other proteins are involved in this process — coactivators and corepressors such as p300 which modulate the rate of transcription (Teufel et al. (2007); Vo and Goodman (2001)), and
positive and negative elongation factors which regulate the release of the polymerase from the transcriptional start site to allow it to move along the DNA and begin copying DNA to RNA (Adelman and Lis (2012)).
After transcription, further layers of control add to the complexity of gene regulation: post-transcriptional modification of RNA including splicing, whereby introns are removed and exons are joined (Barash et al. (2010)); RNA editing (Pachter (2012)); down-regulation by non-coding RNAs such as miRNA (Chen et al. (2004); Rodriguez et al. (2007); Shivdasani (2006); Stadler et al. (2010); Thai et al. (2010); Xiao et al. (2007)); translation of mRNA to an amino acid chain to form protein; and post-translational modification of the synthesised protein.
1.2.1.3 Enhancers
Complicating the study of mammalian gene expression is the fact that the trans-regulatory elements which control the activity of a gene can be located kilobases up- or down-steam of the transcriptional start site, with recent research suggesting they could even lie on dif-ferent chromosomes. These elements, called enhancers, loop to physically interact with the promoter and to bring their bound transcription factors into contact with the pre-initiation complex (Hughes et al. (2014); Shlyueva et al. (2014); Spitz and Furlong (2012)). Several proteins and protein complexes have been found to be involved in this process, including the mediator complex (Kagey et al. (2010)); cohesin, which forms rings to stabilise en-hancer/promoter interaction (Peric-Hupkes and van Steensel (2008); Seitan and Merken-schlager (2012)); and the transcription factor CTCF (Herold et al. (2012); Phillips and Corces (2009)). Genes can be regulated by multiple enhancers, enhancers can regulate multiple genes, and enhancers generally show tissue or cell-type specific activity.
Despite these factors making the identification of regulatory elements difficult, many en-hancers important to the regulation of haematopoiesis are now known, and their activity has begun to be characterised. Potential enhancers can be identified by comparative ge-nomics, identifying regions of DNA which are conserved throughout evolution (Donaldson et al. (2005); Göttgens et al. (2000)); by DNaseI hypersensitivity assays, which reveals DNA accessible to transcription factor binding (Meissner et al. (2008); Song and Crawford (2010)); and by the identification of combinatorial binding of multiple transcription factors and of activating histone modifications, through ChIP-seq (Wilson et al. (2010))). Chro-matin conformation capture and related technologies can reveal chroChro-matin looping (Hughes et al. (2014); Lieberman-Aiden et al. (2009); Patwardhan et al. (2009)). Once a putative
enhancer has been identified, it can be tested for activity by cloning the DNA sequence next to a minimal promoter and a reporter gene (Bonzanni et al. (2013)). Tissue-specificity can then be assessed in transgenic embryos (Schütte et al. (2012)). Characterisation of the reg-ulatory module can be carried out by the effect of individual and combined transcription factor binding site mutagenesis in cell lines (Lelieveld et al. (2015); Moignard et al. (2015); Ng et al. (2014); Wilkinson et al. (2014)).
Scl expression in haematopoiesis is regulated by at least two distal enhancers, located at +19 and -4 (Göttgens et al. (2004)) kilobases. The Lmo2 promoter and 75, Lmo2-70 and Lmo2-25 enhancers all show activity individually in haematopoietic tissues (Landry et al. (2009)). The Runx1 promoter alone is not active in haematopoietic tissues, but shows activity when combined with the Runx1+23 enhancer (Bee et al. (2009)). Enhancers for other key haematopoietic factors, including Erg, Fli1, Gata2, Gfi1b, and PU.1 (Okuno et al. (2005)) have also been identified and partially characterised.
1.2.2
Modelling gene regulatory networks
Gene regulatory networks control the dynamic expression pattern of genes, ensuring that the correct genes are expressed at the correct times and places at each stage of development, and determining the final, mature cell types that eventually develop. The complex non-linear in-teractions and feedback loops in these networks mean that mathematical and computational models are required in order to understand the dynamics of differentiation.
In 1957 Waddington proposed the epigenetic landscape, a metaphor for how multipotent cells differentiate by becoming progressively more lineage restricted (Goldberg et al. (2007); Waddington (1957)). In this metaphor, cells are thought of as marbles placed at the top of a valley. As the cells differentiate, they roll down the slopes of the valley and finally come to rest at the lowest points. These points represent the final mature differentiated cell types. This picture has become the basis for understanding the uni-directional process of devel-opment. In the modern formulation, cellular states are defined by the level of expression of each gene, and the dynamics of the system are given by the activation and repression relations between genes (Huang et al. (2005); Kauffman (1969)). If the system is allowed to evolve for long enough, it will eventually end up in one of possibly several attractors, where it will remain. These attractors are thought of as stable cell types. An attractor can be a single stable state, or it can be cyclic, consisting of a series of states which are continually transitioned though.
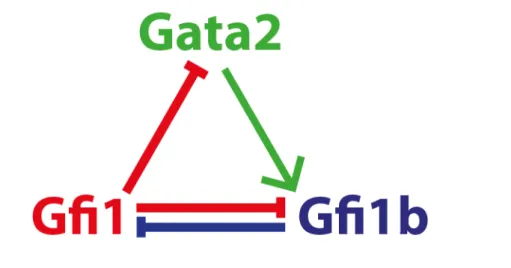
Figure 1.4Gata2, Gfi1 and Gfi1b form a regulatory triad (Moignard et al. (2013a)).
1.2.2.1 Network motifs
Early work on modelling haematopoiesis focused on identifying small “network motifs” consisting of a few regulatory factors and investigating their effect on cellular decision mak-ing, both experimentally and through mathematical modelling. The theory of network mo-tifs has been studied in detail by Alon, who has identified and experimentally characterised several classes of network building blocks that recur throughout biological networks and across organisms, more often than would be expected at random (Alon (2007)).
Motifs that have been identified to be active in haematopoiesis include a double-negative loop between Gata1 and Pu.1 in adult haematopoiesis, in which Gata1 and Pu.1 repress each other and activate their own expression (Arinobu et al. (2007); Chickarmane et al. (2009); Duff et al. (2012); Huang et al. (2007); Monteiro et al. (2011); Roeder and Glauche (2006); Wontakal et al. (2012)). Once activated, this motif locks the cell into one of two classes of states: Gata1 on, Pu.1 off; and Gata1 off, Pu.1 on. This bifurcation dynamic potentially explains why Pu.1 expression in the erythroid–myeloid lineage triggers monocytic differen-tiation, while Gata1 expression triggers erythroid and megakaryocytic differentiation (dis-cussed above). Pu.1 expression would activate the expression of downstream monocytic genes, and, by repressing Gata1, prevent Gata1 activation of erythroid and megakaryocytic genes (and vice-versa).
Another example is the fully connected Scl-Gata2-Fli1 triad, activated in the specification of HSCs in the embryo, and thought to be a central player in the haematopoietic stem cell network (Pimanda et al. (2007)). In this motif, the three transcription factors cooperate to positively regulate each other and maintain mutual expression, by binding to the Gata2-3,
Fli1+12, and and Scl+19 distal enhancers. This motif is thought to be rare in prokaryoctes, but exists in other stem cell systems, for example the Nanog-Oct4-Sox2 triad in embryonic stem cells (Boyer et al. (2005); Chickarmane et al. (2006)). It has therefore been suggested that this motif is involved in maintaining the stem cell state, and that down-regulation of any member of the triad by an external factor, for example Gata2 repression by Gata1, results in exit of the stem cell state and promotes differentiation.
A mathematical model of the Scl-Gata2-Fli1 triad was built, using ordinary differential equations (ODEs) to model continuous change of protein levels over time, and a thermody-namic analysis of enhancer activity levels to estimate kinetic parameters for TF-DNA and TF-TF binding affinities (Narula et al. (2010)). Mathematical analysis of this model reveals that it exhibits bistability, where initial activation locks the triad into a self-sustaining “ON” state, and a repressor protein must persist for a significant period of time in order to switch the system back into an “OFF” state.
A third example is the Gata2-Gfi1-Gfi1b triad active in HSCs (identified via gene expres-sion profiling of single-cell cells and examining gene expresexpres-sion correlation, Moignard et al. (2013a)). In this motif, which resembles a “type 2 coherent feedforward loop”, Gata2 mod-ulates the mutual inhibition of Gfi1 and Gfi1b (Figure 1.4). It has been suggested that this motif may be involved in differentiation and exit of the stem cell state. Ultimately, how-ever, decision making cannot be understood by studying network motifs in isolation, and instead it must be understood how they fit into larger gene regulatory networks. Pu.1-Gata1 antagonism, for example, has been shown to be context-dependent (Monteiro et al. (2011); Sugiyama et al. (2008)).
1.2.2.2 Developmental gene regulatory networks
Wider gene regulatory networks in development are better understood in invertebrate model organisms, such as Drosophila and the sea urchin. Perhaps the best understood gene regu-latory network is the network governing endomesodermal specification from early cleavage
up to gastrulation in the purple sea urchin embryo (Strongylocentrotus purpuratus). This
network has been studied for over thirty years by the Davidson lab (Damle and Davidson (2012); Davidson (2006, 2010); Peter and Davidson (2011)). The result of these studies is a Boolean computational model which consists of a Boolean variable (a value of 1 represents “expressed”, and 0 “unexpressed”) for each of the 45 regulatory genes expressed during this process, together with a logical equation which specifies how the gene is regulated by the other genes (Peter et al. (2012)). Each gene is only expressed when the correct
combina-tion of regulatory inputs is expressed. The model also incorporates spatial and signalling information.
The model can be executed, starting from an experimentally-determined initial state where genes expressed in the earliest developmental stage are turned on. The dynamics of the model proceeds in a series of synchronous time steps where the value of each gene is updated based upon the value of its inputs from the previous state. At several places in the regulatory logic time delays are incorporated to allow states to depend on the value of older states than the previous state. This is to account for differences in the time it takes factors to be transcribed, translated and find their binding sites. Remarkably, the predicted temporal and spatial gene expression patterns which result from execution of the model were found to be in near complete agreement with observed experimental data. Only 2 out of 33 measured genes were found to be expressed in incorrect spatial domains, and only 39 elements in a
45×106 temporal expression matrix were in disagreement with experimental data. This
demonstrates that a systems-level mechanistic understanding of development can emerge from a Boolean model based purely on regulatory logic.
A second class of predictions comes from in-silicoperturbations, in which a gene’s
regu-latory logic is changed so that it is always expressed (over-expression) or never expressed (knock out). The results can then be compared to experimental perturbations. Here again the model was found to be in agreement with experimental data. The model is therefore able to explain nearly all existing experimental data and is a powerful tool to generate predictions which can be used to design new experiments.
1.2.2.3 Stem cell gene regulatory networks
Gene regulatory networks active in stem cells can be expected to have qualitatively different topology and dynamics to those active during development. Developmental gene regulatory networks can follow a principle of “forward-momentum”, where the cell is driven from a multipotent state to a final differentiated stable state by transiting through a series of progres-sively more restricted states. Once initiated, this process can happen fairly autonomously, although external stimuli may be integrated via signalling at each stage. Stem cells, on the other hand, have two seemingly conflicting properties: stability of the multipotent state to support self-renewal, and plasticity for differentiation.
In an elegant theoretical work, Suzuki, Furusawa and Kaneko investigated all possible 5-gene networks in a class of ODE models with cell division and where a single regulatory factor quickly diffuses completely freely between all cells, introduced to model
cell-to-cell communication (Suzuki et al. (2011)). Of the 145,269,760 gene regulatory networks considered, 15,145 had differentiation dynamics, and just 231 showed both unidirectional differentiation and indefinite self-renewal. In these 231 models, the cell begins in a stem cell state where gene expression levels oscillate. The cell then divides to produce more stem cells which continue to exhibit oscillatory gene expression, but where the phases of oscillations are not synchronised between cells. Cell-to-cell communication then is the trigger which forces cells to differentiate, by driving cells out of the oscillating stem cell attractor. Crucially, only cells at a certain phase of oscillation are sensitive enough to this perturbation to differentiate, and so a pool of self-renewing stem cells is always maintained while differentiated cells are also produced.
This theory suggests that oscillatory dynamics is key to stem cell gene regulatory networks, and that stem cell GRNs can be expected to feature oscillation-generating motifs such as negative feedback loops. This is in line with evidence from single-cell studies that demon-strate stem cells show significant heterogeneity in gene expression (Canham et al. (2010); Chambers et al. (2007); Chang et al. (2008); Hayashi et al. (2008); Huang (2009); Macarthur and Lemischka (2013); Moignard et al. (2013a); Toyooka et al. (2008); Warren et al. (2006)), and that haematopoietic cytokines directly induce differentiation and lineage choice rather than only promoting survival of cells that have already committed to a particular lineage as a result of internal decision making (Mossadegh-Keller et al. (2013); Rieger et al. (2009); Sar-razin et al. (2009); Thalheimer et al. (2014)). Several transcription factors have also been found to show oscillatory expression dynamics in imaging studies - for example, Hes1, Nanog, Rex1, Stella and Hex in embryonic stem cells (Chambers et al. (2007); Hayashi et al. (2008); Hirata et al. (2002); Kageyama et al. (2007); Kalmar et al. (2009); Kobayashi and Kageyama (2010, 2011); Kobayashi et al. (2009); MacArthur et al. (2012); Miyanari and Torres-Padilla (2012)).
1.2.2.4 Haematopoietic gene regulatory network models
Recently, two asynchronous Boolean network models of haematopoietic gene regulatory networks have been built, one modelling the common myeloid progenitor and one the haematopoietic stem cell. In an asynchronous Boolean network, each transcription fac-tor is represented by a Boolean variable together with a Boolean update rule that specifies its regulatory logic. Unlike the synchronous Boolean model described above for sea urchin development, the dynamics of these models proceed by a series of single–gene changes. At each update, a gene is chosen uniformly random and its value is updated based upon the value of all genes. This allows stochastic decision making to be incorporated, and means
Figure 1.5A Boolean model of the core transcription factor network active in common myeloid progenitors. (a) Visual representation of the common myeloid progenitor reg-ulatory network model as encoded by the Boolean update rules from Krumsiek et al. (2011). Blue edges represent activation and red edges repression. Square boxes connect-ing edges represent AND operations. (b) Schematic of the adult hematopoietic hierarchy in bone marrow. The CMP is regulated by the network in (a) to produce multiple outputs: the granulocyte–monocyte progenitor which gives rise to granulocytes, monocytes and other myeloid cells, and the megakaryocyte–erythroid progenitor, which produces erythro-cytes and megakaryoerythro-cytes. HSC, hematopoietic stem cell; MPP, multipotent progenitor; CLP, common lymphoid progenitor; CMP, common myeloid progenitor; MEP, megakary-ocyte–erythroid progenitor; GMP, granulocyte–monocyte progenitor.
that different executions of the same model can result in different outcomes.
Krumsiek and Marr et al. constructed an asynchronous Boolean network model of the core transcription factor network active in common myeloid progenitors, following a compre-hensive literature survey (Krumsiek et al. (2011)). This model contains 11 haematopoietic transcription factors (Figure 1.5). The complex combinatorial logic governing the inter-actions between transcription factors is encoded as Boolean update rules using the logical functions And, Or and Not. For example, Gata2 positively regulates its own expression, and is inhibited by Gata1 and Fog1. As both Gata1 and Fog1 are required to repress Gata2 ex-pression, they are combined using And in the Boolean update rule for Gata2. Computational analysis of this model, beginning from an initial transcription factor expression state repre-senting the common myeloid progenitor, revealed an acyclic, 232-element hierarchical state space which recapitulated the steps of myeloid differentiation. This state space contained four terminal stable states, which were found to be in good agreement with microarray ex-pression profiles of megakaryocytes, erythrocytes, granulocytes and monocytes. Once it had been established that this model recapitulated myeloid differentiation, further analyses based upon perturbations to the network were conducted. This analysis demonstrated that
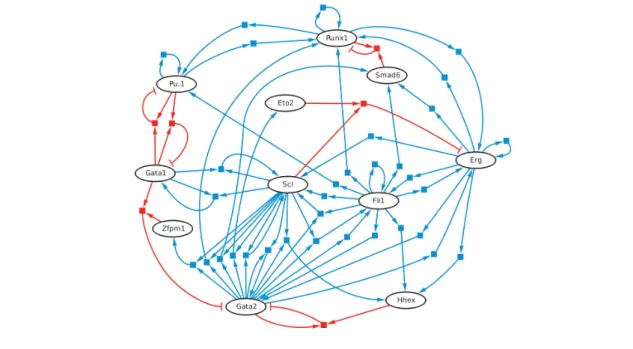
Figure 1.6A Boolean model of the core transcription factor network active in haematopoi-etic stem cells, from Bonzanni et al. (2013). Blue edges represent activation and red edges repression. Square boxes connecting edges represent AND operations.
in-silico knockouts were able to reproduce known experimental lineage depletion results
and thatin-silicooverexpression reproduced known experimental reprogramming results.
Bonzanni, Garg and Feenstra et al. built a similar model consisting of another set of 11 haematopoietic transcription factors together with experimentally-determined regulatory logic that governs their expression in HSCs (Bonzanni et al. (2013), 1.6). Interestingly, this model exhibited an oscillating “stem-cell” attractor consisting of 32 connected states, which cannot be exited without external intervention. This is in line with the theory of oscillating stem cell gene regulatory networks discussed above. Forced expression of tran-scription factors is able to commit the model to exit from this attractor and to reach one of 11 stable states, which again were found to be in good experimental agreement with ex-pression profiles of mature blood cell types. Analysis of this model led to the prediction of a new repressive regulatory link between Gata1 and Fli1, which was then subsequently validated. Without this link, expression of Gata1 alone is not sufficient to drive the model out of the stem cell attractor and to differentiate to the erythroid stable state, although it is known that Gata1 overexpression leads to erythro-myeloid commitment experimentally. After introducing this new link, the model behaves as expected. These results on modelling adult haematopoiesis using asynchronous Boolean networks are highly encouraging, and should form the basis of future work. Currently, no similar model exists for developmental
haematopoiesis.
Predictions about the modes of interaction between genes resulting from computational analysis can be tested experimentally through a range of assays. For example, if analysis of a model predicts that gene X is activated by gene A, a ChIP (Chromatin ImmunoPrecipitation) assay can be used to assess whether the protein coded for by A binds to a regulatory region of X. Then, perturbations which prevent the binding of A to this region can be introduced, and the effect that this has on the expression of X can be examined.
1.2.2.5 Abstraction
An important issue that must be considered when attempting to model a system is the level of detail which the system will be represented at. Biological systems have been modelled at different levels of abstraction. At the lowest level are stochastic process models which attempt to capture the precise biochemical events inside a cell, given by chemical master equations (Paulsson (2004); Pedraza and Paulsson (2008); Sjöberg et al. (2009); Van Kam-pen (2007); Wilkinson (2012)). These chemical events are fundamentally stochastic, driven by random fluctuations of molecules present at very low concentrations (and therefore mod-elled by discrete rather than continuous variables) and by Brownian motion. Stochastic process models can be simulated using the Gillespie algorithm and analysed using mathe-matical tools such as the fluctuation–dissipation theorem (Becskei et al. (2005); Chandler and Percus (1988); Gillespie (1977); Paulsson (2004); Sjöberg et al. (2009); Van Kampen (2007)). This class of models has been used to construct small “toy” systems in order to con-duct fundamental studies of stochasticity in gene expression (Amir et al. (2007); Elf et al. (2003); Hilfinger and Paulsson (2011); Hilfinger et al. (2012); Huh and Paulsson (2011a,b); Ozbudak et al. (2005); Paulsson (2004, 2005a,b); Pedraza and Paulsson (2008); Zhou et al. (2005)), such as obtaining limits on the suppression of fluctuations by negative feedback loops (Grönlund et al. (2011, 2013); Lestas et al. (2010)).
At a higher level are ordinary differential equation models, which abstract away the discrete copy number of molecules and model molecular concentrations as continuous variables, and reactions as continuous changes in concentrations over time (Elowitz and Leibler (2000); Krumsiek et al. (2010); Mischnik et al. (2014); Narula et al. (2010); Wilhelm (2009)). Anal-ysis of these models is more tractable than analAnal-ysis of stochastic processes, allowing them to scale to model larger systems, but their dynamics are deterministic and continuous and so fail to capture the stochastic nature of gene expression.
dif-ferent parameter values and completely difdif-ferent models can equally fit the same data. For example, fluctuations in protein abundances, which are usually assumed to be due to stochasticity in transcription and translation, can be equally well explained by a model where noise is due to unequal partitioning of molecules between daughter cells at cell di-vision (Huh and Paulsson (2011a,b); Landgraf et al. (2012)). These results can be taken as an argument against trying to build exact quantitative physical models of gene regulatory networks. Given that the processes we are interested in are under-determined, with many unknown reactions, and that kinetic parameters for binding, transcription, translation and degradation rates are unavailable and currently difficult to measure, we should instead try to build more abstract models that capture the essential qualitative properties of the system, and operate at a level for which experimental data is available.
The remarkable success of Boolean models, both in modelling the development of the sea urchin embryo and in predicting haematopoietic cell states from regulatory logic, motivates their use in modelling gene regulatory networks. Asynchronous Boolean networks abstract away details of transcription, translation and molecular binding reactions and represent the status of each modelled substance as either active (on) or inactive (off), while retaining the stochastic nature of events, and capturing the regulatory logic determining whether a gene is activated or not by Boolean update functions. The simplicity of these models means that they can scale to much larger systems, and that powerful computational techniques can be applied to analyse them. It also means that it may be possible to automatically reconstruct them directly from single-cell gene expression data.
1.3
Computational analysis of high–dimensional single–cell
gene expression data
Recent advances in protocols, microfluidics technology, and a reduction in costs have opened up a new field of single-cell genomics. This new field promises to provide insights into cellular identity and decision making over more conventional bulk population data, which averages over the properties thousands of cells and therefore obscures the state of individual cells (Moignard and Göttgens (2014)). Single-cell qPCR can simultaneously measure the level of expression of tens to hundreds of genes, while the newer technique of single-cell RNA-sequencing can sample the whole transcriptome.
After experimental measurement, data must firstly be processed and normalised to ensure correct interpretation. Once these steps have been carried out subsequent analysis can be
Figure 1.7Overview of different single-cell analyses.
applied to answer specific biological questions.
Typically one of the first questions a researcher will want to ask about their single-cell ex-pression data set is whether interesting sub-populations with characteristic gene exex-pression profiles can be identified (Amir et al. (2013); Buganim et al. (2012); Dalerba et al. (2011); Jaitin et al. (2014); Moignard et al. (2013a); Wilson et al. (2015)). These sub-populations might represent previously unidentified cell types or cells with an abnormal phenotype. For example, in a study of the immune system, two separate populations might correspond to activated and naive cells, or in a patient sample, to cancerous and healthy cells (Mahata et al. (2014); Patel et al. (2014); Shalek et al. (2014); Spitzer et al. (2015)). Once identified, the sub-populations can be isolated and investigated further. Population-level gene expression data, on the other hand, would average out the differences between these groups, giving a representative view of neither.
Once structure has been identified, the researcher can investigate potential biological pro-cesses that have been captured in the data. Often, the data are representative of a develop-mental or differentiation time-course, with early cells such as stem cells or early progenitors progressing to more mature cells (Bendall et al. (2014); Moignard et al. (2015); Trapnell et al. (2014)). In this case, the single cell profiling data set can be used for gene regulatory network reconstruction. I will describe several techniques for reconstructing regulatory net-works (Figure 1.7). Some of these methods have been adapted from analyses of population data, and some have been specifically developed to take advantage of single-cell resolution data.
1.3.1
qPCR on the Fluidigm BioMark
The Fluidigm BioMark platform uses microfluidics devices to scale back reagent and sam-ple requirements, thereby facilitating thousands of parallel qPCR reactions and allowing up to 96 genes to be assayed in a single cell. Initial data processing takes place using the Flu-idigm Real-Time PCR Analysis Software. Like conventional qPCR, the BioMark outputs Ct values, and the software allows sample and assay names to be assigned along with the quality thresholds, baseline correction methods and Ct thresholds used to calculate the final Ct values.
Next, expression values that fall outside of the linear range of the BioMark HD or the assays are excluded from further analysis. To do this, a limit of detection (LOD) is calculated from standard curves for each primer set as the last Ct value at which amplification can be reliably and repeatedly detected (Livak et al. (2013); Trapnell et al. (2014)). Ct values higher than the LOD, as well as samples where the amplification has failed entirely or where the amplification curves have failed quality control are usually given the same value as the limit of detection and treated as not detected.
Additional filtering can be used to exclude whole genes or samples. For example, genes may be excluded where there is amplification in typically >10% of no template controls, and where the amplification level in no template controls is too similar to that of single cells to be sure that the expression in the cells is real. In published studies, cells have been excluded from the analysis based on a number of criteria, including lack of expression of key or housekeeping genes, expression of no or low numbers of cells, or where the expression of particular genes differs significantly from the population (Buganim et al. (2012); MacArthur et al. (2012); Moignard et al. (2013a); Pina et al. (2012)), although these can also occur due to the choice of genes and transcriptional bursting rather than due to a poor quality or missing cell.
Single cell expression data are typically log-normally distributed so it is useful to view data on a Log2 scale. The final step of processing therefore converts the data either to
∆Ct values normalized against one or more housekeeping genes which exhibit stable
ex-pression across the populations (Buganim et al. (2012); Guo et al. (2010); MacArthur et al. (2012); Moignard et al. (2013a, 2015); Pina et al. (2012); Swiers et al. (2013a)), or as the Log2 expression above the LOD (PCR cycles above background; Log2Ex Guo et al. (2013); Stahlberg et al. (2011)). Log2Ex values can be further normalized to remove variability due to factors such as cell size (Livak et al. (2013)).
1.3.2
Single cell RNAseq
Single cell RNAseq (scRNAseq) has recently come to the fore for transcriptomics due to increases in multiplexing and concurrent decreases in price. Compared with qPCR, it offers the potential to study the entire transcriptome rather than a specific set of pre-selected genes, so has a much wider potential for discovery. However, there are many current challenges both for processing samples and analyzing data (Macaulay and Voet (2014); Stegle et al. (2015)).
There are many different scRNAseq protocols which can capture different aspects of the transcriptome depending on the priming and reverse transcription (RT) methods used. Typ-ically, either the 5’ or 3’ end of the transcript is captured (Hashimshony et al. (2012); Islam et al. (2011)), although some methods can capture entire transcripts (Picelli et al. (2013); Tang et al. (2009)). Samples are multiplexed using indexed primers during library prepa-ration, with 96 to 384 individual cells sequenced per lane of a flow cell. After sequencing, samples are deconvoluted based on index sequences, and normalised read counts are gener-ated for further analysis. Alternatively, short and unique DNA sequences (unique molecular identifiers, UMI) can be incorporated into every transcript during the RT step to act as bar-codes to enable molecule counting. Regardless of how many times a transcript-UMI pair is sequenced, it can only have come from a single mRNA within the cell and so is only counted once, with the total number of UMIs per transcript summed to give an absolute expression count for each gene (Kivioja et al. (2011)). However, this currently only allows for the sequencing of the 3’ end of the transcript, providing information about expression levels but not splicing.
Quality check of samples is an important step before downstream analysis. An important quality control method for scRNAseq is the inclusion of extrinsic standards to facilitate normalization and comparison between single cells. Typically, RNA standards of known concentration and sequence, such as the External RNA Control Consortium (ERCC) set of 92 artificial RNA molecules (Jiang et al. (2011), are spiked into the reverse transcription step. These molecules should be amplified uniformly across samples, so can be used to es-timate RT efficiency, technical variation in library preparation and to indicate which genes show real biological variation as well as technical noise. Spikes can additionally be used to identify cells with degraded RNA, for example where the percentage of mapped reads is particularly low compared with reads mapped to spike molecules. Other important metrics which are used for quality control and to discard poor-quality cells include the fraction of reads mapped to mitochondrial genes (a large fraction is believed to be indicative of the cell undergoing apoptosis — Islam et al. (2014); Stegle et al. (2015)). Principal component
anal-ysis (discussed later), can also be used to identify outlier cells, based upon the assumption that good-quality cells will cluster together while poor-quality cells will be isolated (Stegle et al. (2015).
Samples undergo initial quality control prior to alignment, with tools originally developed for bulk RNA-seq such as fastqc which monitor sequencing quality, GC nucleotide content, sequence length and so on. Reads are assigned to individual cells based on their indexes, the sequencing adapters are trimmed off and the resultant sequences are mapped to a refer-ence transcriptome using existing alignment tools such as TopHat (Trapnell et al. (2009)), Star (Dobin et al. (2013)) or GSNAP (Wu and Nacu (2010)). Tools such as HTseq (Anders et al. (2014)) are then used to generate read counts per gene. Further quality control, as dis-cussed above, can then be carried out. Normalisation is required to account for differences in sequencing depth between samples, which is calculated from the total mappable reads and the ratio of mapped reads to those coming from spike molecules. However, adequate normalization of scRNAseq data is an ongoing challenge (Stegle et al. (2015)) as much is still unknown about technical variation in library preparation and sequencing bias towards particular transcripts.
1.3.3
Visualisation
High-dimensional data sets can be hard to visualise. A two or three dimensional data set can be directly plotted to try to reveal structure in the data (Figure 1.8). This is not possible with high dimensional data such as a single-cell gene expression data set, which has a dimension corresponding to each measured gene. In the field of machine learning, a number of cluster-ing and dimensionality reduction techniques have been developed to help aid visualisation of high-dimensional data (Bishop (2006); Hastie et al. (2009)). Clustering algorithms at-tempt to group data points into subsets called clusters, where data points within a cluster are more similar to each other than to points from different clusters. Dimensionality reduction algorithms attempt to transform the high-dimensional data set into a lower-dimensional (2 or 3) representation that can then be directly plotted and visualised.
1.3.3.1 Hierarchical clustering
Agglomerative hierarchical clustering has been used to identify sub-populations in single-cell data (Guo et al. (2013); Moignard et al. (2013a)). Rather than seeking to identify a predetermined number of clusters, the algorithm recursively builds a hierarchical
represen-HoxD8 HoxB2 Tbx3 Tbx20 Etv2 Tal1 Lmo2 Procr HoxB4 Kit Hhex Etv6 Kdr Notch1 Sox7 Egfl7 Fli1 Ets1 Ets2 Cdh5 Erg Meis1 Mecom Sox17 Cdh1 FoxO4 FoxH1 Ldb1 Mitf HbbbH1 Gata1 Nfe2 Gfi1b Ikaros Runx1 Myb Itga2b Cbfa2t3h Lyl1 Pecam1 Sfpi1 Gfi1 High Low ND −10 −5 0 5 dCt b
a Transcription factor co−expression
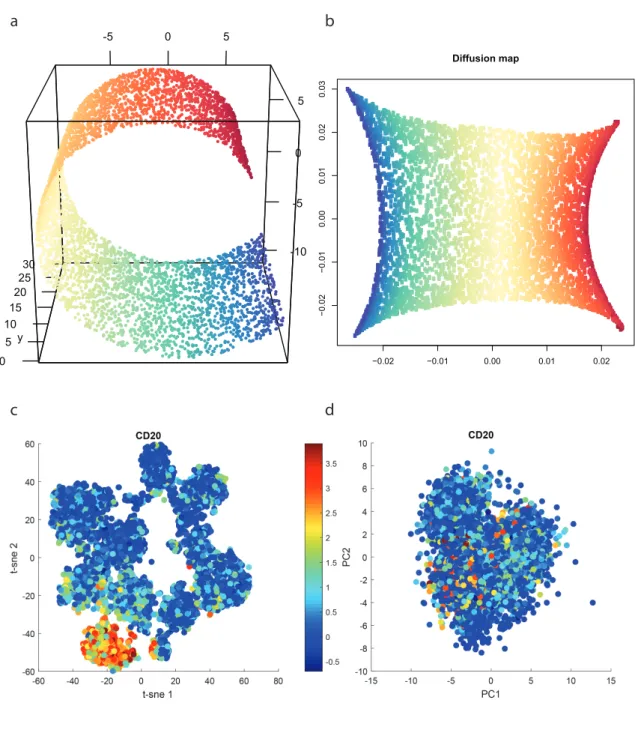
−15 −10 −5 0 5 −15 −10 −5 0 5 −15 −10 −5 0 Sox17 H oxB4 Erg
Figure 1.8High-dimensional data can be hard to visualise. (a) Plotting the expression of
three genes against each other to try to uncover their relationship. (b) Hierarchical cluster-ing of a high-dimensional scluster-ingle-cell qPCR data set with 40 genes and 3934 cells. Rows represent genes and columns represent cells. Left-hand side colour bar shows measured
∆Ct level of expression of genes. Top colour bar shows cell types—blood cell progenitors
(red) fall into one large cluster while other cell types separate into two more large clusters and do not separate by cell type.