Volume-6, Issue-10, Oct.-2018, http://iraj.in
INVESTIGATION ON HUMAN ACTIVITY RECOGNITION BASED ON
SUPERVISED MACHINE LEARNING ALGORITHMS
1
SAM GILVINE SAMUVEL, 2PRAYWIN MOSES DASS ALEX, 3AKASH RAVIKUMAR
1
Kaunas University of Technology, Studentu 50, Kaunas, LT-51390, Lithuania
2,3
EinNel Technologies, Data Scientist, IoT and AI Team, Chennai, India Email: [email protected], [email protected], [email protected]
Abstract— Recognizing the activities of humans through computer vision techniques is an important area of research.
This area of research leads to various applications such as patient monitoring, fall detection, surveillance and human-computer interface. The capability for recognizing these acts lays foundation for developing highly intelligent and decision making systems. Generally, most of the mentioned applications requires automatic recognition of high-level activities, consisting of simple actions of multiple persons. Usually, the intelligence to the system is delivered only if these activities are properly classified. This paper addresses various machine learning algorithms used in classifying various activities such as Multi-Layer Perceptron, Random Forest, Naïve Bayes and SVM algorithms. This paper provides classification of general to complex human activities through comparison study and performance evaluation of these mentioned algorithms using very large set of images. This review will provide much needed information for further research in more productive areas.
Keywords: Behavior Analysis and monitoring; Machine learning; Histogram of Oriented Gradients(HOG) Descriptor; Bag
of Visual Words; Local Binary Pattern; SVM; Naïve Bayes; Random Forest; MLP
I.INTRODUCTION
The major goal of activity recognition is to identify the actions of one or multiple human subject from a series of observations on the subject’s activities and his surrounding environmental conditions. The activity recognition pays dividends while monitoring elderly people and physically challenged people. The activities of such kinds of individuals must be closely monitored to predict their discomfort, their behavior and possible danger that can consume their life. Both the people in this category will have troubled behavioral patterns which also could lead to unprecedented and unpredictable event such as fall. But one of the major goal in this research is o prevent fall. There are many sensor based systems that can be used to recognize human activities [1]. The sensors such as accelerometer, gyroscope and kinect can be used to recognize and monitor a individuals activities [2]. Further, they can be used along with the other sensors such as Electrocardiogram (ECG), Electroencephalogram (EEG) and pulse rate sensors to recognize behavior and their actions resulting due to their discomfort [4]. But, research says that the sensors used for activity monitoring provides low accuracy and much more discomfort [4]. When it comes to monitoring activities around the neighborhood for safety, the sensors will not provide possible solutions as they work for only certain range and they can be noticeable [5]. A much more sophisticated approach for behavior analysis is through image processing and computer vision methods. Although the image processing methods provide quite a challenge in
detecting human behavior, but they can be cost effective solution and will also be unnoticeable if it comes to monitoring human activities in the neighborhood. There are several ways that we can use for capturing human images such as using radar, IR, microwave or a general RGB camera [6], [7]. Combination of image processing techniques with sensors that can recognize human behavioral pattern could provide leverage in understanding and recognizing the human activity. Another advantage of image processing techniques over sensor based techniques is that there will be no need for maintenance of hardware which will prove to be a highly cost effective process [8]. There are various techniques in computer vision and image processing to extract features from the image that can relate to human activities, but through these features alone we cannot have the machine to recognize the activity. But it needs the help of proper classifications methods. The combination of computer vision methods along with the behavior monitoring sensor and image classification method will lead to a very promising solution to the problem. This paper will provide research on various machine learning algorithms to evaluate its reliability for human activity recognition using images and video frames. It is necessary to compare various machine learning algorithm based on their result for evaluating their reliability. In this paper, there are four supervised machine learning methods selected for research: Naïve Bayes, Random Forest, Multi-Layer Perceptron and Support Vector Machine (SVM). These methods have been applied on the same set of
Volume-6, Issue-10, Oct.-2018, http://iraj.in images which consists of regular day to day activities
of a normal individual.
II.IMAGEFEATUREEXTRACTION
In this paper, out of various feature extraction methods in computer vision, the Histogram of Oriented Gradients (HOG), Local Binary pattern and Bag Of features method were chosen for carrying of the feature extraction. The HOG is used as feature descriptor extractor in computer vision and image processing for detection of object in an image. This method helps in counting the occurrences of oriented gradients in localized portions of an image. It is same when compared to that of edge orientation histograms, shape contexts and scale-invariant transform descriptors, but is different as it is computed from a dense grid of uniformly spaced cells and it uses the overlapping local contrast normalization for improving the accuracy [9]. The primary step for calculating feature detectors in image pre-processing is to ensure normalization of colour and gamma values. However, the step can be skipped in HOG descriptor computation as the ensuring descriptor normalization usually leads to the same results. Therefore, it is said that the pre-processing of the image provides less impact on performance. Instead, the computation of the gradient values is considered as the first step for calculation. The general way for computations is to apply the 1-D centered, point discrete derivative mask in one or both of the vertical and horizontal directions. Four different methods can be used for block normalization, Let v be the non-normalized vector that contains all histograms in a given block ||v||k be its k-norm for k=1,2 and e be some small constant. Then the normalized factor can be one of the following:
The HOG descriptors are fed into various machine learning algorithms as features for object recognition. Most of the research paper recorded the usage of Support vector machine (SVM) for classifying the objects by feeding in HOG descriptors as features. However, the HOG descriptors cannot be believed to be used only for specific machine learning algorithms.
The Local Binary Pattern (LBP) is used for classifying objects based on texture. The LBP focuses on points at points which surround the central points and examines whether the points in the surroundings are greater than or less than the central points. The resultant value from an image is obtained as binary output. After the LBP is calculated for the current pixel, the corresponding pixel location is updated in LBP Local mask. If the neighbouring pixel values is greater than or equal that the current pixel value, the corresponding bit is set to 1 in the binary array else
the bit is set to zero. Once the LBP mask is calculated, the LBP histogram is calculated. Since the LBP value varies from 0 to 255, the size of the LBP descriptor will be 1x256. The following result is then normalized. The Advantage of LBP is that it is translation and illumination invariant.
The Bag of Visual Words (BoVW) is a famous method used for image classification, inspired by models used in Natural Language Processing (NLP). It arranges the images in the form of word arrangement (spatial information from the image) and finally classifies the images based on the histogram of the visual words frequency [10]. The Visual Vocabulary is formed from the set of visual words, which results in large corpus of features when clustered. In this manner, the informative regions otherwise referred to as the visual words are derived from local feature space and the collection of these information regions is called as visual vocabulary. The Process flow of BoVW for representing image consists of the following steps: (i) extraction of local features from the image, (ii) Encoding the extracted features to build visual words and (iii) performing spatial binning. In, feature extraction, Local features are extracted. The local features constituent the base for the method developed to automatically recognize an object [11]. The common method used for extracting the local feature is through Scale Invariant Feature Transform (SIFT). During encoding, the step maps are created for the visual vocabulary that is created. Hard quantization is employed as encoding strategy which assigns each feature to the nearby centroid. A consolidated way of introducing spatial information in the BoVW is the use of spatial Histogram. The results presented proves that the reduction of vocabulary size for human actions description improve classification accuracy [12], [13]. The experimental validations of the vocabulary reduction for classifying the actions were promising when combined with other techniques [7], [14], [15]. This paper will cover the usage of SVM along with the other aforementioned machine learning algorithm to see which method best suits for classify images of these types when HOG descriptor, LBP features and BoVW are fed in as features.
III.IMAGECLASSIFICATIONMETHODS
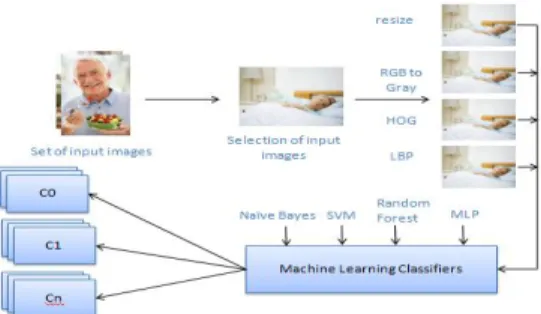
I. The general process flow of human activity recognition and classification involves all the – mentioned methods in Fig 3. Depending on the algorithms chosen, the different mentioned algorithms are imposed on the images. For example, in case of K near neighbor (KNN), it is best if the images are converted from RGB to LAB, whereas for SVM, the image should be converted to grayscale and then to the binary images. If deep learning
Volume-6, Issue-10, Oct.-2018, http://iraj.in algorithms are applied, such as Convolution Neural
Network (CNN), resizing the image can be optional, but it is best if the images are resized as it will provide much useful information as a small rate.
Figure 1 Flow diagram for image processing and classification A. Random Forest Algorithm
The first method proposed in this paper for classification is Random Forest Method [16]. Random Forest also related to as random decision forest are referred to as ensemble learning method not only used for classification, but also used for regression and other tasks, that works by constructing multiple decision trees at the time of training and computes the class that is the mode of the class (classification) or mean prediction (regression) of a single tree. The first algorithm was constructed by Tin Kam Ho [16] by using the random space method, in which Tin’s formulation uses a way to implement “stochastic discrimination” approach for classification proposed by Eugene Klienberg [17], [18], [19]. As mentioned in the previous section, the decision trees are a popular method for various machine learning tasks. The tree learning meets the requirement for off-the-shelf procedure for data mining as it is invariant under scaling and other various transformations for feature values, is robust to inclusion of irrelevant features and produces inspect-able models. However, there aren’t often accurate. The trees that are grown very deep tend to learn highly irregular patterns. They operate as a way to average multiple deeply grown decision trees trained on different parts of the same training sets as the goal is to reduce variance. The training algorithm for random forests applies the general technique of bootstrap aggregating, or bagging to tree learners. For a given training set X=x1,……., xn with response Y = y1,……yn, bagging repeatedly (B times) selects a random sample replacement of the training set and fits trees to these samples:
For b = 1, …, B:
1) Sample, with replacement, n training examples from X,Y, call these Xb, Yb.
2) Train a classification or regression tree fb on Xb, Yb.
The predictions for the unseen samples x’ can be made by averaging the predictions from all the individual regression trees on x’. Along with this, an estimation of the uncertainty for the prediction can be made as the standard deviation of the predictions from all the individual regression trees on x’. The number of trees/samples here is considered as a free parameter. Typical, few hundred to thousand trees are used for the process. Adding another step to proceed the randomization which will yield extremely randomized trees, or extra tress. These trees are trained through random subspace and bagging method. Feeding the accelerometer data to the decision tree for classification, it has given the higher accuracy rate of 99.80% compared to other machine learning techniques. But the goal is to provide such accuracy without the usage of wearable.
B.Support Vector Machine
The Support vector machine belongs to the class of supervised machine learning algorithms called the kernel methods. These classifiers are ideal for binary data for machine learning. Since one of the major feature extraction method described in the paper is HOG, this algorithm is the favorite to provide higher accuracy, given the accolades the other machine learning algorithms hold. Generally, the SVM was created to be used for two classes as a hyper plane will be drawn to separate two classes of data. Based on the distribution of the training sets on the plane, the SVM would generally categorize the data into either of the classes. But the SVM are modified and can be used for multiclass implementation. There are two approaches discussed, first being ‘one on one’ where resulting class is obtained by majority of the votes of all the classifiers. The other suggested method is “one against all” where the classifiers are trained to classify each class from the other [20]. The recognition of various simple activities carried out by the individual can be recognized without a doubt using the SVM classifiers. But the accuracy of this method has dropped down to 71.63% when trying to classify much complex task. Similarities between different actions can be intervened with match features in different sequences of action.
C.Naïve Bayes
It is a classification technique derived from Bayes Theorem through assumption of independence between the predictors. The classifier assumes the presence of feature in a class is completely unrelated to any other features. Even if the features are dependent on others, they independently contribute to calculate the probability to classify the action class. These classifiers are particularly handy for models which consist of huge datasets. This classifier on a given day can outperform any other sophisticated classifier. The theorem provides
Volume-6, Issue-10, Oct.-2018, http://iraj.in approach for calculating posterior probability P(c|x)
from P(c), P(x) and P(x|c).
P(c|x) =
(1)
The first step in the algorithm to convert the huge data set in the frequency table. As soon as the table is created, a likelihood table by finding the probabilities like Overcast Probability and probability of playing is created. The Naïve Bayesian equation I used to compute the posterior probability of each class. The class with the highest posterior probability will be the outcome of the prediction. These classifiers can be used for real-time predictions as the learning time taken by this classifier is less. This algorithm is also well know for multiclass prediction.
Multi-Layer Perceptron D.Multi-Layer Perceptron
The Multi-Layer Perceptron, otherwise known as MLP is a supervised machine learning algorithm that learns the function f(.) : Rm -> R0 by training on the features constituting dataset, where m is the number of dimensions for input and O is the number of the dimensions for output. For a given set of features X = x1,x2,…….,xm and target y, as it can learn a non-linear function approximator for either regression or classification [i]. However, it is considered different from logistic regression, in that between each input and output layer, there can be one or multiple non-linear layers, referred to as hidden layers. Each hidden layer has a scalar output. The layer at the extreme left is known as the input layer which consists of large sets of neurons {xi|x1,x2,….,xm} representing the input features. The values from the previous layers is transformed by each neurons with a weighted linear summation w1x1 + w2x2 + … + wmxm, which is followed by a non-linear function activation function g(.): R-> R like hyperbolic tan function. The output values are transferred by the output layer from the last hidden layer. The advantage of this type of method is that, it has the capability to learn even non-linear models and also to learn the models in real time using partial fit. By keeping the other parameter the same and reducing the hidden nodes to 40% reduced the average accuracy of 92% to 51% for human activity recognition. It is aid that the use of MLP network based on the feed forward artificial neural network done to train the KTH action data set achieved the accuracy of 92%.
E.Evaluation of Algorithms Accuracy
The confusion matrix is representation of Mnxn (n is equal to the amount of categories) for all the machine learning algorithms. The confusion matrix represents the elements Mij as the amount of instance from the category i that were actually classified as a category j [22].
T he confusion matrix for classifiers contains four elements as shown in table: True Positive represents the amount of rightly classified instances; True Negatives represents the amount of rightly classified negative instances; False Positives represents the number of false instances that were classified as positive; False Negative represents the amount of positive instances that were classified as a negative instance.
The accuracy is the universally used metric for generalizing the classification results. The metric is represented through formula as:
Accuracy (2)
The accuracy and the confusion matrix are used for n categories where the value of n must be more than 1. In such case, the instance could either be positive or negative according to the categories.
II.EXPERIMENTS A.Human Activity categories
As there are lots of research going in this field, lots of reports say that categorising human activities from a still image is a tedious process. The reason to that is because of the background of the image and no background subtraction can be done from a still image. Though there are some libraries that support this task, the chances of achieving promising results are limited. The other problems with recognizing objects from a still image are lighting and coverage of other areas that does not fall in the region of interest. More complications arise when categorising human actions as similar actions will lead to much of a challenge. There is no guarantee that the actions performed by one individual will be similar to the other as this will increase the challenge for recognizing human activities [23]. The environment also plays a vital role while recognizing the human action as they also will get covered in the image when processed. Another issue is that, if a system is trained to predict the actions of a human in a particular position, It will tend to recognize actions correctly is it is performed in such a manner or else it will predict some other result to emerge out as output. There are certain actions that are to be monitored for the elderly and physically challenged people. The purpose is to know whether they are able to live their routine life without any trouble. There is no need for these kinds of people to stick to only one location. They will certainly go over the house if they want something or to perform certain tasks. Therefore, the smart systems used for monitoring
Volume-6, Issue-10, Oct.-2018, http://iraj.in shouldn’t be used in only their room but it should
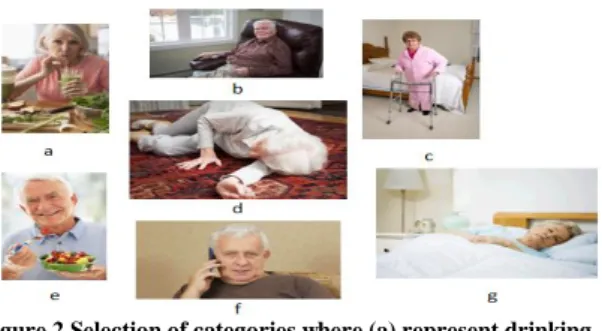
also be used in living room, dining hall and various other places where the human activities can be more. The activities that are to be monitored for such kinds of people are whether they are sleeping, sitting, drinking, eating, walking, fall detection and talking on a phone.
Figure 2 Selection of categories where (a) represent drinking, (b) sitting, (c) walking, (d) fall detection, (e) eating, (f) talking on
phone and (g) sleeping.
In this paper, 7 categories are taken into consideration. It is assumed that the results for human activities are better if performed in bedroom, living room and kitchen. The category I relates to whether the individual under monitoring is asleep or not. The assumption for this category will be better if the person is sleeping on a bed and not in the couch. Category II relates to if the person is sitting. The assumption in this category is that the person is either sitting on a couch or chair but not on the bed. As some people tend to sleep while they sit on the bed. Category III relates to the action of drinking. The assumption is that this is performed in the kitchen as this action must to conflict with the first to categories. Category IV relates to the activity of eating. The assumptions are similar to category III. Category V relates to the action of walking. There is no assumption as this category does not possess conflict with any other mentioned categories. Category VI relates to the detection of falling. There is no assumption as even this category has any links with the other categories. Category VII relates to the action of talking on the phone. This category has conflict with the category I and some minor categorization problems with category II, but will not posses much of a problem to other selected categories.
B.Experimental Results
The image dataset contains the total of 7000 images for all categories combined. Out of these images, 70% of the images were chosen for training through programming (train set) and 30% of images were chosen testing through programming (test set). The splitting of dataset is uniform for each category, which lead to 700 images in each category for training and 300 images in each category for testing.
The experiment was carried out using Sypder IDE (Integrated Development Environment) with python programming language. The python 3.5 version was used to carry out the experiment. Both the IDE and python version are open source. For feature extraction, skimage library was used and it is open source library which can be installed into the anaconda environment through pip command. The SVM, Random Forest algorithm, Naive Bayes and MLP are used from the Scikit Learn library, also known as sklearn library. This library is also open source and it comes along when anaconda package is installed into the system. Apart from this, the experiment didn’t require any sophisticated upgrades to the system to run the program as it needs when using Convolution Neural Network (CNN). The model created by fitting the training class and the training features were exported as .pkl file using sklearn’s joblib library. This model can be loaded to predict the class of the input features given for prediction. In order to understand the model has not over fit, another model for test set was created. The model creation time, loading time and prediction time are given for mentioned classifier in the table I below for the training set.
Table I Model Creation, Loading and Prediction time The Model creation time taken for SVM is approximately 22 minutes, which is the longest of all the classifiers selected in the paper. The second highest is the MLP, which took 15 minutes to build the model. The Random forest algorithm took 13.08 seconds and the Naïve Bayes algorithm took 4.41 seconds to create the model. The execution time and prediction times for all the classifiers are less than 1 second which is an optimal factor.
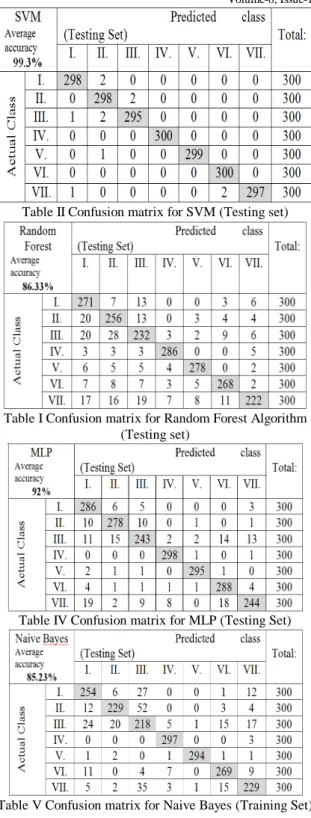
The accuracy score was predicted from the confusion matrix generated (shown from table II – V). The average accuracy obtained on using SVM was 99.3%, random forest with 86.33%, MLP with 92% and Naïve Bayes with 85.23%. The SVM classifier tops the list followed by MLP, Random Forrest and last by Naïve Bayes.
Volume-6, Issue-10, Oct.-2018, http://iraj.in
Table II Confusion matrix for SVM (Testing set)
Table I Confusion matrix for Random Forest Algorithm (Testing set)
Table IV Confusion matrix for MLP (Testing Set)
Table V Confusion matrix for Naive Bayes (Training Set)
Figure 3 Comparison of image classification methods
CONCLUSION
III. This paper presents the research on different machine learning algorithms to classify human activities. Four different classifiers SVM, MLP, Random Forrest and Naive Bayes were used, and their comparison studies were made. The paper includes the research and classification of different categories of human activities. Seven categories selected for the research. The accuracy obtained from all the classifiers were more than satisfactory given the fact that all these images selected had some background objects, variations in lighting and wide spaces. The average accuracy of Naive Bayes was 85.23% which was the lowest of all the categories. The average accuracy for Random Forest was 86.33%, leaving it at the third place. The average accuracy of MLP was 92% percentage leaving it as one of the second-best classifier for the human activity recognition. The SVM classifier tops the list with the average accuracy of 99.3%. The initial accuracy for the SVM classifier was low, but as the parameters were tuned, the accuracy for the system has also increased making it as one of the best classifier for classifying human activity recognition. It was also understood that the classifiers cannot be simply blamed for low accuracy as it all depends on what type of the data we supply to the classifier. Even Convolution neural network will give less accuracy if HOG descriptor or LBP is given in as its input rather than its own requirement. As SVM was considered as one of the best for this purpose in this paper, further research has to be carried out to establish further tuning of SVM parameters and how it can be made equal to the likes of CNN and should be tried on furthermore categories of human activities to verify how it classifies. This work will be implemented on smart system as IoT service for various actions of human.
REFERENCES
[1] J.K Aggarwal and M.S Ryoo, “Human Activity Analysis”, [Electronics] and Telecommunications Research Institute, ACM Journal Name, Vol. V, No. N, Month 20YY. [2] Andreas Bulling, Ulf Blanke, Bernt Schiele, “A Tutorial on
Human Activity Recognition Using Body-Worn Inertial Sensors”, ACM Computing Surveys, Vol. 46, No. 3, Article 33, Publication date: January 2014
[3] X. Zhu, Z. Liu, J. Zhang, “Human Activity Clustering for Online Anomaly Detection,” Journal of Computer, vol. 6(6), pp. 1071-1079, 2001.
[4] P. Gupta, T. Dallas, “Feature Selection and Activity Recognition System using a Single Tri-axial Accelerometer,” IEEE Trans. Biomed. Eng., pp. 1780-1786, 2014. [5] S. Kiruthiga, M. Kalaiselvi Geetha and J. Arunnehru,” Visual
Words for Human Activity Recognition in Surveillance Video”, IOSR Journal of Computer Engineering (IOSR-JCE) e-ISSN: 2278-0661, p-ISSN: 2278-8727 PP 37-43. [6] M. A. A. H. Khan, et al., “RAM: Radar-based activity
monitor,” IEEE INFOCOM 2016, Computer Communications, pp. 1-9, 2016.
Volume-6, Issue-10, Oct.-2018, http://iraj.in [7] A. Dubois, F. Charpillet, “Human activities recognition with
RGB-Depth camera using HMM,” Conf. Proc. IEEE Eng. Med. Biol. Soc., 2013.
[8] Aiste Stuliene and Agne Paulauskaite-Taraseviciene, “Research on human activity recognition based on image classification methods”, IVUS International Conference on Information Technology 2017
[9] Sam Gilvine Samuvel and Praywin Moses Dass Alex, “Investigation on road-sign recognition”, IVUS International Conference on Information Technology 2017.
[10] Scott Newman (senewman), “Scene Recognition Using Bag of Words”, October 24, 2011.
[11] J.R. Cozar, J.M. Gonzalez-Linares and N. Guil, “Visual Words Selection for Human Action Classification”, May 2012
[12] M. Zhang, A. A. Sawchuk, “Motion primitive-based human activity recognition using a bag-of-features approach,” ACM symposium on International health informatics (IHI), pp. 631-640, 2012.
[13] J. C. Niebles, H. Wang, “Unsupervised Learning of Human Action Categories Using Spatial-Temporal Words,” International Journal of Computer Vision, vol. 79(3), 2008, pp. 299-318.
[14] T. D. Campos et al., “An evaluation of bags-of-words and spatio-temporal shapes for action recognition,” IEEE Workshop on Applications of Computer Vision (WACV), 2011.
[15] M. M. Ullah, S. N. Parizi, I. Laptev, “Improving Bag-of-Features Action Recognition with Non-Local Cues,”
Proceedings of the British Machine Vision Conference, pp. 1-11, 2010.
[16] Ho, Tin Kam (1995). Random Decision Forests (PDF). Proceedings of the 3rd International Conference on Document Analysis and Recognition, Montreal, QC, 14–16 August 1995. pp. 278–282.
[17] Kleinberg E (1990). "Stochastic Discrimination" (PDF). Annals of Mathematics and Artificial Intelligence. 1 (1-4): 207–239. doi:10.1007/BF01531079 [18] Kleinberg E (1996). "An Overtraining-Resistant Stochastic
Modeling Method for Pattern Recognition". Annals of
Statistics. 24 (6): 2319–
2349. doi:10.1214/aos/1032181157. MR 1425956. [19] Kleinberg E (2000). "On the Algorithmic Implementation of
Stochastic Discrimination" (PDF). IEEE Transactions on PAMI. 22 (5).
[20] C. W. Hsu, C. J. Lin, “A comparison of methods for multiclass support vector machines,” IEEE Transactions on Neural Networks, vol. 13(2), pp. 415-425, 2002.
[21] Jonti Talukdar and Bhavana Mehta, “Human Action Recognition System using Good Features and Multilayer Perceptron Network”, ICCSP 2017.
[22] O. D. Lara, M. A. Labrador, “A survey on human activity recognition using wearable sensors,” IEEE Communications Surveys & Tutorials, vol. 15(3), pp. 1192-1209, 2013. [23] M. Vrigkas, C. Nikou, I. A. Kakadiaris, “A Review of Human
Activity Recognition Methods,” In journal Frontiers in Robotics and AI, vol. 2, Article 28, 2015.