Fioranelli, F., Ritchie, M., and Griffiths, H. (2016) Centroid features for
classification of armed/unarmed multiple personnel using multistatic human micro-doppler. IET Radar, Sonar and Navigation, (doi:10.1049/iet-rsn.2015.0493)
This paper is a postprint of a paper submitted to and accepted for publication in IET Radar, Sonar and Navigation and is subject to Institution of Engineering and
Technology Copyright. The copy of record is available at IET Digital Library There may be differences between this version and the published version. You are advised to consult the publisher’s version if you wish to cite from it.
http://eprints.gla.ac.uk/118776/
Deposited on: 26 April 2016
Enlighten – Research publications by members of the University of Glasgow http://eprints.gla.ac.uk
1
C
ENTROID FEATURES FOR CLASSIFICATION OF ARMED/
UNARMED MULTIPLEPERSONNEL USING MULTISTATIC HUMAN MICRO
-D
OPPLERFrancesco Fioranelli, Matthew Ritchie, Hugh Griffiths
Department of Electronic and Electrical Engineering, University College London, London, UK
Abstract
This paper analyses the use of human micro-Doppler signatures collected using a multistatic radar system to identify and classify unarmed and potentially armed personnel walking within a surveillance area. The signatures were recorded in a series of experimental tests and analysed through Short Time Fourier Transform followed by feature extraction and classification. Features based on Singular Value Decomposition and on the centroid of the micro-Doppler signature are proposed and their suitability for armed vs unarmed classification purposes discussed. It is shown that classification accuracy above 95% can be achieved using a single feature. Features based on the centroid of the signatures are shown to be also effective in cases where there are two people walking together in the same direction and at similar speed, and one of them may be armed or not, i.e. for targets not easily separable in range or in Doppler.
1. Introduction
Additional frequency modulations added to the main Doppler component of moving targets are known as micro-Doppler, and are related to rotating and vibrating parts of vehicles and aircraft, or to the swinging motion of limbs and body in case of human micro-Doppler [1, 2]. Target identification and classification based on micro-Doppler signatures have been investigated over a number of years for a variety of applications in security, warfare, search and rescue context [3, 4]. It has been shown how human micro-Doppler signatures collected using a monostatic radar system and analysed through Short Time Fourier Transform (STFT) can be used to discriminate between animals and humans [5, 6] , to distinguish between different activities performed by different people such as running, walking, crawling [7, 8] or to identify different people performing the same activity on the basis of different micro-motion patterns [9] , and even to potentially distinguish between men and women [10] .
As the micro-Doppler signature depends on the cosine of the aspect angle, i.e. the angle between the radar line of sight and the trajectory of the target, the classification performance may be degraded when this angle approaches 90° as the micro-Doppler signature will be strongly attenuated. In [11] it is for instance reported that the classification performance drops below 40% for aspect angles close to 90°, whereas in [7] it is shown that for smaller aspect angles up to approximately 30° the micro-Doppler signatures are only scaled and therefore can be still used to extract features and perform classification.
2 Bistatic and multistatic radar systems have been proposed as a solution to this issue, as multiple radar nodes could be deployed in suitable geometries so that there is always at least one node able to illuminate the target from favourable aspect angles. Rather little research has been presented on human micro-Doppler classification based on experimental data from bistatic/multistatic radar systems, especially for the case of multiple individuals being measured simultaneously. It has been shown how a single spectrogram can be created by fusing partial spectrograms from different nodes of a radar network, and how this final spectrogram can be used to perform feature extraction and classification [12, 13]. However this study used simulated data created through the Boulic kinematic model and not actual experimental data. In [14] a bistatic radar system was used to detect the trajectory of oscillation of mechanical objects, such as a pendulum, and the direction faced by people while performing actions such as picking up objects and swinging arms. In [15] improved classification accuracy is achieved when jointly using data from a monostatic radar and from an acoustic bistatic system compared with using the monostatic system on its own. The work in [16], performed with the same multistatic radar system used in this paper, presented the experimental micro-Doppler signatures of people walking and running in different directions and compared them with simulated results. It was shown that multistatic micro-Doppler contains more information than the monostatic case, hence techniques for automatic target recognition are expected to perform better when multistatic information is available.
Our previous work in [17, 18] focused on the classification of armed vs unarmed personnel walking on the spot, investigating the effect of different aspect angles and of different ways of combining multistatic information on the classification accuracy. Empirical features extracted from the spectrograms, such as bandwidth, period, Doppler offset, and radar cross section (RCS) ratio, were used as input to the classifier and good results were achieved with classification accuracy of approximately 90% or above for the most favourable aspect angles and features. In [19] we expanded the previous work by analysing multistatic data with people walking in a realistic manner, not on the spot, and by comparing the classification accuracy when using conventional empirical features and a new feature based on Singular Value Decomposition (SVD).
The analysis presented in this paper aims at expanding the previous work with significant elements of novelty. The classification performance of the SVD based feature is investigated as a function of the different variables involved in the classification process, such as the duration of the data used for feature estimation, the size of the training data set for the classifier, the duration of the window and the overlap used to calculate the spectrograms. This analysis aims at establishing to what extent it is possible to have a faster and less computationally intensive classification procedure, with shorter duration of the data required for feature estimation and reduced spectrogram overlap, and still achieve good classification performance with accuracy above 90-95%. Another important element of novelty is the analysis of data where two people are simultaneously and closely walking in the same direction and at similar speed. To the best of our
3 knowledge no report of data of this kind is available in the literature. The focus of the study is on the ability of discriminating between the case where both people are unarmed and the case where only one of them is armed, which is particularly challenging as the two people are not easily distinguishable in range and their micro-Doppler signatures are overlapped. New features based on the Doppler centroid and bandwidth of the micro-Doppler signatures are proposed to identify potentially armed personnel for both data with a single person walking, and data with two people walking. These features appear to be suitable and provide classification accuracy in the range of 75-95%, depending on the aspect angle between the target trajectory and the radar baseline, as well as on the duration of the data used for feature extraction. It should be also noted that both SVD based feature and centroid based feature are applied directly to the spectrogram without any pre-processing step which may be required for the estimation of empirical features to take into account changes in walking speed (acceleration and deceleration) within the same measurement or in repeated measurements of the same activity. Furthermore, the features analysed in this paper appear to provide good classification accuracy (90% and above) when used on their own, whereas several empirical features may need to be combined together to achieve similar performance, requiring more complex classifiers and more computation. For instance in [7] it is shown that at least 4 features are required to get accuracy higher than 90%, and in [8] even ten empirical features are necessary.
The paper is organised as follows. Section 2 presents the experimental setup and the radar system used to collect the data. Section 3 describes the analysis performed on the data, in particular the extraction of the SVD based feature and the tests on its suitability to classify single armed vs unarmed person data, as well as the use of the proposed centroid based features to successfully classify even micro-Doppler signatures with two people. Section 4 concludes the paper and discusses future work.
2. Radar systems and measurement setup
The data presented in this paper were collected using the multistatic radar system NetRAD, which has been developed over the past decade at University College London [20]. NetRAD is a coherent pulsed radar consisting of three separate but identical nodes and operates at 2.4 GHz, S-band. The transmitted power of the radar is approximately +23 dBm, with vertically polarized antennas that have 24 dBi gain and approximately 10°×10° beamwidth. The RF parameters chosen for the experiments described in this paper were linear up-chirp modulation with 45 MHz bandwidth and 0.6 μs duration, 5 kHz pulse repetition frequency (PRF) which allows the whole human micro-Doppler signature to be included in the unambiguous Doppler region, and 5 s duration of each recording in order to collect multiple repetitions of the average human walking gait, given its period of approximately 0.6 s.
The experiment with single target took place in July 2015 in an open football field at the UCL sports ground to the north of London. Fig. 1a shows the geometry of the experiment with the three NetRAD nodes
4 deployed along a linear baseline with 50 m inter-node separation, and a grid of six zones where the subjects taking part in the experiment were walking from the middle of the zone towards the baseline as indicated by the six arrows. This was done to mimic the surveillance of an area divided into zones of interests by the radar and to evaluate possible fluctuations in the classification performance in different zones. Node 1 was used as monostatic transceiver, with node 2 and node 3 as bistatic receivers. The resulting bistatic angles for each zone and for each pair of transmitter-receiver nodes are shown in Table 1, with values varying between 26.2° and 39.1°. Data with only a single person walking were recorded, with an equal number of repetitions with the person walking with free hands (hereafter referred to as “unarmed” case) and with the person holding a metallic pole representing a rifle (hereafter referred to as “armed” case). The pole was held using both hands in manner similar to that in which a real rifle would be held, and its size was comparable to that of a real rifle, hence this is expected to have a realistic effect on the walking gait of the person and on its micro-Doppler signature as shown in our previous works [17-19]. Two people took part in the experiment, generating a total number of recordings equal to 360, assuming 2 people, 3 nodes, 6 zones, 10 repeated recording per person, half unarmed and half armed. The key body parameters of the two people were 1.87 m, 90 kg, average body type for person A, and 1.78 m, 66 kg, slim body type for person B. The antennas were manually steered to point in the middle of the zone while collecting data for each zone.
Additional experiments were performed in February 2016 with the same RF parameters and configuration of the radar nodes, as indicated in Fig. 1b. Data with two people simultaneously walking along at five different aspect angles with respect to the baseline of the radar nodes were collected. The combinations of data included both people walking while carrying metallic poles representing rifles, both people walking free handed, and recordings where only one person was carrying the pole (having a different subject out of the two to carry the pole in different recordings to get more variability on the micro-Doppler signatures). In each of these recordings the individuals were walking towards the networked radar on the baseline, or perpendicular in the case of aspect angles 4 and 5, and no data were recorded for the individuals walking away from the radar. Part of this work focuses on the classification between these two situations, i.e. when two people are walking closely in the same direction and both are unarmed, or one is armed and one is not. This is expected to be challenging, as both targets are in the same range bin (the range resolution of NetRAD with 45 MHz bandwidth is approximately 3.3 m) and their micro-Doppler signature is overlapped (both people walking along the same trajectory with similar speed). The total number of recordings for these challenging double target data is 270, assuming 3 nodes, 3 classes (both people unarmed, both people armed, only one person armed), 5 aspect angles, and 6 repetitions per class.
5 Figure 1 Geometry of the experimental setup for single target and double target experiments
Table 1 List of bistatic angles β per zone for each pair of bistatic transmitter-receiver nodes
N1-N2 β [°] N1-N3 β [°] Zone 1 32.68 26.23 Zone 2 30.47 30.47 Zone 3 26.23 32.68 Zone 4 39.14 29.05 Zone 5 35.54 35.54 Zone 6 29.05 39.14
3. Data Analysis
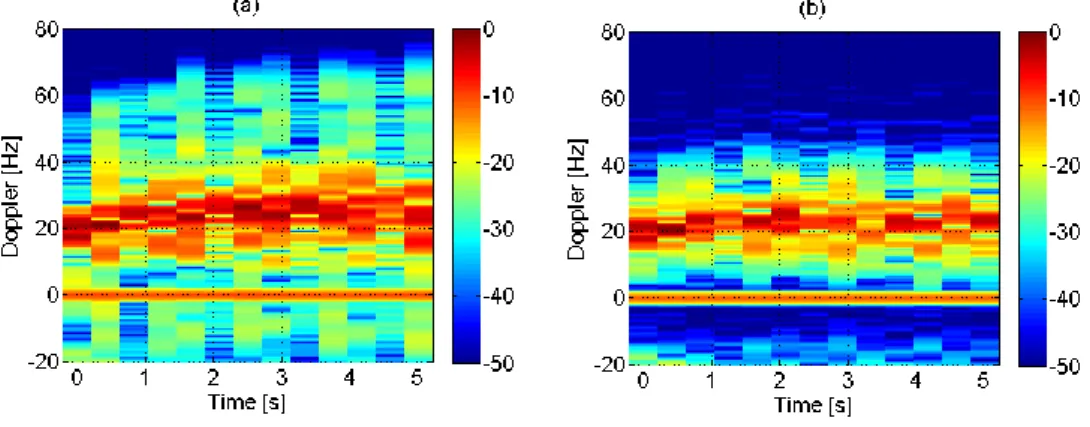
The recorded data were processed through STFT to characterize the micro-Doppler signature in the armed vs unarmed case through features that can be extracted from the spectrograms, as in [6-9]. The STFTs were initially calculated using 0.3 s Hamming windows and 95% overlap. An example of spectrograms for a single person walking unarmed vs armed is shown in Fig. 2, for data recorded at the monostatic node 1 in zone 5, approximately 70 m from the radar node. Differences between the two cases can be empirically seen, with the micro-Doppler signature in the armed case (Fig. 2b) being more concentrated around the main Doppler and presenting less pronounced peaks caused by the swinging motion of the arms. The following analysis presented in this paper aims at quantifying such differences through numerical parameters and using classifiers to discriminate between the armed vs unarmed case. The main Doppler component is at approximately 20 Hz, corresponding to a walking speed of 1.25 m/s, which is reasonable for an adult person walking.
6 Figure 2 Spectrograms for single person walking unarmed (a) and armed (b) calculated using 0.3 s window and 95% overlap
3.1 Single target data
Spectrograms of data related to a single armed vs unarmed person have been classified using SVD based features, expanding our previous work in [19]. Assuming the spectrogram is a given matrix of values M, then its SVD representation is M = USVT, where S is a diagonal matrix with the singular values of M, and
U and V are the matrices containing the left and right singular vectors, respectively. SVD has been used as a technique to extract suitable features for the characterization of small Unmanned Aerial Vehicles (UAVs) and their discrimination from birds [21] , showing that it can reduce the dimensionality of the feature space and that physical characteristics of the target (e.g. velocity and periodicity of the motion) are related to SVD vectors. The SVD based feature identified in our previous work [19] , namely the standard deviation of the first right singular vector, has been used to classify the new set of data presented in this paper and its robustness with respect to the many parameters involved in the analysis has been investigated.
Initially a feature sample has been extracted from 2.5 s of data, hence each 5 s spectrogram produces 2 feature samples. The total number of feature samples for each zone shown in Fig. 1 is therefore 120, considering 20 recording per node (5 armed and 5 unarmed for each of the two people taking part to the experiment), 2 feature samples per node, and 3 nodes. Table 2 shows the classification accuracy results per zone and averaged across all the six zones for different classifiers and different ways of using multistatic data. The classifiers used were the diagonal-linear variant of the discriminant analysis classifier and the Naïve Bayes classifier, which have been described in details in previous work [18, 19, 22].
Both classifiers were trained with 20% of the data and tested on the remaining amount of data. The classification error is calculated as the ratio of total misclassification events (sum of armed events mistaken for unarmed and vice versa) over the total number of samples. This process is repeated 30 times with different and randomly selected training data to remove possible bias in the training data and to obtain the average classification error. The accuracy in percentage is just 100 % minus this error. The use of only monostatic data as from a conventional radar has been compared to two different methods of exploiting information from multistatic radar nodes in terms of classification accuracy. The first method uses all
7 feature samples at a single and centralized classifier which provides the final decision. The second method uses three separate classifiers at each node, and the partial decisions from each of them are used to derive a final decision through a binary voting process, i.e. the final decision is the one taken by at least two out of three classifiers.
Table 2 shows that the classification performance appears to be very good, with average accuracy per zone above 90% for the discriminant analysis classifier and above 95% for the Naïve Bayes. A clear improvement when using the binary voting approach with multistatic data can be seen in comparison with using monostatic data only, or multistatic data at a centralized classifier. Fig. 3 shows through colour maps the classification accuracy per zone when the binary voting approach are used for both classifiers. The classification performance appears to be fairly uniform across the six zones, with a difference of approximately 3% between the highest and lowest results when using the Naïve Bayes, whereas there is slightly more variability per zone using the discriminant analysis classifier, with approximately 9% between lowest and highest values. The classification accuracy tends to be higher for the three zones closer to the radar nodes.
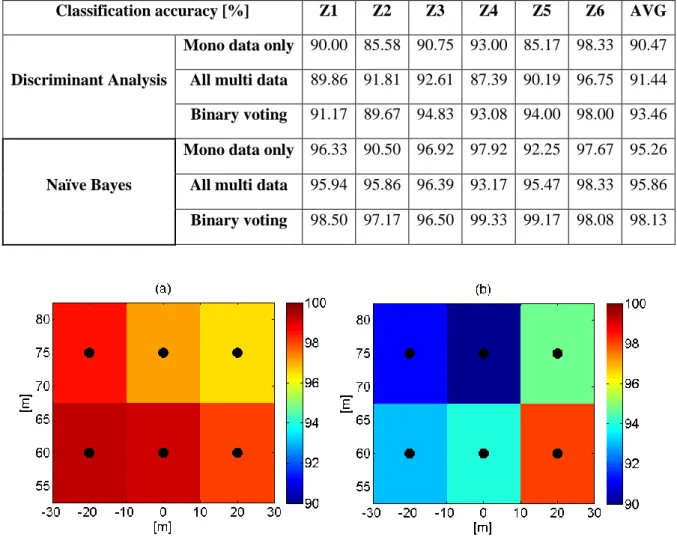
Table 2 Classification accuracy per zone using SVD based feature estimated over 2.5 s of data and 20% training dataset
Classification accuracy [%] Z1 Z2 Z3 Z4 Z5 Z6 AVG
Discriminant Analysis
Mono data only 90.00 85.58 90.75 93.00 85.17 98.33 90.47
All multi data 89.86 91.81 92.61 87.39 90.19 96.75 91.44
Binary voting 91.17 89.67 94.83 93.08 94.00 98.00 93.46
Naïve Bayes
Mono data only 96.33 90.50 96.92 97.92 92.25 97.67 95.26
All multi data 95.94 95.86 96.39 93.17 95.47 98.33 95.86
Binary voting 98.50 97.17 96.50 99.33 99.17 98.08 98.13
Figure 3 Classification accuracy per zone using SVD based feature estimated over 2.5 s of data, using Naïve Bayes classifier and binary voting (a) and discriminant analysis and binary voting (b)
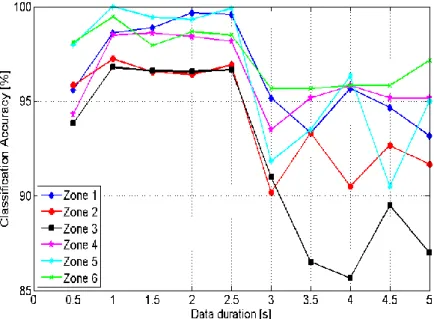
8 The robustness of the proposed SVD based feature for armed vs unarmed classification has then been tested as a function of the duration of the data used for feature extraction. The spectrograms have been divided in blocks from 0.5 s to 5 s (whole recording) and each block has been used to estimate one feature sample. Fig. 4 shows the classification accuracy for each zone as a function of the different data duration for feature extraction. The classifier used in this case was the Naïve Bayes, trained with 20% of the available samples, and the multistatic data were combined with the binary voting approach. The classification accuracy appears to be above 95% in all the zones for data duration between 1 s and 2.5 s, and the classification performance is still good across zones for the shorter duration of 0.5 s. The reduction in classification accuracy for data durations longer than 3 s is expected to be related to the insufficient number of samples to effectively train the classifier, as fewer samples are available from the recorded data (i.e. only one sample for each recording if the feature extraction uses 3 s or longer amount of data) and a very large dataset size would be required to allow for more statistically significant training at all data durations.
Figure 4 Classification accuracy per zone using SVD based feature as a function of data duration for feature extraction
Table 3 shows the classification accuracy averaged over zones for two different sizes of the training dataset, namely 20% and 40%, as a function of the data duration used for feature extraction. The multistatic data were combined with the binary voting approach. When the classifiers are trained with 40 % of the data, the accuracy appears to increase for both types of classifiers with increasing duration of the data used for feature extraction, up to values of approximately 99% for the Naïve Bayes and 95% for the discriminant analysis classifier. When the classifiers are trained with 20% of the data, the classification accuracy decreases for data duration longer than 3 s processed by the Naïve Bayes classifier (from approximately 98% to 93%), whereas this does not appear to happen for the discriminant analysis classifier.
9 Table 3 Classification accuracy averaged over zones using SVD based feature for different data duration for feature estimation and different sizes of training dataset
Classification accuracy [%]
Discriminant Analysis Naïve Bayes
20% train 40% train 20% train 40% train 0.5 s data 90.16 89.91 95.95 96.10 1 s data 91.76 91.99 98.43 98.66 1.5 s data 92.37 92.59 98.36 99.29 2 s data 92.46 92.72 98.18 99.32 2.5 s data 93.39 93.63 98.29 99.46 3 s data 93.64 93.58 92.89 98.67 3.5 s data 94.31 95.33 92.92 98.31 4 s data 93.69 94.36 93.31 98.97 4.5 s data 93.92 95.33 93.06 98.75 5 s data 94.75 95.50 93.19 99.08
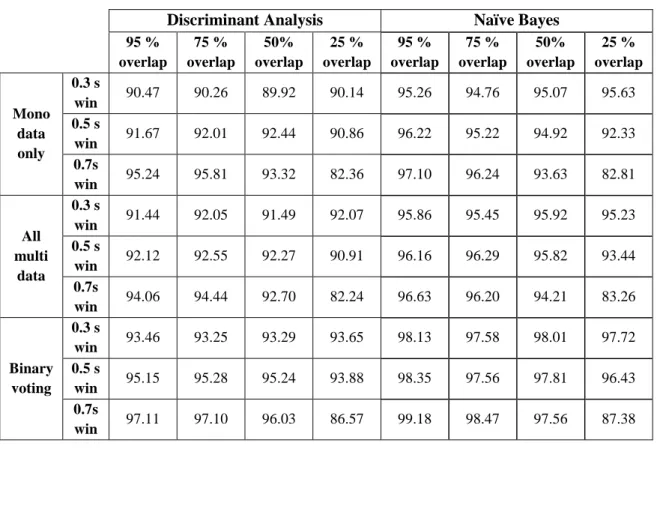
The effect of other two parameters has been tested, namely the duration of the window and the overlap percentage when calculating the spectrograms. The effect of such parameters is generally not extensively investigated in other human micro-Doppler related papers, but it is interesting to evaluate to what extent it is possible to simplify and speed up the calculation of the spectrograms with longer window and reduced overlap, and still be able to perform good classification. The results of this analysis averaged over the six zones are shown in Table 4, with three window lengths considered (0.3 s, 0.5 s, and 0.7 s) and four values of overlap (95%, 75%, 50%, and 25%). Fig. 5 represents the results in Table 4 through colour maps for more easiness of reading. A trend of decreasing accuracy moving from higher (95-75%) to lower (50% and even more 25%) overlap can be seen from the data. Another noticeable trend is the fact that the classification accuracy increases with increasing spectrogram window when the overlap is high (95% to 50% for the discriminant analysis classifier and 95% to 75% for Naïve Bayes classifier), but the accuracy decreases with increasing spectrogram length when low overlap is used. These results appear to be in line with those in [9], where the authors report that they required overlap of at least over 40% to achieve good classification performance with their 10 GHz continuous wave radar, as well as spectrogram window between approximately 0.08 s and 0.185 s (which are comparable with the 0.3-0.7 s range of this work at 2.4 GHz).
The best result overall appears to be the use of 0.7 s window with 95% overlap and binary voting approach, but only a slight reduction of performance of less than 2% is reported when using lower overlap at around 75% and 50%. An example of unarmed vs armed spectrograms calculated with 0.7 s window and 50% overlap is shown in Fig. 6. The data are the same used to generate Fig. 2. A clear difference between the two cases armed vs unarmed can still be seen empirically, in particular the different range of frequencies
10 occupied by the micro-Doppler signature, hence the proposed SVD based classification approach is expected to work well as the results in Table 4 show.
Table 4 Classification accuracy averaged over zones using SVD based feature for different window lengths and overlap when calculating the spectrograms – Feature samples estimated from 2.5 s of data
Discriminant Analysis Naïve Bayes
95 % overlap 75 % overlap 50% overlap 25 % overlap 95 % overlap 75 % overlap 50% overlap 25 % overlap Mono data only 0.3 s win 90.47 90.26 89.92 90.14 95.26 94.76 95.07 95.63 0.5 s win 91.67 92.01 92.44 90.86 96.22 95.22 94.92 92.33 0.7s win 95.24 95.81 93.32 82.36 97.10 96.24 93.63 82.81 All multi data 0.3 s win 91.44 92.05 91.49 92.07 95.86 95.45 95.92 95.23 0.5 s win 92.12 92.55 92.27 90.91 96.16 96.29 95.82 93.44 0.7s win 94.06 94.44 92.70 82.24 96.63 96.20 94.21 83.26 Binary voting 0.3 s win 93.46 93.25 93.29 93.65 98.13 97.58 98.01 97.72 0.5 s win 95.15 95.28 95.24 93.88 98.35 97.56 97.81 96.43 0.7s win 97.11 97.10 96.03 86.57 99.18 98.47 97.56 87.38
Figure 5 Classification accuracy averaged over zones using SVD based feature estimated over 2.5 s of data as a function of spectrogram window length and overlap for Naïve Bayes classifier (a) and discriminant analysis (b)
11 Figure 6 Spectrograms for person walking unarmed (a) and armed (b) calculated using 0.7 s window and 50% overlap
3.2 Double target data
In this section data with two people walking in the same direction are analysed, focusing on the classification between the case where both people are unarmed and the case where only one person of the two is armed. In Fig. 7a and 7b the spectrograms of these two situations are shown, and at first sight there are no obvious differences empirically visible, as opposed to previous cases with just a single person. The spectrograms have been calculated with 0.3 s window and 95% overlap. The main Doppler components due to the bulk motion of the body appear to be overlapped, so the micro-Doppler signatures of the two people cannot be separated, and even in the range-time domain the two people appear as a single target as they are separated by a smaller distance than the resolution of the radar. The range bins selected for micro-Doppler processing covered the full distance walked by the two individuals over the 5 s recordings. It is worth noting that the targets are also indistinguishable in the range domain, as they are separated by less than the range resolution of the radar system. For comparison Fig. 7c shows the spectrogram of the case where both people are armed, which appears to be easier to discriminate from the other two cases.
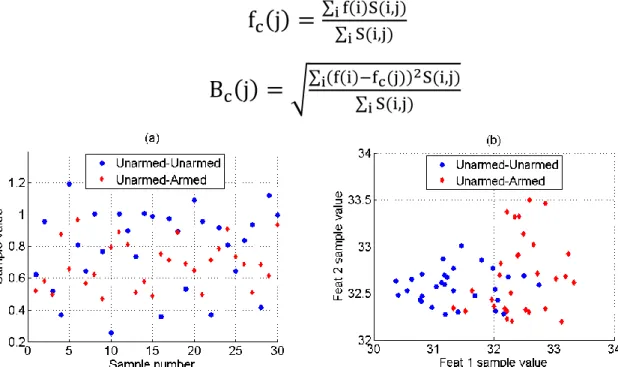
Figure 7 Spectrograms for two people walking when both unarmed (a), one armed one unarmed (b), and both armed (c) Samples of the SVD based feature used to analyse the single target data have been also extracted from the double target data to check the expected classification performance. An example of these samples extracted from the monostatic node data for both people walking along aspect angle 1 are shown in Fig. 8a. The samples related to the two situations where both people are unarmed and where only one person is armed
12 appear to be mixed, without a clear separation between the two classes, hence it is expected that a classifier will perform poorly on these samples.
New features based on the Doppler centroid and bandwidth of the spectrogram have been tested in order to provide better separation between the two double target data classes of interest. Doppler centroid and bandwidth are defined respectively in equation (1) and (2) where S(i,j) represents the value of spectrogram for the ith Doppler bin and for the jth time bin. The Doppler centroid is an indication of the centre of gravity of the micro-Doppler signature and the bandwidth centroid provides an estimate of the signature bandwidth around the centroid [23]. The assumption is that when there is one armed person the resulting micro-Doppler signature will be more concentrated around the main micro-Doppler component because of a more confined motion of the limbs, whereas when both people are unarmed the micro-Doppler signature will be more regularly spread away from the main Doppler component. The mean of the Doppler centroid and of the bandwidth are found to be good features to separate the aforementioned two classes.
Fig. 8b shows an example of centroid features samples for the double target data, and in this case a good separation between the two classes of interest can be clearly seen, as opposed to the use of the SVD based feature. In this case the data were collected at aspect angle 1, as shown in Fig. 1. It is believed that the SVD based feature is simply related to the overall range of Doppler frequencies covered by the micro-Doppler signature, whereas the centroid based features can take into account how the signature energy is spread within that range of frequencies, whether this is more or less spread from the main Doppler component. The centroid features can therefore help discriminate between two micro-Doppler signatures with similar overall bandwidth as those in Fig. 7a and 7b, whereas the SVD feature cannot.
f
c(j) =
∑ f(i)S(i,j)i∑ S(i,j)i
(1)
B
c(j) = √
∑ (f(i)−fi c(j))2S(i,j)∑ S(i,j)i
(2)
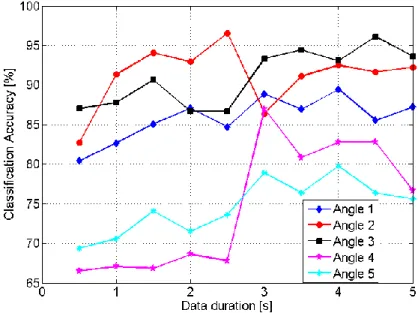
13 Classification of the double target data aiming at distinguishing the cases when both people are unarmed and only one person is armed has been performed using the two aforementioned centroid based features. Results using the Naïve Bayes classifier trained with 40% of the available data are shown in Fig. 9 as a function of the different data duration used to extract features and for each considered aspect angle, assuming to combine multistatic data with the binary voting approach. The classification accuracy is higher, consistently above 80, for aspect angles 1 to 3, where the subjects were walking towards one of the nodes in the baseline, whereas it decreases for aspect angle 4 and 5, where the subjects were walking parallel to the baseline, hence their Doppler signatures were much attenuated, as seen previously in [18]. At a given aspect angle, the data duration used for feature extraction has an impact on the accuracy with differences up to 10%. It is also interesting to observe that the optimal duration (i.e. that providing the best classification accuracy) changes with different aspect angles, suggesting that for an actual system operating in real time in the field the optimal feature extraction approach will depend on the target trajectory.
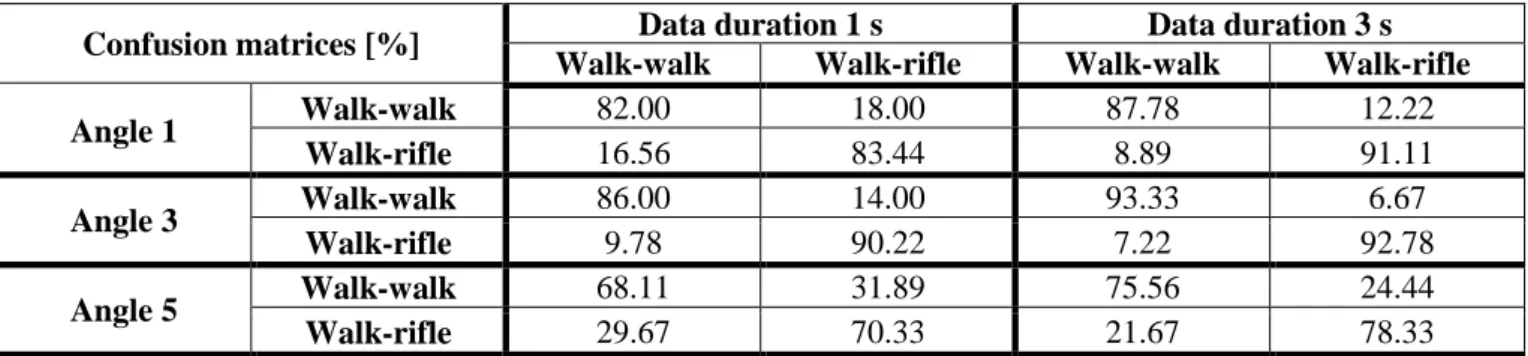
Examples of confusion matrices are shown in Table 5 for three different aspect angles and for two data durations used for feature extraction, namely 1s and 3s. The case with both people unarmed has been labelled as ‘walk-walk’, whereas the case when only one of the two people is armed has been labelled as ‘walk-rifle’. The overall classification accuracy improves with longer data duration for feature extraction from1 s to 3 s, as shown in Fig. 9 for these three aspect angles. Looking at the misclassification events, it would appear that it is more likely to have a ‘walk-walk’ event mistaken for a ‘walk-rifle’ event rather than the opposite situation, i.e. it is more likely to have a false alarm when a detection of armed personnel is incorrectly declared.
Figure 9 Classification accuracy per aspect angle using centroid based features as a function of data duration for feature extraction (two-class problem)
14 Table 5 Example of confusion matrices for discrimination between 2 people unarmed and 1 person armed and 1 person unarmed
Confusion matrices [%] Data duration 1 s Data duration 3 s Walk-walk Walk-rifle Walk-walk Walk-rifle
Angle 1 Walk-walk 82.00 18.00 87.78 12.22 Walk-rifle 16.56 83.44 8.89 91.11 Angle 3 Walk-walk 86.00 14.00 93.33 6.67 Walk-rifle 9.78 90.22 7.22 92.78 Angle 5 Walk-walk 68.11 31.89 75.56 24.44 Walk-rifle 29.67 70.33 21.67 78.33
The double target data have also been classified as a three-class problem, aiming at distinguishing between the three cases where both people are armed, both people are unarmed, and only one of the two people is armed. Fig. 10 shows the classification accuracy as a function of aspect angles and data duration for feature extraction, and Table 6 shows a few examples of confusion matrices. In these cases the classifier used was the Naïve Bayes, trained with 40% of the available data, and the binary voting approach was used to combine multistatic data.The reduction in classification accuracy in comparison with the results in Fig. 9 are related to working with three rather than two classes, but some of the trends observed are the same. For instance the classification accuracy is much higher for aspect angles 1 to 3 (target trajectory towards one of the nodes in the baseline) than for angles 4 and 5 (target trajectory parallel to the baseline, hence attenuated micro-Doppler signatures). Also, a trend of increasing accuracy with increasing duration of the data used for feature extraction can be seen, with a particularly significant improvement at aspect angle 4. Looking at Table 6, it can be seen that on average it is most likely to have a misclassification event between a ‘walk-rifle’ event (only one person armed) and a ‘rifle-‘walk-rifle’ event (both people armed), whereas the ‘walk-walk’ event (both people unarmed) shows the highest rate of successful classification.
Figure 10 Classification accuracy per aspect angle using centroid based features as a function of data duration for feature extraction (three-class problem)
15 Table 6 Example of confusion matrices for discrimination between 2 people unarmed, 1 person armed and 1 person unarmed, and 2 people armed
Confusion matrices [%] Data duration 1 s Data duration 3 s
Walk-walk Walk-rifle Rifle-rifle Walk-walk Walk-rifle Rifle-rifle
Angle 1 Walk-walk 86.67 8.44 4.89 86.67 8.33 5.00 Walk-rifle 16.11 39.11 44.78 6.67 66.67 26.67 Rifle-rifle 1.78 11.78 86.44 2.22 23.33 74.44 Angle 3 Walk-walk 92.78 5.78 1.44 93.33 1.11 5.56 Walk-rifle 11.67 52.78 35.56 7.22 80.00 12.78 Rifle-rifle 2.22 18.11 79.67 8.89 13.33 77.78 Angle 5 Walk-walk 72.22 10.44 17.33 76.11 17.78 6.11 Walk-rifle 25.67 35.67 38.67 15.56 54.44 30.00 Rifle-rifle 9.89 25.67 64.44 26.67 20.00 53.33
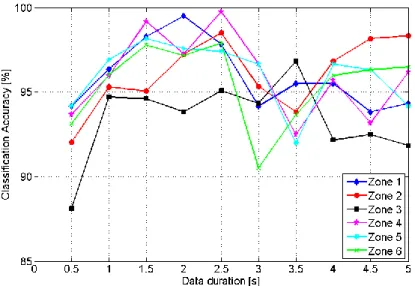
The effectiveness of the proposed centroid based features has been also tested on the single target data analysed earlier in this work, aiming at distinguishing armed vs unarmed personnel (two-class problem). Fig. 11 shows the results in terms of accuracy for the Naïve Bayes classifier trained with 20% of the data and binary voting approach. Accuracy above 90% per zone can be achieved with data duration for feature extraction equal to one second and longer, showing that features based on the centroid of the micro-Doppler signatures are suitable for classifying single target data as well.
Figure 11 Classification accuracy per zone using centroid based features as a function of data duration for feature extraction
4. Conclusions
In this paper we have presented the analysis of human micro-Doppler data collected using the UCL multistatic radar system NetRAD and discussed the classification of unarmed and potentially armed personnel. Two different sets of features have been extracted from the micro-Doppler signatures, a single feature based on the Singular Value Decomposition of the spectrogram and features based on its centroid.
16 Samples of these features have been used as input to classifiers based on discriminant analysis and Naïve Bayes classifier. The samples for both features can be extracted directly from the spectrograms, without preliminary processing steps which may be needed when estimating more empirical features, such as periodicity, bandwidth, and oscillation of the main body, which are more directly related to the kinetics of the movement.
The analysis has investigated the robustness of the SVD based feature as a function of several parameters involved in the classification process, such as the size of the training set used for classifier, the duration of the data used to estimate a feature sample, and the window length and overlap when calculating the spectrogram. It has been shown that good classification performance with accuracy above 95% can be achieved using the Naïve Bayes classifier and the binary voting approach of exploiting multistatic data for a wide combination of values of such parameters. In particular, compared with previous preliminary results [19] , the performance appears to be good even using shorter data for feature extraction (1 second or even 0.5 s for some zones rather than 2.5 s) and less intensive and faster spectrogram calculation with longer window and reduced overlap (0.7 s and 50% rather than 0.3 s and 95%). This may be advantageous for a faster and lighter implementation in the field of the proposed technique.
Data with two people walking in the same directions have also been analysed, presenting the challenging of discriminating between the case where both people are unarmed and the case where only one of them is armed, as the two targets have overlapped micro-Doppler signatures and they are not separable in range being closer than the radar range resolution. The analysis has shown that the SVD based feature is not appropriate to classify this kind of data, but the proposed centroid based features are suitable and can provide good classification performance. Classification accuracy in the range 85-95 % can be achieved at the most favourable aspect angles, i.e. those for which the subjects walked towards one of the radar nodes on the linear baseline, whereas the accuracy decreases down to 75-85% at aspect angles for which the subjects walked parallel to the baseline. The effect of different data duration for feature extraction on the classification performance has been also investigated, showing that the optimal duration for best classification accuracy changes with different aspect angles.
Future work will consist of gathering additional data with single and double target, aiming at having more subjects with different body types and walking along different trajectories in order to validate the proposed centroid based feature with a larger dataset. Another interesting extension of this work will be the analysis of the classification performance in multiple zones, adding more zones to the six considered in this work to obtain an increased variability in bistatic angles and larger surveillance coverage. This will also be combined with different deployment geometries of the radar nodes rather than a simple linear baseline and is expected to be a further step towards a more realistic implementation in the field of the proposed techniques with the aim of surveying an area and different zones of interest.
17
Acknowledgement
The authors would like to thank Jarez Patel and Amin Amiri for his help in the field experiments. This work has been funded by the IET A F Harvey Prize, awarded to Hugh Griffiths (2013).
References
[1] V. C. Chen, "Doppler signatures of radar backscattering from objects with micro-motions," IET
Signal Processing, vol. 2, pp. 291-300, 2008.
[2] R. G. Raj, V. C. Chen, and R. Lipps, "Analysis of radar human gait signatures," IET Signal
Processing, vol. 4, pp. 234-244, 2010.
[3] V. C. Chen, D. Tahmoush, and W. J. Miceli, Radar Micro-Doppler Signatures: Processing and
Applications, Institution of Engineering and Technology, 2014.
[4] D. Tahmoush, 'Review of micro-Doppler signatures', IET Radar, Sonar & Navigation, vol. 9 (9), pp. 1140-1146, December 2015.
[5] D. Tahmoush and J. Silvious, "Remote detection of humans and animals," 2009 IEEE Applied
Imagery Pattern Recognition Workshop (AIPRW), pp. 1-8, 14-16 October, Washington DC, USA.
[6] K. Youngwook, H. Sungjae, and K. Jihoon, "Human detection using Doppler radar based on physical characteristics of targets," IEEE Geoscience and Remote Sensing Letters, vol. 12, pp. 289-293, 2015.
[7] K. Youngwook and L. Hao, "Human activity classification based on micro-Doppler signatures using a Support Vector Machine," IEEE Transactions on Geoscience and Remote Sensing, vol. 47, pp. 1328-1337, 2009.
[8] B. Cagliyan and S. Z. Gurbuz, "Micro-Doppler-based human activity classification using the mote-scale BumbleBee radar," IEEE Geoscience and Remote Sensing Letters, vol. 12, pp. 2135-2139, 2015.
[9] R. Ricci and A. Balleri, “Recognition of humans based on radar micro-Doppler shape spectrum features”, IET Radar, Sonar & Navigation, vol. 9 (9), pp. 1216-1223, December 2015.
[10] D. Tahmoush and J. Silvious, "Radar microDoppler for security applications: Modeling men versus women," IEEE Antennas and Propagation Society International Symposium, APSURSI '09, Charleston, SC, USA, pp. 1-4, 1-5 June 2009.
18 [11] D. Tahmoush and J. Silvious, "Radar micro-doppler for long range front-view gait recognition,"
IEEE 3rd International Conference on Biometrics: Theory, Applications, and Systems BTAS '09, pp. 1-6,
September, Washington DC, USA.
[12] C. Karabacak, S. Z. Gürbüz, M. B. Guldogan, and A. C. Gürbüz, "Multi-aspect angle classification of human radar signatures," Proc. SPIE 8734, Active and Passive Signatures IV, 873408, May 23, 2013.
[13] B. Tekeli, S. Z. Gurbuz, M. Yuksel, A. C. Gurbuz, and M. B. Guldogan, "Classification of human micro-Doppler in a radar network," 2013 IEEE Radar Conference, Ottawa, Canada, pp. 1-6, May 2013.
[14] D. P. Fairchild and R. M. Narayanan, "Determining human target facing orientation using bistatic radar micro-Doppler signals," Proc. SPIE 9082, Active and Passive Signatures V, 908203, June 4, 2014.
[15] M. Perassoli, A. Balleri, and K. Woodbridge, "Measurements and analysis of multistatic and multimodal micro-Doppler signatures for automatic target classification," 2014 IEEE Radar Conference,
pp. 0324-0328, 19-23 May, Cincinnati, OH, USA.
[16] G. E. Smith, K. Woodbridge, C. J. Baker, and H. Griffiths, "Multistatic micro-Doppler radar signatures of personnel targets," IET Signal Processing, vol. 4, pp. 224-233, 2010.
[17] F. Fioranelli, M. Ritchie, and H. Griffiths, "Multistatic human micro-Doppler classification of armed/unarmed personnel," IET Radar, Sonar & Navigation, vol. 9 (7), pp. 857-865, August 2015.
[18] F. Fioranelli, M. Ritchie, and H. Griffiths, “Aspect angle dependence and multistatic data fusion for micro-Doppler classification of armed/unarmed personnel”, IET Radar, Sonar & Navigation, vol. 9 (9), pp. 1231-1239, December 2015.
[19] F. Fioranelli, M. Ritchie, and H. Griffiths, "Classification of unarmed/armed personnel using the NetRAD multistatic radar for micro-Doppler and Singular Value Decomposition features," IEEE
Geoscience and Remote Sensing Letters, vol.12, no.9, pp.1933,1937, Sept. 2015.
[20] T. E. Derham, S. Doughty, K. Woodbridge, and C. J. Baker, "Design and evaluation of a low-cost multistatic netted radar system," IET Radar, Sonar & Navigation, vol. 1, pp. 362-368, 2007.
[21] J. J. M. De Wit, R. Harmanny, and P. Molchanov, "Radar micro-Doppler feature extraction using the Singular Value Decomposition," 2014International Radar Conference, Lille, France, 2014.
[22] T. Hastie, R. Tibshirani, and J. Friedman, The Elements of Statistical Learning: Data Mining,
Inference, and Prediction, Second Edition, Springer, 2009.
[23] A. Balleri, A. Al-Armaghany, H. Griffiths, K. Tong, T. Matsuura, T. Karasudani, et al., "Measurements and analysis of the radar signature of a new wind turbine design at X-band," IET Radar,
![Table 1 List of bistatic angles β per zone for each pair of bistatic transmitter-receiver nodes N1-N2 β [°] N1-N3 β [°] Zone 1 32.68 26.23 Zone 2 30.47 30.47 Zone 3 26.23 32.68 Zone 4 39.14 29.05 Zone 5 35.54 35.54 Zone 6 29.05 39.14 3](https://thumb-us.123doks.com/thumbv2/123dok_us/9001090.2797916/6.892.228.682.70.616/table-list-bistatic-angles-bistatic-transmitter-receiver-nodes.webp)