c
UNDERSTANDING THE IMPORTANCE OF SIDE INFORMATION IN GRAPH MATCHING PROBLEM
BY
KUSHAGRA SINGHAL
THESIS
Submitted in partial fulfillment of the requirements
for the degree of Master of Science in Electrical and Computer Engineering in the Graduate College of the
University of Illinois at Urbana-Champaign, 2016
Urbana, Illinois Adviser:
ABSTRACT
Graph matching algorithms rely on the availability of seed vertex pairs as side information to deanonymize users across networks. Although such al-gorithms work well in practice, there are other types of side information available which are potentially useful to an attacker. In this thesis, we con-sider the problem of matching two correlated graphs when an attacker has access to side information either in the form of community labels or an im-perfect initial matching. First, we propose a naive graph matching algorithm by introducing the community degree vectors which harness the information from community labels in an efficient manner. Next, we analyze the ba-sic percolation algorithm for graphs with community structure. Finally, we propose a novel percolation algorithm with two thresholds which uses an im-perfect matching as input to match correlated graphs. We also analyze these algorithms and provide theoretical guarantees for matching graphs generated using the Stochastic Block Model.
We evaluate the proposed algorithms on synthetic as well as real world datasets using various experiments. The experimental results demonstrate the importance of communities as side information especially when the num-ber of seeds is small and the networks are weakly correlated. These results motivate the study of other types of potential side information available to the attacker. Such studies could assist in devising mechanisms to counter the effects of side information in network deanonymization.
To the Almighty God, and
ACKNOWLEDGMENTS
I take this opportunity to thank God for giving me the power to believe in myself. I would never have been able to do this without the faith I have in You, the Almighty. I express my deepest sense of gratitude to my thesis supervisor, Professor Negar Kiyavash, for providing her constant motivation and valuable guidance. Her keen interest and enthusiastic approach have helped me throughout and beyond this thesis. Regular discussions with her have always resolved bottlenecks and gave this thesis a proper shape. Her expert directions have taught me valuable qualities, which I will treasure throughout my life. It has been a great experience working under her guid-ance. I am grateful to her for giving me an opportunity to come to the University of Illinois and spend time with the best brains of the world. I would like to thank Daniel, who has imparted knowledge to me at many times and helped me solve difficult problems throughout my research. It was great fun to work with my office mates Ali, Sara, Qiaomin, and Weihao, who always encouraged knowledge sharing besides gossip, keeping a lively atmosphere in the lab and providing all the memorable moments. I am very thankful to all my friends, especially Krishnan, Ameya, Daewon and Ashish who made my stay in Urbana-Champaign pleasantly unforgettable. Finally, I express my cordial honor to my caring family for their unconditional sup-port and encouragement and for bringing me to this stage of my life. I am indebted to them for their endless love, inspiration and care.
TABLE OF CONTENTS
LIST OF TABLES . . . vi
LIST OF FIGURES . . . vii
CHAPTER 1 INTRODUCTION . . . 1
1.1 Motivation . . . 1
1.2 Thesis Contributions . . . 2
1.3 Thesis Organization . . . 4
CHAPTER 2 THE GRAPH MATCHING PROBLEM . . . 5
2.1 Preliminaries . . . 5
2.2 Problem Formulation . . . 7
CHAPTER 3 LITERATURE REVIEW . . . 9
3.1 Heuristic Algorithms . . . 9
3.2 Algorithms with Theoretical Guarantees . . . 10
3.3 Other Related Work . . . 10
CHAPTER 4 GRAPH MATCHING ALGORITHMS WITH SIDE INFORMATION . . . 12
4.1 The Naive Algorithm . . . 12
4.2 Percolation Algorithms . . . 17
CHAPTER 5 EXPERIMENTAL EVALUATION . . . 24
5.1 Description of Datasets . . . 25
5.2 Probability of Error . . . 25
5.3 Effect of Number of Communities . . . 27
5.4 Effect of Seeds . . . 28
5.5 Effect of Sampling Parameter . . . 33
CHAPTER 6 CONCLUSION . . . 37
LIST OF TABLES
5.1 Statistics of Astro Physics and Condense Matter Physics
LIST OF FIGURES
2.1 A toy example for generating two correlated graphs. . . 6 5.1 Probability of error versus parameter b for SBM graphs
with s= 0.7. . . 26 5.2 Effect of number of communities on the error rate of the
naive algorithm for SBM graphs with parametersn= 10000,
b= 2. . . 26 5.3 Effect of number of communities on the performance of
the proposed percolation algorithm for SBM graphs with
parameters n= 10000, b= 2, s= 0.5. . . 27 5.4 Box plot comparing distributions of error rate for
algo-rithms A2 and A4 for 100 random seed sets of size 5. X and Y represent algorithms A4 and A2 respectively. Suf-fixes 1,2, and 3 represent datasets, 1: SBM (s = 0.8, K = 20), 2: CondMat (s = 0.7), 3: As-Physics (s = 0.7). Box represents the Inter Quartile Range (IQR), horizontal line in the box denotes the median, +, ◦denote mean and out-liers respectively, horizontal lines above and below the box
denote maximum and minimum respectively. . . 28 5.5 Deanonymization results for SBM dataset with parameters
n= 10000, b= 2, s = 0.8, and K = 20. . . 29 5.6 Deanonymization results for As-Physics dataset with s= 0.9. . 30 5.7 Deanonymization results for CondMat dataset with s= 0.7. . 31 5.8 Percolation threshold for algorithms A2 and A3. . . 34 5.9 F1-score comparison for different levels of correlation for
the synthetic dataset. . . 35 5.10 F1-score comparison for different levels of correlation for
the As-Physics dataset. . . 35 5.11 F1-score comparison for different levels of correlation for
CHAPTER 1
INTRODUCTION
1.1
Motivation
Graph matching algorithms have become a heavily researched topic in the re-cent past [1, 2, 3, 4, 5, 6, 7, 8]. Given two graphs, G1 andG2 with correlated
vertex and edge sets, a graph matching algorithm tries to find a mapping between the vertex sets of G1 and G2. Graph matching algorithms find
relevance in different domains. For example, alignment of protein-protein interaction (PPI) networks is an important step in understanding the biolog-ical processes involved in cell interactions [7]. In this case, vertices of a graph represent proteins and a direct physical interaction between two proteins is represented by an edge.
Another domain, which is the focus of this work, is the study of privacy risks involved in sharing data of social network users [9, 10, 11]. This data helps data mining researchers in understanding network related properties [12, 13, 14, 15, 16] as well as organizations to generate revenues using product advertisements and recommendations [17, 18, 19, 20]. Although of great utility, this data has the potential to leak user privacy [21, 22] and this privacy-utility trade-off has been noted in the literature [23, 24]. Privacy leakage is a very general problem [25, 26, 27, 28, 29], for example, delay-privacy trade-off was studied in [30, 31] for router scheduling policies [32, 33]. Each user in a social network can be represented as a vertex, and an interaction (friendship, message etc.) between two users is indicated by an edge. The two networks, G1 and G2, may represent two different social
networks, for example Facebook and Google+, or may even be the snapshots of the same network at two different times. The target network, G2, often
contains private information about network users, while real identities may be known in the auxiliary network, G1. A correct mapping between the
vertex sets of the two graphs results in associating private information in
G2 to real world individuals, which is a breach of user privacy. Identifying
individuals across two such networks is termed as network deanonymization. Previous studies have focused on availability of some seed vertex pairs to match correlated graphs. For example, Narayan and Shmatikov [6] success-fully matched a fraction of users in two real world networks using a heuristic algorithm. Nilizadeh et al. [5] incorporated the community level information to improve upon this work. Wondracek et al. [34], solving a slightly different problem, utilized the group membership information to identify users in a network. Some studies also approached this problem from a theoretical view-point. For example, Yartseva and Grossglauser [4] proposed and analyzed a graph matching algorithm based on bootstrap percolation. Chiasserini et al. [35] studied the effect of clustering on network deanonymization and showed empirically that clustering can potentially decrease the initial seed set size required to percolate in random geometric graphs.
Almost all of the recent works on network deanonymization have focused only on one type of side information, i.e., seeds. This motivates us to ask the following question: What side information, apart from seeds, could be avail-able to the attacker and how could it be used in network deanonymization?
As more and more user data is being shared today, identifying such side information and understanding the risk it poses to privacy is an important problem. Such an understanding could help us in designing mechanisms to counter the deanonymization attacks on the privacy of users.
1.2
Thesis Contributions
In this thesis, we explore the importance of community labels as side infor-mation for network deanonymization. As a motivating example, consider the work by Fire and Puzis [36]. They analyzed data from several commercial organizations by mining data which their employees have exposed on Face-book, LinkedIn, and other publicly available sources. They found that the communities detected using the friendship links were highly correlated with the position of the employees within the organization. More importantly, the information about the level at which an employee works was available on the public profiles of most employees. Similar information that is publicly
available may include city of residence, college, major, age etc. This kind of information can be used to partition the users into communities which can potentially reduce the candidate set for many users and therefore assist in the deanonymization process.
To analyze the problem theoretically, we consider two correlated graphs,
G1 andG2, generated using the Stochastic Block Model (SBM) [37].
Assum-ing that an attacker has access to community labels in the two graphs, we demonstrate the feasibility of the attacker using this information to assist him in deanonymization. The contribution of this work is twofold. First, we propose and analyze anaive algorithm which usescommunity degree vectors
of the network users to deanonymize them. Assuming that the number of communities grows slowly with network size, we derive conditions on model parameters such that it is possible to match the graphs perfectly using this algorithm. Next, we analyze the simple percolation algorithm [4] for graphs with community structure. We show that the matching threshold r = 2 is sufficient to match almost all users correctly when the number of communi-tiesK =ω(log2n). Second, we propose a two-threshold percolation algorithm which uses an imperfect matching as an input. The imperfect matching is used to identify pairs of users which have high probability of being correct pairs. These special pairs are assigned a lower threshold for the percolation step, while the rest of the pairs are assigned a higher threshold. The use of different thresholds for different kinds of pairs is useful in two ways. When the correct pairs are more probable to get a lower threshold, the number of seeds required to percolate decreases. Also, as the percolation algorithms tend to make more errors in the beginning, mapping the correct pairs early reduces the overall error made by the algorithm. Assuming that the algo-rithm percolates, we derive conditions under which the algoalgo-rithm does not make an error with high probability.
We conduct experiments on synthetic as well as real world networks by varying the number of seeds, levels of correlation, and fraction of community labels known to the attacker. Based on our results, we find that availability of side information in the form of community labels is very useful when (i) the number of seeds is small, and (ii) the correlation between the datasets is weak. We also find that the availability of community labels for a fraction of users is enough for the proposed percolation graph matching algorithm to perform better than other similar algorithms.
In the end, we discuss some implications of our work and experimental results for network privacy. We also discuss possible future directions and questions that need to be answered in order to design better techniques to mitigate the effects of side information in network deanonymization.
1.3
Thesis Organization
The thesis is organized into the following chapters. Chapter 2 discusses the required preliminaries for the thesis and introduces the graph matching prob-lem that the thesis aims to solve. Chapter 3 reviews the previous literature related to the considered problem. We discuss works which use heuristic algorithms followed by works with theoretical guarantees. Chapter 4 is the main contribution of the thesis. We discuss three graph matching algorithms with theoretical guarantees for matching random graphs. Chapter 5 evalu-ates the proposed algorithm using various experiments on synthetic as well as real datasets. Chapter 6 concludes the thesis with some discussion and future directions.
CHAPTER 2
THE GRAPH MATCHING PROBLEM
This chapter introduces the graph matching problem that the thesis aims to solve. First, representation of social networks as graphs is discussed followed by the Stochastic Block Model (SBM). Next, the process of generating cor-related graphs is explained along with the attacker and problem description.
2.1
Preliminaries
2.1.1
Social Networks as Graphs
As noted in previous literature [6, 5, 38, 39, 40], a social network can be easily modeled as a graph (directed or undirected). In this thesis, the vertex set of a graph Gis denoted byV(G), while the edge set is denoted by E(G). The users of a social network are represented as vertices in a graph whereas the existence of an interaction (e.g. friendship link, messages etc.) between two users is denoted by an edge between them. For the purpose of this thesis, social networks are modeled as undirected graphs.
2.1.2
Stochastic Block Model
Communities are an integral part of any social network [41, 42, 43, 12]. Community detection in networks [44, 45, 46, 42] is one of the most widely studied problem in social network analysis. The Stochastic Block Model (SBM) is a random graph model used to generate graphs with community structure [37]. The random graphs are generated as follows. Consider an n
vertex graph, G, with vertex set V(G) and edge set E(G). Also, let there be a community label assignment function C : V(G) → {1,2, . . . , K},[K], where K is the number of communities in G. This function associates a
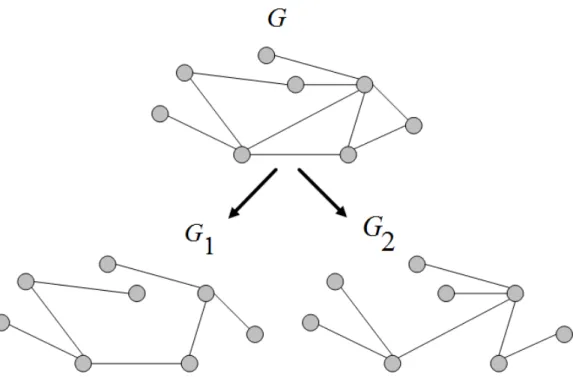
Figure 2.1: A toy example for generating two correlated graphs. community label with every vertex in G and hence partitions V(G) into disjoint sets called communities. Let Ck , {v ∈ V(G) : C(v) = k} denote
the vertex set of thekthcommunity. We assume that communities are equally
sized, i.e.,|Ci|=|Cj|∀i, j ∈[K]. LetP(X) denote the probability of an event
X. The edge set,E(G), is generated as follows. For vertices u, v ∈V(G), let
P(uv ∈ E(G)) = p if C(u) =C(v); otherwise let P(uv ∈ E(G)) = q, where
p, q ∈(0,1) and both can depend on n. Here pand q denote the probability that an edge exists between vertices belonging to the same community and different communities respectively. The existence of an edge is independent of the existence of any other edge. We assume thatp≥qfor the rest of this work as the communities are assortative in real networks. The graph distribution associated with this generative method is denoted bySBM(n, p, q, K). When
p = q or K = 1, this model degenerates to the Erd¨os-R´enyi random graph model [47].
2.2
Problem Formulation
2.2.1
Generating Correlated Graphs
We model the social networks by undirected graphs onnvertices. We use the following model to generate correlated graphs. Consider an underlying graph
G with vertex set V(G) = {1,2, . . . , n} , [n] and G ∼ SBM(n, p, q, K). Generate graphG1withV(G1) = V(G). The edge set,E(G1), is generated as
follows. For every edge e∈E(G), P(e∈E(G1)) = s and P(e∈E(G1)) = 0
if e /∈ E(G). The sampling of every edge is independent of other edges. Generate G2 independently and identically. Figure 2.1 depicts a toy
exam-ple of this generating process. Note that this is the same model as used in many previous studies [48, 2, 3]. We further assume that the vertices of
G2 are anonymized using naive anonymization in which any personal
identi-fiers are replaced by random identiidenti-fiers. Although it is a simple anonymiza-tion technique, naive anonymizaanonymiza-tion is still the most widely used method to anonymize datasets before publishing [6, 11]. Hence, we index the ver-tices of G2 by {10,20, . . . , n0} , [n0]. Without loss of generality, we assume
that i ∈ V(G1) and i0 ∈ V(G2) correspond to the same vertex in G. This
notation proves beneficial for the analysis later. It is useful to note that
G1, G2 ∼SBM(n, ps, qs, K). Let the vertex set of the kth community in G1
and G2 be denoted byCk1 andCk2 respectively. More formally, forz ∈ {1,2},
Cz
k ={v ∈V(Gz) :C(v) =k}. We consider graphs with logarithmic average
degree, i.e., p = alognn and q = blognn, where a, b are constants which are called model parameters. Also, the number of communities K = nα (unless
otherwise stated), α ∈ (0,1], which means that the number of communities grows with number of vertices sublinearly.
2.2.2
Modeling the Attacker
An attacker is any entity that aims to match the vertices of G1 to those
of G2, which in turn breaches the privacy of the users in a social network.
More formally, the goal of an attacker is to construct a bijective mapping
π :V(G1)→V(G2) such that π =π0 where π0(i) =i0 for all i∈V(G1). We
call π0 the ground truth mapping.
holds true is made clear in the particular sections later). First, an attacker is assumed to have access to a set of seed vertices,S0 ={(i, i0) :i∈V(G1), i0 ∈
V(G2)}, |S0| = Φ. This set provides an attacker with Φ vertex pairs which
are already matched in the two graphs. Second, we also assume that the attacker has access to community labels of all vertices in both the graphs. For a vertexi∈V(G1), this information restricts the set of candidate vertices
to CC2(i). As discussed earlier, this information could be available on public profiles in the form of job title, city of residence, college, major, age etc. Third, an attacker has access to an imperfect matching of the graphs. This information can be obtained from various sources, random guessing being one. In this thesis, we analyze the importance of this side information in matching correlated graphs.
Remark 1. We will only consider mappings which preserve the community structure because we assume that an attacker knows the community labels of the users. For the graph G1, let π(E(G1)),{π(u)π(v) :u, v ∈V(G1), uv ∈
E(G1)}. Also, let π−1 :V(G2)→V(G1) denote the inverse of mapping π.
Remark 2. Although the Stochastic Block Model is not completely repre-sentative of the community structure found in real world networks, it is used often in the theoretical analysis for problems involving communities in graphs. The main reasons for this choice are as follows. First, it captures the assorta-tivity property exhibited by the real networks. Second, the theoretical analysis of the problem becomes tractable, and also results in providing an intuitive explanation of the problem for real networks.
CHAPTER 3
LITERATURE REVIEW
The problem of graph deanonymization has become a hot area of research in the past years. The problem has mostly been studied from a practical viewpoint but some theoretical aspects have been studied as well. In this chapter, we discuss some of the important literature associated with the problem.
3.1
Heuristic Algorithms
Narayan and Shmatikov [6] were among the first researchers to study the network deanonymization problem. They proposed a heuristic algorithm to deanonymize users of a network when an adversary has access to a correlated auxiliary network. The algorithm first identifies some seed vertex pairs and then uses this information to propagate and map the remaining users. They were successful in mapping a fraction of the users of Twitter and Flickr net-works with small error rate. Nilizadeh et al. [5] extended this method to incorporate the community structure of the networks. Utilizing the commu-nity structure reduces the size of candidate user pairs and helps in identifying more seed vertices, thereby reducing the error rate. They were able to map correlated large Twitter networks with as few as 16 seeds. They also noted that their method only works if the correlation between the networks is high. Wondracek et al. consider the problem of deanonymizing users when their communities’ memberships are known in a network. They also create com-munity fingerprints of users by stealing their browser history. They showed, by comparing fingerprints and memberships, that some of the users could be identified uniquely while the candidate set is greatly reduced for others. Although these works give insight into the problem of deanonymization, they lack a theoretical framework. In contrast, we seek to understand the
theo-retical aspects of these problems and provide results which emphasize the importance of community structure in network deanonymization.
3.2
Algorithms with Theoretical Guarantees
Some efficient deanonymization algorithms have been proposed recently. Ji et al. [1] analyzed the graph matching problem for the configuration model. They proposed an optimization based deanonymization algorithm to match the two graphs, but did not provide rigorous theoretical guarantees for the algorithm. Yartseva and Grossglauser [4] proposed and analyzed a percola-tion algorithm for matching correlated Erd¨os-R´enyi graphs. The algorithm begins by considering a set of seed pairs which spread their marks to other pairs of vertices. As soon as a particular pair of vertices reaches a fixed threshold, r, it is considered as matched. They established a phase transi-tion in the size of initial seed set for matching the graphs almost completely. There are two main drawbacks of their method. First, the theoretical guar-antee is only proved for r ≥ 4, which makes the algorithm impractical as it requires a huge number of seeds in that case. Second, the threshold r
is same for all vertex pairs. This can be remedied by exploiting the graph structure, which gives useful positive information about some vertex pairs and could be used to assign a lower threshold to such pairs. In [3], Kazemi et al. proposed a variant of percolation algorithm which requires fewer ini-tial seeds but the error increases slightly compared to the former algorithm. They also show that r= 2 is enough to match most of the vertex pairs with
o(n) pairs matched incorrectly. In contrast, our percolation algorithm utilizes the community structure to identify two types of vertex pairs with different thresholds which enables us to use fewer seeds. We also provide guarantees such that it does not match, with high probability, wrong pairs of vertices.
3.3
Other Related Work
Recently, some information theoretic results have been derived for match-ing correlated graphs drawn from random models. Pedarsani and Gross-glauser [38] analyzed the graph matching problem theoretically for Erd¨
os-R´enyi random graphs and derived an achievability result for matching two correlated graphs perfectly. They established that the average degree has to grow slightly faster than the logarithm of the size of the graphs in order to achieve perfect deanonymization. Cullina and Kiyavash [49] improved upon their result for achievability and also derived an almost tight converse for the problem. In [50], Cullina et al. proved similar achievability and converse results for the graphs drawn from the Stochastic Block Model. They also derived conditions on model parameters which enable perfect community re-covery while preventing perfect deanonymization simultaneously. Onaran et al. [51] also derived an achievability result for this problem when the net-work is divided into two possibly unequally sized communities. Ji et al. [48] considered the exact as well as partial deanonymization problem when seed vertex pairs are available to the attacker. They derived achievability bounds for Erd¨os-R´enyi random graphs and extended the results to more general graphs. Although these information theoretic results provide good insights into the problem, they do not provide efficient algorithms to deanonymize networks.
Very recently, Chiasserini et al. [52] proposed a deanonymization algorithm for matching graphs with power law degree distribution. They use degree distribution to divide the user pairs into categories. Based on their degrees, the matching thresholds are assigned to these pairs. The algorithm first uses higher threshold to match moderately higher degree users, then progressively reduces the threshold to match low degree users, and in the end matches users with very high degrees. Although they use different thresholds for different pairs, the minimum threshold used is rmin = 3, and as seen in their
experiments, the algorithm requires many seeds to percolate when the scale-free graphs are moderately correlated. In contrast, our algorithm requires far fewer seeds to percolate even when the correlation between the datasets is weak.
CHAPTER 4
GRAPH MATCHING ALGORITHMS WITH
SIDE INFORMATION
This chapter discusses the main contribution of the thesis. We discuss three graph matching algorithms in this chapter. The first, called naive algorithm, leverages the community label information and does not require seeds to match users across two correlated graphs. This is in contrast to most of the algorithms proposed in the literature, which depend on seeds to match users further. We derive an achievability bound for this algorithm, and thus, identify the parameter space where the algorithm matches the graphs per-fectly with high probability. The second algorithm is an extension of the basic percolation algorithm [4] to graphs with community structure. We show that when the community labels are known, the graph matching al-gorithm becomes much easier and the matching threshold can be as small as r = 2 when the number of communities is K = ω(log2n). The third
al-gorithm assumes that an imperfect matching of the users is given as input and uses this information along with a modified percolation algorithm with two thresholds. We derive conditions under which the imperfect information helps the percolation algorithm to match users in the two graphs without making errors.
4.1
The Naive Algorithm
Consider two graphs, G1 and G2, generated as in Section 2.2.1. For some
k0 ∈[K], consider a vertex i ∈Ck10. For each k ∈[K], let di(k) =|{j ∈C
1
k :
ij ∈E(G1)}|be the size of the neighborhood ofiin community k. Similarly,
for a vertex j0 ∈ C2
k0 define dj0(k). Then the community degree vector of i,
denoted by di, is defined as
Similarly, let dj0 denote the community degree vector of j0. The community
degree vectors represent the pattern in which a user connects to various com-munities in the network. If the number of comcom-munities is big enough, there is a nontrivial amount of information in these vectors which can be utilized to deanonymize the network. In particular, when the graphs are sparse, users are connected to only a few communities, which results in enough informa-tion to deanonymize the users in the network. Intuitively, we expect di to
be closer to di0 than dj0 for j0 6= i0. To make the further analysis tractable,
we define the distance between the pair (i, j0) as
dij0 =
K X k=1,k6=k0
min(1,|di(k)−dj0(k)|) (4.2)
This distance measures the dissimilarity of the community degree vectors of the vertices i and j0. If both i and j0 have the same number of neighbors in a particular community, the contribution of this community to the distance in (4.2) is 0. In all other cases, the contribution is 1.
We now propose a naive algorithm to match the graphs G1 and G2. This
algorithm works as follows. For every vertexi∈V(G1), the algorithm returns
ji0 ∈V(G2) such thatiandji0 have the same community label andj
0
i is closest
to i in terms of the distance defined in (4.2), that is, ji0 = argminj0∈C2 C(i)dij
0.
The pseudo code is described in Algorithm 1. This algorithm is conceptually simple and computationally efficient.
Algorithm 1 Naive Algorithm
Require: G1, G2,C
Compute the community degree vectors, di and dj0, for all vertices i ∈ V(G1) and j0 ∈V(G2)
for all vertex pairs (i, j0)∈V(G1)×V(G2) such that C(i) =C(j0) do
Calculate dij0 using Equation (4.2) end for
for i∈V(G1) do
ji0 = argminj0∈C2 C(i)dij
0
Return (i, ji0) as a matched pair
end for
The rest of this section is aimed at deriving conditions under which the above described algorithm matches the graphsG1 andG2 perfectly with high
are independent because they correspond to edges to different communities. Also, they are identically distributed. We are interested in the conditions on the model parameters such that P(dii0 ≥ dij0) → 0 as n → ∞ for all i and j0. This means that all correct pairs of vertices are closer to each other, in terms of distance in (4.2), compared to incorrect pairs, asymptotically with high probability.
First, we bound the probability that an arbitrary incorrect pair of vertices are closer to each other than the correct pair in terms of distance in (4.2).
Lemma 1. For any k0 ∈[K], i∈Ck10, j
0 ∈C2 k0, j 0 6=i0, and s >0, P{dii0 ≥dij0} ≤n−2bs(1− √ 1−s2)+o(1) →0 as n→ ∞
Proof. We need to analyze P(dii0 −dij0 ≥0).
Letd(k) = min(1,|di(k)−di0(k)|)−min(1,|di(k)−dj0(k)|). We have P(dii0−dij0 ≥0) =P( K X k=1,k6=k0 min(1,|di(k)−di0(k)|) − K X k=1,k6=k0 min(1,|di(k)−dj0(k)|)≥0) =P( K X k=1,k6=k0 d(k)≥0) (4.3)
Note that d(k)0s are independent and identical. Let pi = P(d(k) =i), i ∈
(−1,0,1). We have for any ϕ >0,
P( K X k=1,k6=k0 d(k)≥0) =P(eϕPKk=1,k6=k0d(k) ≥1) ≤E(eϕPKk=1,k6=k0d(k)) = [ E(eϕd(k))]K−1 = (p0+p1eϕ+p−1e−ϕ)K−1 ≤exp((K−1)(p0+p1eϕ+p−1e−ϕ −1)) ≤exp(−(K−1)(√p1− √ p−1)2) (4.4)
neighbors of vertex iin community k in the underlying graphG. Then p1 =P(d(k) = 1) =P(dii0(k) = 1, dij0(k) = 0) = n/K X mi=1 n/K X mj=0 P(Di(k) =mi, Dj(k) = mj)× P(dii0(k) = 1, dij0(k) = 0|Di(k) =mi, Dj(k) =mj) =P(dii0(k) = 1, dij0(k) = 0|Di(k) = 1, Dj(k) = 0)× P(Di(k) = 1, Dj(k) = 0) +o( nq K) =P(Di(k) = 1, Dj(k) = 0) +o( nq K)× P(di(k) = 0, di0(k) = 1, dj0(k) = 0|Di(k) = 1, Dj(k) = 0) =s(1−s)nq K(1−q) 2n K−1+o(nq K) =s(1−s)nq K(1−o( nq K)) +o( nq K) =s(1−s)nq K +o( nq K) (4.5) Similarly, p−1 =P(d(k) = −1) =P(dii0(k) = 0, dij0(k) = 1) =P(dii0(k) = 0, dij0(k) = 1|Di(k) = 0, Dj(k) = 1)× P(Di(k) = 0, Dj(k) = 1) +o( nq K) +P(dii0(k) = 0, dij0(k) = 1|Di(k) = 1, Dj(k) = 0)× P(Di(k) = 1, Dj(k) = 0) +o( nq K) =snq K(1−q) 2n K−1 +s2nq K(1−q) 2n K−1+o(nq K) =s(1 +s)nq K(1−o( nq K)) +o( nq K) =s(1 +s)nq K +o( nq K) (4.6)
So we have P( K−1 X k=1 d(k)≥0)≤exp(−(K−1)(√p1− √ p−1)2) = exp(−(K−1)2snq K (1− p 1−s2±o(1))) = exp(−2nqs(1−p1−s2±o(1))) = exp(−2bs(1−p1−s2±o(1)) logn) ≤n−2bs(1− √ 1−s2)+o(1) (4.7)
Now, applying the union bound, the following theorem provides sufficient conditions to match G1 and G2 perfectly using only the community degree
vectors.
Theorem 1. Ifb > 2−α
2s(1−√1−s2), ands >0, then the naive algorithm matches the graphs G1 and G2 perfectly with high probability.
Proof. LetPedenote the probability that at least one vertex ofG1is matched
incorrectly. Note that, for every vertex i ∈ V(G1), there are exactly n1−α
candidates j0. Using Lemma 1 and union bound over i, j0, we have
Pe ≤ [ i,j0 P(dii0 ≥dij0) ≤n2−α−2bs(1− √ 1−s2)+o(1) →0 ifb > 2−α 2s(1−√1−s2)
This result implies that when the inter-community edge probability is high enough (recall that q=blognn), the community degree vectors contain enough information to de-anonymize all the users in the network.
Note that the right-hand side of the condition in Theorem 1 is a decreasing function of s. When the value of s is large enough, the naive algorithm can deanonymize even very sparse graphs. On the other hand, when s is small (say s <0.75), it requires denser graphs (large value ofb) to deanonymize all the users. Hence, the algorithm may not be very useful in practical scenarios.
Even if it cannot deanonymize all the users, a small fraction of users are still deanonymized correctly by the naive algorithm. In such situations, it can be used as a preprocessing step to other algorithms. In the next chapter, we show how the naive algorithm can be used to modify the constant threshold percolation algorithm to achieve almost perfect deanonymization.
4.2
Percolation Algorithms
Percolation based graph matching algorithms have been recently proposed in literature [4, 3, 53]. Such algorithms are computationally very efficient while providing good deanonymization results. In this section, we describe variants of the basic percolation algorithm [4] for matching correlated graphs. We first review the basic percolation algorithm introduced in [4], followed by the variant with community label information and the description of the proposed algorithm with two thresholds.
4.2.1
Basic Percolation Algorithm
The basic percolation algorithm [4] begins by considering a seed set S0 as
defined in Section 2.2.2. At every time step, a seed pair (u, u0) is selected from this set. For all potential vertex pairs (i, j0)∈V(G1)×V(G2) such that
(i, u) ∈E(G1) and (j0, u0)∈ E(G2), the score of the pair (i, j0), denoted by
Mij0, is increased by one. When the score of a pair reaches a threshold r, it
is added to the seed set and all other pairs involving i and j0 are removed from further considerations. If the size of the initial seed set is large enough, then the algorithm percolates to n−o(n) correct vertex pairs ifr ≥4.
4.2.2
Percolation with Community Label Information
Suppose that an attacker knows the community labels of the users in graphs
G1 and G2. We show that when the number of communities, K, is large
enough, the basic percolation algorithm percolates to Kn −o Kncorrect pairs in each community with high probability. We establish this by using a better union bounding technique than that used in [4].
Assume a variant of the previous algorithm such that instead of picking a seed at every time instant, the algorithm picks one seed from each community. It is shown in [54] that the number of seeds needed to percolate in this case is equivalent to the scenario when we pick seeds individually. The aim here is to show that this algorithm does not make errors with high probability even when r = 2. Hence, we will establish that the community label information helps in relaxing the threshold from r = 4 to r = 2 and thus the algorithm can percolate with small number of seeds.
Theorem 2. Let the percolation threshold be r ≥ 2. When the community labels of the users in G1 and G2 are known, the percolation algorithm does
not make errors with high probability if K = ω(log2n). Furthermore, the critical number of seeds required to percolate to Kn −o Kn vertices in each cluster is upper bounded as Φ≤(1− 1
r)
Kr(r−1)!
n(p+(K−1)q)r
r−11
.
Proof. The proof is provided for r = 2, other values of r can be dealt in a similar manner. Let k ∈ [K]. Consider a vertex pair (i, j0) ∈ C1
k ×Ck2 and
j0 6=i0. LetXij0(t) be the event that the pair (i, j0) is matched at timet. We
want to bound the probability of this event, P(Xij0(t)), conditioned on the
fact that before time t only correct pairs were matched. We have
P(Xij0(t))≤P[Mij0(t) = 2, Mii0(t)≤2, Mjj0(t)≤2] ≤P[Mij0(t) = 2] =P[Bin(t,(ps)2) +Bin((K−1)t,(qs)2) = 2] ≤ (t((ps) 2 + (K−1)(qs)2))2 2
An important observation here is that, before time step t, the algorithm already used t vertex pairs from every community. Hence, to union bound the above probability only Kn −t vertices remain to be considered at time
t. Now, we union bound the above probability as follows:
[ k,t,i,j0 P(Xij0(t))≤K n/K X t=1 n K −t 2(t((ps) 2+ (K−1)(qs)2))2 2 ≤Clog 4n K2
part follows in a straightforward manner from [54].
The above theorem shows that the number of communities needs to scale just faster thanlog2n so that the percolation algorithm does not make errors with r = 2. In this case, the community label information is very helpful in decreasing the number of seeds required to percolate.
4.2.3
Two Threshold Percolation Algorithm
A drawback of the basic percolation algorithm [4] is that with r ≥ 4, the algorithm requires many seeds to percolate. In fact, the number of seeds required to achieve percolation is an increasing function of the threshold value
r. As has been noted in the literature [4, 3], the percolation algorithm makes errors in the initial steps when there are only a few seeds to deanonymize the graphs. Hence, to reduce such errors, we propose a two-threshold percolation algorithm which takes as input an imperfect matching and builds upon this information to percolate further. Assuming that the algorithm percolates, we also prove the derive conditions under which the algorithm does not make errors with high probability.
Consider, as before, two graphs G1 and G2, but we do not assume that
we have access to the community labels of the users. Suppose that there exists an algorithm, A, which gives us the following output. For each vertex
i∈V(G1), letji0 ∈V(G2) be the vertex matched to iusing the algorithm A.
Let us call this set of matched pairs F. Consider two thresholds, rc and rm,
with rc< rm. For the percolation process, starting with a set of seed pairs,
S0, the following strategy is used. Pick a seed pair from the seed set. For
vertex i, the pair (i, ji0) is considered as matched as soon as its score, Mij0i,
reaches rc. For all other potential pairs (i, j0), the matching threshold isrm.
More compactly, the vertex pairs which were matched by algorithm A are given a lower threshold than the other potential pairs. If algorithm A made errors, we expect the percolation algorithm to correct them. Using a lower threshold for the pair (i, ji0) is helpful in reducing errors in the initial stages of the percolation process if ji0 = i0. As the correct pairs are more probable to accumulate marks earlier than incorrect pairs [4], the lower threshold also helps in reducing the required number of seeds. Hence, the more correct pairs algorithm A matches, the fewer seeds required to percolate and the
lower the error in the second step. Algorithm 2 describes the pseudo code of the proposed algorithm.
Algorithm 2 Percolation Algorithm with Two Thresholds
Require: G1, G2,S0,F ,{(i, ji0), i∈[n]}
S =S0,P =∅, M = 0n×n
while S \ P 6=∅ and |S| 6=n do
Pick a seed pair (u, v)∈ S \ P Add (u, v) to P
for all (i, j0) ∈ V(G1)×V(G2) such that ui ∈ E(G1) and vj0 ∈E(G2)
do
Mij0 =Mij0+ 1
if ((ji0 = j0 and Mij0 = rc) k (ji0 6= j0 and Mij0 = rm)) and both i, j0
are unmatchedthen
S =S ∪(i, j0)
Marki and j0 as matched
end if end for end while
Return S as the set of matched vertices
4.2.4
Asymptotic Analysis
The similarity of graph matching algorithms to bootstrap percolation is noted in the literature [4]. The latter, in general, studies the spread of infection among vertices in graphs where the infected vertices contribute to the in-fection of their neighbors [55]. When the number of infected neighbors of a vertex reaches a certain threshold, it gets infected as well. The graph matching algorithm can be thought of along similar lines. Instead of vertices spreading infection, it is the pair of vertices spreading it in the intersection graphG∩ ,G1∩G2 with vertex setV(G1) and edge setE(G1)∩π0−1(E(G2)).
To make the two problems isomorphic, one first needs to establish that the percolation algorithm does not make errors whenever it percolates. Next, we analyze the proposed algorithm and derive conditions under which the algorithm does not make errors with high probability. In particular we aim to characterize the performance of algorithm A required to guarantee that no errors are made while percolating.
vice versa. The following theorem provides the conditions under which the algorithm does not make errors with high probability, assuming that it per-colates.
Theorem 3. Let rm ≥ 4 and rc ≥ 1. Consider any i ∈ V(G1) and
j0 ∈ V(G2). Let pf = P((i, j0) ∈ F). If pf = o(nrc−3(logn)−2rc), then the
percolation algorithm with two thresholds does not match wrong pairs with high probability.
Proof. Consider a vertex pair (i, j0)∈V(G1)×V(G2) andj0 6=i0. LetXij0(t)
be the event that the pair (i, j0) is matched at time t. We want to bound the probability of this event, P(Xij0(t)), conditioned on the fact that before
time t only correct pairs were matched. Define a random variable fij0 as
fij0 = 1 if j0 =ji0 0 if j0 6=ji0
Now, we can bound the above probability as
P(Xij0(t))≤P(fij0 = 1, Mij0(t) =rc, Mii0(t)≤rm, Mjj0(t)≤rm)
+P(fij0 = 0, Mij0(t) =rm, Mii0(t)≤rm, Mjj0(t)≤rm)
=P(E1) +P(E2) (4.8)
where E1 is the event [fij0 = 1, Mij0(t) = rc, Mii0(t) ≤rm, Mjj0(t)≤ rm] and E2 is the event [fij0 = 0, Mij0(t) = rm, Mii0(t) ≤rm, Mjj0(t) ≤rm]. Till time t, let T1, and T2 be the random variables corresponding to the number of
seeds with community labels C(i) and C(j0) respectively. First, consider that C(i)6=C(j0) The other case is easier and can be proved in the same manner.
Then P(E2)≤P[Mij0(t) = rm] = t X t1=0 t X t2=t−t1 P[Mij0(t) = rm|T1 =t1, T2 =t2]P(T1 =t1, T2 =t2) = t X t1=0 t X t2=t−t1 P(Bin(t1+t2, pqs2) +Bin(t−t1−t2,(qs)2) =rm)P(T1 =t1, T2 =t2) (a) ≤ t X t1=0 t X t2=t−t1 P(Bin(t, pqs2) = rm)P(T1 =t1, T2 =t2) ≤(tpqs2)rm (b) ≤ (npqs2)rm = (ab)rms2rmn−rm(log(n))2rm (4.9)
where (a) follows from q < p and because n(qs)2 → 0, and (b) follows from
t ≤n. If rm ≥4, then [ i,j0,t
P(E2)≤(ab)rms2rmn3−rm(log(n))2rm →0 (4.10)
For event E1, we have
P(E1)≤P[fij0 = 1, Mij0(t) =rc]
=P[fij0 = 1]×P(Mij0(t) = rc)
≤pf(tpqs2)rc
Using union bound and the condition in the theorem, we have
[ i,j0,t
P(E1)≤pf(ab)rcs2rcn3−rc(log(n))2rc →0 (4.11)
Consider rc = 3. Then we need pf = o((logn)−6). In this case, even
if algorithm A matches pairs randomly, the percolation algorithm does not make any error. For rc= 2, algorithmA needs to do only a little better than
the random algorithm.
When the community label information is available, the naive algorithm proposed earlier can be used as a preprocessing algorithm before percolation.
In the next chapter we show experimentally that this algorithm, with rc = 1
and rm = 2, performs much better than similar graph matching algorithms.
This in turn shows that the community labels serve as excellent side infor-mation, helping both in reducing the number of seeds needed to percolate and achieving lower error rates.
CHAPTER 5
EXPERIMENTAL EVALUATION
In this chapter, we evaluate the proposed algorithms on synthetic as well as real world datasets. The first goal of the experiments is to show that the proposed algorithm performs well on the real world datasets even though the theoretical guarantees are provided for a particular graph model. Our second goal is to show that information about community labels, if used intelligently, enhances the deanonymization results especially when the cor-relation between the networks is low.
In the experiments below, we compare the following algorithms: • A1: percolation withrc =rm = 1
• A2: percolation with rc = 1, rm = 2 (proposed)
• A3: percolation with rc =rm = 2
• A4: ExpandWhenStuck Algorithm [3]
Algorithms A1 and A3 correspond to percolation graph matching with uniform thresholds [4], but match vertices belonging to the same community only. Algorithm A4 is the ExpandWhenStuck algorithm proposed in [3]. To the best of our knowledge, it achieves the best time-accuracy trade-off for matching large graphs. Algorithm A2 is the proposed algorithm which uses two different thresholds for matching the graphs. We evaluate the algorithm with rc= 1 andrm = 2, which achieves excellent results with minimal seeds.
We compare the performance of the algorithms in terms of percolation strength and error rate with varying numbers of seeds (Φ) and values of sampling parameter (s). For all the experiments, the seeds are chosen uni-formly at random. To measure the percolation strength we compare the fraction, f, of vertices matched by the algorithms, i.e., f = #vertices matchedn . The error rate,e, is measured by the fraction of vertices matched incorrectly,
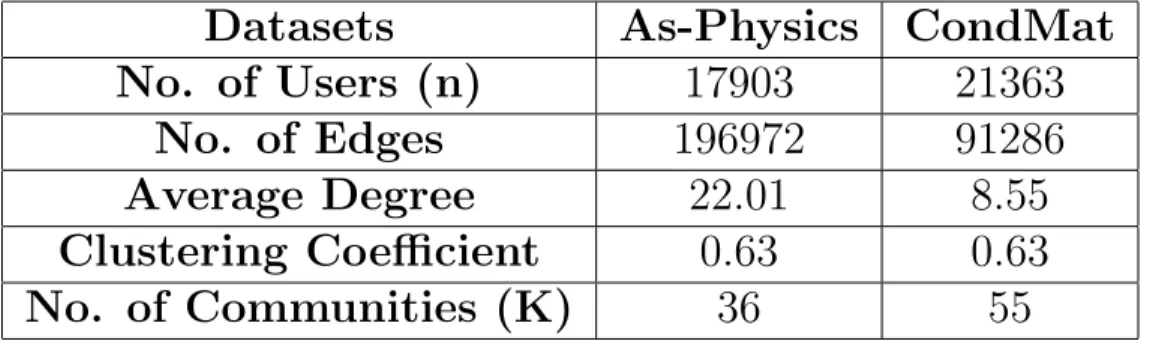
Table 5.1: Statistics of Astro Physics and Condense Matter Physics Datasets
Datasets
As-Physics
CondMat
No. of Users (n)
17903
21363
No. of Edges
196972
91286
Average Degree
22.01
8.55
Clustering Coefficient
0.63
0.63
No. of Communities (K)
36
55
5.1
Description of Datasets
We evaluate the proposed algorithm on synthetic as well as real world datasets. For the synthetic networks, the underlying graph, G, is generated using the Stochastic Block Model with parametersn= 10000, andb= 2 (unless stated otherwise). The real world datasets are the collaboration networks of authors who submitted papers to Astro Physics (As-Physics) and Condensed Matter Physics (CondMat) categories on arXiv [16]. In these networks, two authors are connected if they co-authored a paper. We consider only the largest con-nected component in these graphs. We run Louvain community detection algorithm implemented in Pajek on the underlying graph to detect the com-munity structure [56]. The statistics of these datasets are provided in Table 5.1. To generate correlated networks,G1 and G2, we sample the edges in the
underlying graphs with probabilitys (values ofsare described in subsequent subsections). As we aim to demonstrate the importance of community labels in graph matching, we assume that the attacker knows the community labels of the vertices.
5.2
Probability of Error
Although the results derived in this paper hold asymptotically, it is important to assess their validity on finite graphs. Let perr denote the probability
that the proposed percolation algorithm makes an error. To evaluate this probability, we generate 200 random instances of the problem and match
1 1.1 1.2 1.3 1.4 1.5 1.6 1.7 1.8 1.9 2 2.1 2.2 0 0.1 0.2 0.3 0.4 0.5 0.6 b Probability of Error K=10 (α=0.25) K=20 (α=0.3253)
Figure 5.1: Probability of error versus parameter b for SBM graphs with
s = 0.7.
graphsG1 andG2 using the proposed algorithm. Letnerr denote the number
of instances when the proposed algorithm makes an error. Then, we have
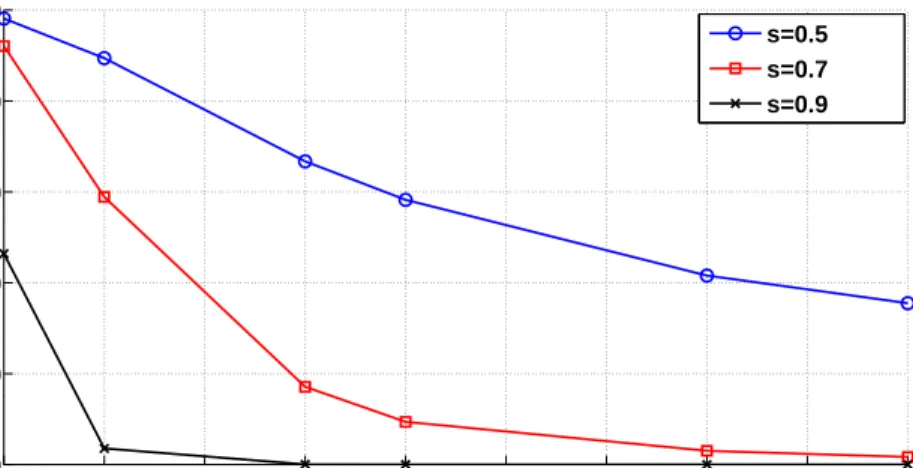
perr = n200err. Figure 5.1 shows the obtained results as a function of parameter
b for two values of K and s = 0.7. For small values of b, perr is high and
it decreases as b increases. For large values of b and K = 10, the algorithm attainsperr of around 0.08 while forK = 20,perr is almost zero. This shows
that more side information in the form of community labels is extremely helpful in matching the graphs.
10 20 30 40 50 60 70 80 90 100 0 20 40 60 80 100 Number of Communities Error Rate (%) s=0.5 s=0.7 s=0.9
Figure 5.2: Effect of number of communities on the error rate of the naive algorithm for SBM graphs with parameters n= 10000, b = 2.
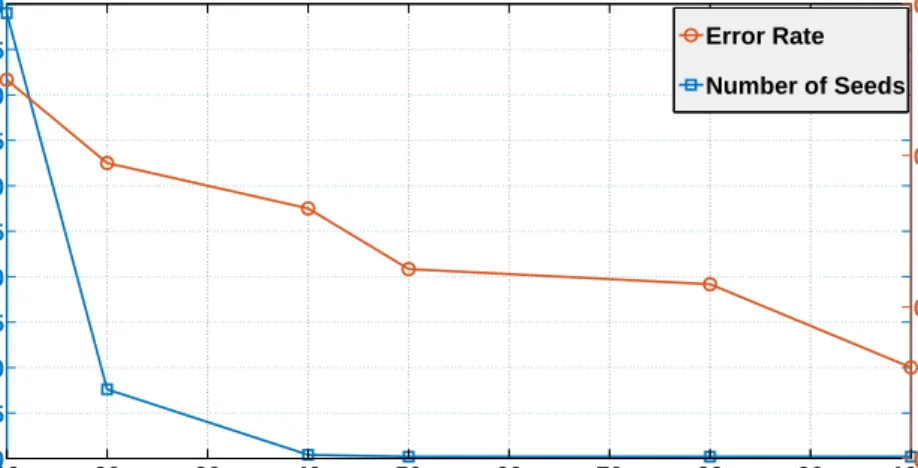
10 20 30 40 50 60 70 80 90 100 0 25 50 75 100 125 150 175 200 225 250 Number of Communities (K) Number of Seeds 10 20 30 40 50 60 70 80 90 1000 0.2 0.4 0.6 Error Rate (%) Error Rate Number of Seeds
Figure 5.3: Effect of number of communities on the performance of the proposed percolation algorithm for SBM graphs with parameters
n = 10000, b= 2, s= 0.5.
5.3
Effect of Number of Communities
We first measure the influence of number of communities on the proposed naive (Algorithm 1) and percolation (A2) algorithms. Figure 5.2 shows the error rate achieved by the naive algorithm for SBM graphs with different values of the sampling parameter. It can be noted that as the number of communities increases, the error rate decreases. For larger values of s, even a very small number of communities is enough to deanonymize a large per-centage of users.
In Figure 5.3, we depict the performance of algorithm A2for s= 0.5. For
K = 10, the algorithm requires around 245 seeds to percolate as virtually all the correct pairs of vertices get a higher threshold using the naive algorithm in the first step (see Figure 5.2). However, for K = 20, the number of seeds required to percolate decreases drastically to 35 even though the fraction of correct pairs assigned a lower threshold is less than 10%. As the number of communities increases further, a greater fraction of correct pairs get lower threshold and hence percolation is immediate for larger values of K. This shows that the performance of our algorithm improves with the number of communities as expected. With only 20 communities, the algorithm achieves less than 0.4% error rate although the correlation between the networks is very weak.
0 20 40 60 80 100 Datasets Error Rate (%) X1 Y1 X2 Y2 X3 Y3 + + + + + +
Figure 5.4: Box plot comparing distributions of error rate for algorithms
A2 and A4 for 100 random seed sets of size 5. X and Y represent
algorithms A4 and A2 respectively. Suffixes 1,2, and 3 represent datasets,
1: SBM (s= 0.8, K = 20), 2: CondMat (s = 0.7), 3: As-Physics (s= 0.7). Box represents the Inter Quartile Range (IQR), horizontal line in the box denotes the median, +, ◦ denote mean and outliers respectively, horizontal lines above and below the box denote maximum and minimum respectively.
5.4
Effect of Seeds
First, we compare the variation in the performance of algorithmsA2andA4
by varying the initial seed set S0. We use 100 random seed sets of size 5 to
obtain the results. Figure 5.4 shows the comparison of error rate distributions for three datasets. It can be seen that our algorithm is insensitive whereas algorithm A4 is highly sensitive to the quality of seeds. We observed during the experiments that the median provides a good estimate of the error rate for algorithm A4. Also, as the median is robust to outliers, we report the median of error rates over 100 random seed sets for algorithm A4 in the experiments.
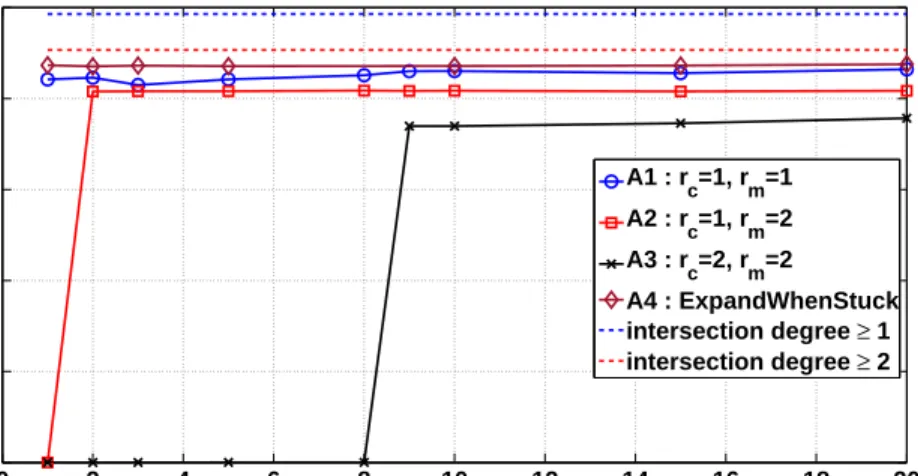
Figure 5.5 shows the deanonymization results for the synthetic networks with s = 0.8 and K = 20 for varying number of seeds. Figure 5.5(a) depicts the percolation behavior of the algorithms. AlgorithmA3is dropped because
1 2 3 4 5 6 7 8 9 10 0 20 40 60 80 100 Number of Seeds Fraction Matched (%) A1: r c=1, rm=1 A2: r c=1, rm=2 A4: ExpandWhenStuck
(a) Fraction of vertices matched vs Number of seeds
1 2 3 4 5 6 7 8 9 10 0 20 40 60 80 100 Number of Seeds Error Rate (%) A1: rc=1, rm=1 A2: r c=1, rm=2 A4: ExpandWhenStuck
(b) Error Rate vs Number of Seeds
Figure 5.5: Deanonymization results for SBM dataset with parameters
0 2 4 6 8 10 12 14 16 18 20 0 20 40 60 80 100 Number of Seeds Fraction Matched (%) A1 : r c=1, rm=1 A2 : r c=1, rm=2 A3 : rc=2, rm=2 A4 : ExpandWhenStuck intersection degree ≥ 1 intersection degree ≥ 2
(a) Fraction of vertices matched vs Number of seeds
0 2 4 6 8 10 12 14 16 18 20 20 30 40 50 60 70 80 Number of Seeds Error Rate (%) A1 : rc=1, rm=1 A2 : r c=1, rm=2 A3 : r c=2, rm=2 A4 : ExpandWhenStuck Naive Algorithm
(b) Error Rate vs Number of Seeds
1 2 3 4 5 6 7 8 9 10 0 20 40 60 80 100 Number of Seeds Fraction Matched (%) A2 : r c=1, rm=2 A4 : ExpandWhenStuck intersection degree ≥ 1 intersection degree ≥ 2
(a) Fraction of vertices matched vs Number of seeds
1 2 3 4 5 6 7 8 9 10 20 30 40 50 60 70 80 90 100 Number of Seeds Error Rate (%) A2 : r c=1, rm=2 A4 : ExpandWhenStuck Naive Algorithm
(b) Error Rate vs Number of Seeds
it required more seeds to percolate than the other three algorithms. It can be seen that all three algorithms percolate instantaneously, but the proposed algorithm A2 maps almost the complete network. Note that algorithm A4
achieves the same number with 10 seeds. The error rate comparison is shown in Figure 5.5(b). The proposed algorithm outperforms both algorithms A1
and A4 and achieves near zero error rate with only 1 seed. It is interesting to note that algorithm A4 is able to perform well with around 5 seeds and is worse than A1 for fewer seeds.
Figure 5.6 shows the deanonymization results for the As-Physics dataset with s = 0.9. The fractions of users in the intersection with degree greater than or equal to 1 and 2 are approximately 98% and 90% respectively. The community detection algorithm partitions the network into 36 disjoint com-munities. It can be noted that using constant threshold rc =rm = 1,
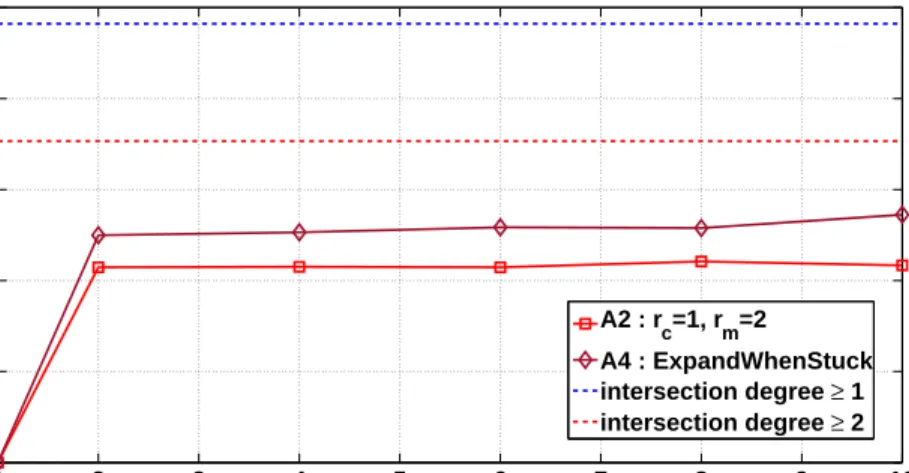
algo-rithm A1 maps around 83% of the users but results in very high error rate. Algorithm A3 needs around 9 seeds to percolate to 72% of the users. The error rate in this case is more than 40%. The proposed algorithm performs much better than the other two. It maps more than 82% users with error rate around 24%. Also note that our algorithm percolates with only 2 seeds. Although algorithmA4 maps more users, our algorithm achieves lower error rate.
Figures 5.7 shows the deanonymization results for the CondMat dataset, which is much sparser than the previous dataset, withs= 0.7. The fractions of users with degrees at least 1 and 2 in the intersection graph are around 96% and 70% respectively. Algorithm A1 resulted in more than 80% error rate and algorithm A3 needed more than 20 seeds to percolate hence the results of these algorithms are not shown. The other two algorithms percolate with only 2 seeds, as can be seen in Figure 5.7(a), with algorithm A4 mapping slightly higher number of users than the proposed algorithm. However, as depicted in Figure 5.7(b), the former algorithm makes more errors than our algorithm. Figure 5.7(b) also shows the IQR for algorithm A4. Note that even the 25thpercentile is well above the error rate achieved by the proposed
5.5
Effect of Sampling Parameter
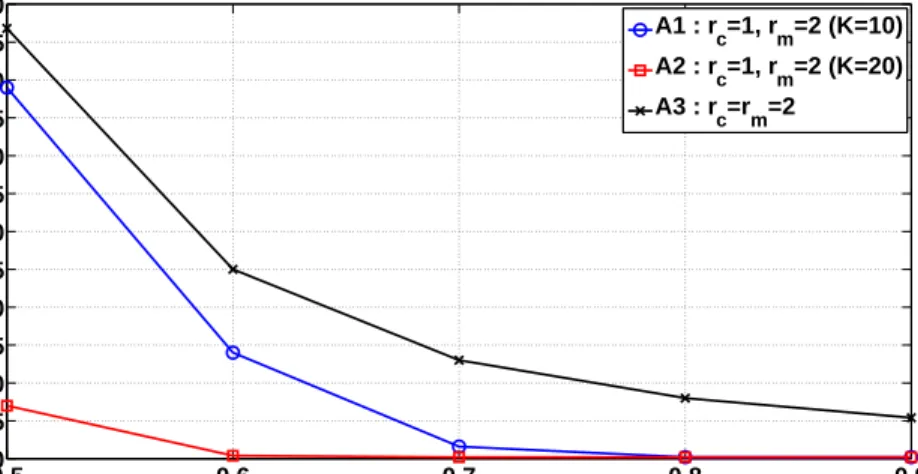
In this subsection, we compare the performance of algorithms by varying the levels of correlation. In the first experiment, we compare the percolation threshold (minimum number of seeds required to percolate) of algorithms
A2 and A3 for the synthetic dataset with K = 10,20. As seen in Figure 5.8, the proposed algorithm requires far fewer seeds to percolate than the percolation algorithm with uniform threshold. In particular, for s = 0.5, assigning a lower threshold to less than 10% correct pairs (see Figure 5.2) changes the percolation threshold from 285 to 35 for K = 20. At higher values of s, algorithm A2 requires only 1 seed to percolate. Also note that for K = 20, the algorithm requires fewer seeds than for K = 10. The reason for this is the fact that when K = 20, more correct pairs get a lower threshold for matching. This highlights the importance of community labels as side information, especially when number of communities is bigger.
In the next set of experiments, we compare the overall performance of the algorithms A1-A4 on synthetic and real datasets. The number of seeds is fixed at 10 for all the experiments. To measure the performance, we use the
F1-score defined as follows:
F1 = 2
P R
P +R (5.1)
whereP = 1−e,R= #correct matchesn
int are the precision and recall respectively.
Herenint is the number of vertices in the giant component of the intersection
graph G∩. The F1 score combines both the percolation strength and error
rates achieved by the algorithms into a single index. An F1 score closer to
1 means better performance of an algorithm in terms of both percolation strength and error rate.
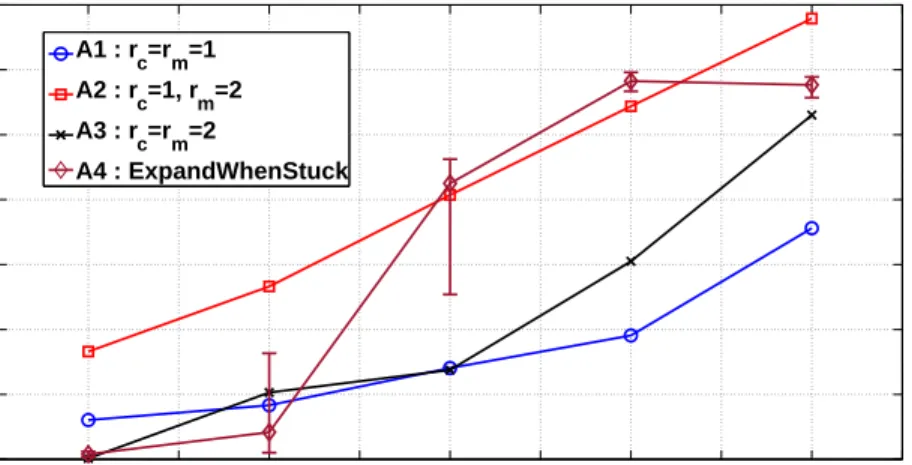
Figure 5.9 shows the F1 scores for the synthetic dataset with K = 20.
Algorithm A3 is not shown as it did not percolate for any value ofs. Note that our algorithm outperforms algorithmA1for most values ofs; ats= 0.5 our algorithm did not percolate. Compared to algorithm A4, our algorithm achieves better scores when the datasets are weakly correlated (s ≤ 0.7). Even when s = 0.8, our algorithm is slightly better than algorithm A4.
Figure 5.10 shows the F1 scores for the As-Physics dataset. As before,
algo-rithms. AlgorithmA1percolates, but makes many errors and hence achieves low scores even at higher values of s. At s = 0.9, the proposed algorithm obtains a score which is better by a value of 0.1 than that of algorithm A4. Note that the IQR at s= 0.7 forA4 is large, which shows the sensitivity of the algorithm to the quality of seeds.
Figure 5.11 shows the F1 scores for the CondMat dataset. At high values
of s, algorithm A4 achieves slightly better scores than the proposed algo-rithm. However, at lower values, the proposed algorithm outperforms other algorithms. It is worth noting that algorithm A4 results in almost 100% error rate for s≤0.6, although it percolates.
0.5 0.6 0.7 0.8 0.9 0 25 50 75 100 125 150 175 200 225 250 275 300 s Number of Seeds A1 : r c=1, rm=2 (K=10) A2 : r c=1, rm=2 (K=20) A3 : rc=rm=2
0.450 0.5 0.55 0.6 0.65 0.7 0.75 0.8 0.85 0.9 0.95 0.2 0.4 0.6 0.8 1 s F 1 −score A1 : r c=rm=1 A2 : r c=1, rm=2 A4 : ExpandWhenStuck
Figure 5.9: F1-score comparison for different levels of correlation for the
synthetic dataset. 0.450 0.5 0.55 0.6 0.65 0.7 0.75 0.8 0.85 0.9 0.95 0.1 0.2 0.3 0.4 0.5 0.6 0.7 s F 1 −score A1 : rc=rm=1 A2 : r c=1, rm=2 A3 : r c=rm=2 A4 : ExpandWhenStuck
Figure 5.10: F1-score comparison for different levels of correlation for the
0.450 0.5 0.55 0.6 0.65 0.7 0.75 0.8 0.85 0.9 0.95 0.1 0.2 0.3 0.4 0.5 0.6 0.7 s F 1 −score A1 : r c=rm=1 A2 : r c=1, rm=2 A3 : rc=rm=2 A4 : ExpandWhenStuck
Figure 5.11: F1-score comparison for different levels of correlation for the
CHAPTER 6
CONCLUSION
In this thesis, we investigate the importance of side information in graph matching problems. We first propose a graph matching algorithm based on the community degree vectors and provide theoretical guarantees for match-ing graphs generated usmatch-ing the SBM perfectly. We analyze the basic perco-lation algorithm for graphs with community structure. Using an imperfect matching as input, we also propose a novel percolation algorithm with two thresholds to match two correlated graphs. We prove the conditions under which the algorithm does not make errors whenever it percolates. We show that our algorithm performs extremely well on the synthetic and real world networks and outperforms other percolation algorithms when the correlation between the networks is low. We also show that our algorithm percolates with only a few seeds, is robust to the quality of seeds and works well even when the community labels are known only for a fraction of users.
There are two main practical implications of our work. First, it shows that side information in the form of community labels has the capability to assist an attacker in network deanonymization, especially in the low correlation regime. Most of the datasets released publicly are only weakly correlated, for example, a person would have very few common friends on Facebook and LinkedIn social networks as these are meant for different purposes. For such datasets, community label information may pose a threat to user pri-vacy. Second, in situations where the correlation is strong, information about community labels helps in reducing the number of seeds needed to percolate and mitigates the effect of seed quality on the deanonymization results.
There are various future directions to explore as a result of our findings. For example, it is pertinent to study other types of side information which could help an attacker to match correlated networks. Such studies could help in designing mechanisms to mitigate the effect of such side information in network deanonymization. Studying similar two-threshold percolation
al-gorithms for other random graph models like preferential attachment [57], and configuration models [58], can provide more insights into the problem of matching real world graphs. A more realistic modification of this problem in-volves considering overlapping communities. We would like to point out that our algorithm can be modified to account for overlapping communities, but a theoretical analysis of this problem would be more challenging. We expect our results to motivate research in these directions in order to understand the graph matching problem more concretely.
REFERENCES
[1] S. Ji, W. Li, M. Srivatsa, and R. Beyah, “Structural data de-anonymization: Quantification, practice, and implications,” in Proceed-ings of the 2014 ACM SIGSAC Conference on Computer and Commu-nications Security. ACM, 2014, pp. 1040–1053.
[2] S. Ji, W. Li, M. Srivatsa, J. S. He, and R. Beyah, “Structure based data de-anonymization of social networks and mobility traces,” in Informa-tion Security. Springer, 2014, pp. 237–254.
[3] E. Kazemi, S. H. Hassani, and M. Grossglauser, “Growing a graph matching from a handful of seeds,” Proceedings of the VLDB Endow-ment, vol. 8, no. 10, pp. 1010–1021, 2015.
[4] L. Yartseva and M. Grossglauser, “On the performance of percolation graph matching,” inProceedings of the first ACM Conference on Online Social Networks. ACM, 2013, pp. 119–130.
[5] S. Nilizadeh, A. Kapadia, and Y.-Y. Ahn, “Community-enhanced de-anonymization of online social networks,” in Proceedings of the 2014 ACM SIGSAC Conference on Computer and Communications Security. ACM, 2014, pp. 537–548.
[6] A. Narayanan and V. Shmatikov, “De-anonymizing social networks,” in
Security and Privacy, 2009 30th IEEE Symposium on. IEEE, 2009, pp. 173–187.
[7] R. Singh, J. Xu, and B. Berger, “Global alignment of multiple protein interaction networks with application to functional orthology detection,”
Proceedings of the National Academy of Sciences, vol. 105, no. 35, pp. 12 763–12 768, 2008.
[8] P. Pedarsani, D. R. Figueiredo, and M. Grossglauser, “A Bayesian method for matching two similar graphs without seeds,” in Communi-cation, Control, and Computing (Allerton), 2013 51st Annual Allerton Conference on. IEEE, 2013, pp. 1598–1607.
[9] C. Dwork, “Differential privacy,” in Encyclopedia of Cryptography and Security. Springer, 2011, pp. 338–340.
[10] L. Backstrom, C. Dwork, and J. Kleinberg, “Wherefore art thou r3579x?: Anonymized social networks, hidden patterns, and structural steganog-raphy,” in Proceedings of the 16th International Conference on World Wide Web. ACM, 2007, pp. 181–190.
[11] M. Srivatsa and M. Hicks, “Deanonymizing mobility traces: Using social network as a side-channel,” inProceedings of the 2012 ACM Conference on Computer and Communications Security. ACM, 2012, pp. 628–637. [12] L. Backstrom, D. Huttenlocher, J. Kleinberg, and X. Lan, “Group for-mation in large social networks: membership, growth, and evolution,” in Proceedings of the 12th ACM SIGKDD International Conference on Knowledge Discovery and Data Mining. ACM, 2006, pp. 44–54. [13] G. Kossinets, J. Kleinberg, and D. Watts, “The structure of information
pathways in a social communication network,” inProceedings of the 14th ACM SIGKDD International Conference on Knowledge discovery and data mining. ACM, 2008, pp. 435–443.
[14] M. Nekovee, Y. Moreno, G. Bianconi, and M. Marsili, “Theory of rumour spreading in complex social networks,”Physica A: Statistical Mechanics and its Applications, vol. 374, no. 1, pp. 457–470, 2007.
[15] L. Weng, F. Menczer, and Y.-Y. Ahn, “Predicting successful memes us-ing network and community structure,”arXiv preprint arXiv:1403.6199, 2014.
[16] J. Leskovec, J. Kleinberg, and C. Faloutsos, “Graph evolution: Den-sification and shrinking diameters,” ACM Transactions on Knowledge Discovery from Data (TKDD), vol. 1, no. 1, p. 2, 2007.
[17] J. Golbeck, “Generating predictive movie recommendations from trust in social networks,” in International Conference on Trust Management. Springer, 2006, pp. 93–104.
[18] J. Tang, X. Hu, and H. Liu, “Social recommendation: a review,” Social Network Analysis and Mining, vol. 3, no. 4, pp. 1113–1133, 2013. [19] Y. Zhang and M. Pennacchiotti, “Predicting purchase behaviors from
social media,” in Proceedings of the 22nd international Conference on World Wide Web. ACM, 2013, pp. 1521–1532.
[20] Y.-M. Li, C.-T. Wu, and C.-Y. Lai, “A social recommender mechanism for e-commerce: Combining similarity, trust, and relationship,”Decision Support Systems, vol. 55, no. 3, pp. 740–752, 2013.