Copyright by Jiajun Chen
The Report Committee for Jiajun Chen
Certifies that this is the approved version of the following report:
Search Engine for Twitter Sentiment Analysis
APPROVED BY
SUPERVISING COMMITTEE:
Lizhen Lin
Timothy Keitt Supervisor:
Search Engine for Twitter Sentiment Analysis
by
Jiajun Chen, B.ECO
.
Report
Presented to the Faculty of the Graduate School of The University of Texas at Austin
in Partial Fulfillment of the Requirements
for the Degree of
Master of Science in Statistics
The University of Texas at Austin
May 2015
Abstract
Search Engine for Twitter Sentiment Analysis
Jiajun Chen, M.S.STAT.
The University of Texas at Austin, 2015 Supervisor: Lizhen Lin
The purpose of sentiment analysis is to determine the attitude of a writer or a speaker with respect to some topic or his feeling in a document. Thanks to the rise of social media, nowadays there are numerous data generated by users. Mining and categorizing these data will not only bring profits for companies, but also benefit the nation. Sentiment analysis not only enables business decision makers to better understand customers’ behaviors, but also allows customers to know how the public feel about a product before purchasing. On the other hand, the aggregation of emotions will effectively measure the public response toward an event or news. For example, the level of distress and sadness will increase significantly after terror attacks or natural disaster.
In our project, we are going to build a search engine that allows users to check the sentiment of his query. Some of previous researches on classifying sentiment of messages on micro-blogging services like Twitter have tried to solve this problem but they have ignored neutral tweets, which will result in problematic results [12]. Our sentiment analysis will also be based on tweets collected from twitter, since twitter can offer sufficient and real-time corpora for analysis. We will preprocess each tweet in the training set and label it as positive, negative or neutral. As we use words in the tweet as the feature for our model, different features will be used. We will show that accuracy achieved by different machine learning algorithms (Naïve Bayes, Maximum Entropy) can be improved with a feature vector obtained by using bigrams [5]. In our practice, we find that Naive Bayes has better performance than Maximum Entropy.
Table of Contents
List of Tables ... vii
List of Figures ... .viii
Introduction ...1
Define the sentiment ...1
Related Work ...3
Methodology ...4
Collect Data for Training ...4
Preprocess ...4
Feature Reduction ...4
Calculate Setiment Score ...5
Store and Index Data in the Database ...5
Sentiment Analysis ...5
Feature Extraction ...6
Machine Learing Algorithms ...6
Naïve Bayes ...6
Maximum Entropy ...7
Vector Space Modeling ...8
Architecture ...9
Relevance Ranking ...10
User Interface Design ...11
Experiment ...13
Results ...14
Classifier Performance ...14
Conclusion ...18 Future Work ...19 References ...20
List of Tables
Table 1: Example Tweets ...1
Table 2: Training data and test data ...13
Table 3: Effects of Feature Selection ...13
List of Figures
Figure 1: Expression for Positive, Neutral and Negative ...1
Figure 2: Procedure of Our Twitter Search Engine ...2
Figure 3: Workflow of Sentiment Analysis ...6
Figure 4: Sample of Inverted Index Construction ...9
Figure 5: The Search Engine Home Page ...15
Figure 6: The sentiment analysis of "glad" with 50% sentiment portion ...15
Figure 7: The sentiment analysis of "sad" with 50% sentiment portion ...16 Figure 8: The sentiment analysis of "black friday" with 70% sentiment portion17
Keyword
Twitter, Sentiment Analysis, Search Engine
INTRODUCTION
Twitter is a popular micro-blogging service where people can post status messages (tweets). Such tweets may show users’ opinion or sentiment toward a certain topic. A large amount of researches have been made in the area of sentiment classification, and most of them focus on large pieces of text, for example, reviews [5]. However, Tweets are different from reviews in several aspects: (1) The length of tweets is limited to 140 characters, and there are usually more words in a review; (2) Tweets contain a variety of topics while reviews are always tailored to a specific topic; (3) The words in tweets are more informal. Misspellings and slang are more likely to appear in tweets; (4) Reviews usually represent summarized thoughts of people, but tweets are more casual in contents. In general, tweets are not as thoughtfully composed as reviews. Nevertheless tweets could be a great source for analyzing sentiment. Twitter users are from different
background, which enable us to collect a large amount of users from various social and interest group. Besides, tweets with different topics are generated every day and the tweets posted can grow dramatically, which makes it possible to collect sufficient training data for our model.
Define the Sentiment
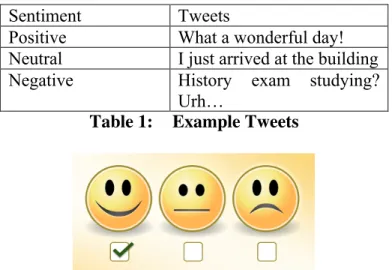
In our assumption, we define sentiment to be a personal feeling which is defined to be positive or negative. However, when a tweet shows no subjective emotion, it should be considered as neutral. Table 1 shows some examples of the definition of sentiment and Figure 1 shows the expression of these three types of sentiment.
Sentiment Tweets
Positive What a wonderful day!
Neutral I just arrived at the building
Negative History exam studying?
Urh…
Table 1: Example Tweets
Picture source: http://blog.qburst.com/2012/08/sentiment-analysis-using-natural-language-processing/
Structure of Twitter Search Engine
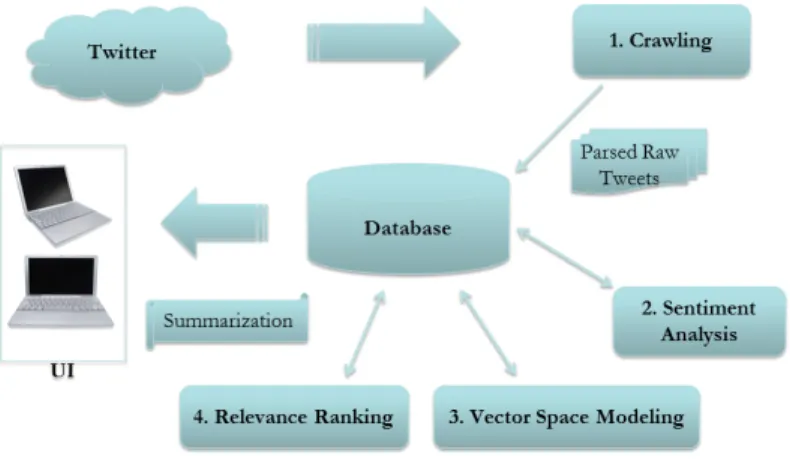
Figure 2. Procedure of Our Twitter Search Engine
The procedure of building the Twitter Sentiment Search Engine involves several steps, and they can be listed as follows:
1. Collect Data For Training 2. Preprocess Data
3. Store and Index Data in the Database 4. Sentiment Analysis
5. Vector Space Modeling 6. Relevance Ranking 7. User Interface Design
Figure 2 shows the structure of the procedure for making our Twitter Search Engine. Each step mentioned above will be discussed in detail in the following sections.
RELATED WORK
A large amount of research has been made in sentiment analysis. Pang et al [5] have analyzed the performance of different classifiers on movie reviews. The work of them has served as a baseline model, and many researchers have used the techniques mentioned in their paper across different domains. Yang et al [4] use web-blogs to construct corpora for sentiment analysis and use emotion icons assigned to blog posts as indicators of users’ mood [6]. Researchers also analyzed the brand impact of micro-blogging [4]. However, their sentiment analysis is based on polarity analysis and neutral class is not considered. In twitter sentiment analysis, we often label a tweet as either positive or negative. Some researchers consider that the objective sentences of the text are less informative so they ignore those sentences and focus on subjective statement in order to improve the binary classification [10]. However, some suggest that three categories (positive, negative, neutral) should be identified, and the introduction of neutral category can improve the overall performance [12]. Go et al [1] has tried different machine learning algorithms to train classifiers for sentiment analysis. Their training data are based on tweets. The methods they use are quite similar to the techniques used by Pang and Lee et al[5 on movie review. Unlike previous researchers, they take neutral class into account. It turns out that the best result is obtained by Naïve Bayes and they can get up to 81% accuracy on their test data.
METHODOLOGY
Collect Data For Training
As mentioned above, our sentiment analysis will be based on tweets downloaded from twitter. Using tweets has two advantages. First, tweets can be easily obtained using twitter stream API, and they usually are in JSON format, which will be convenient for us to extract the data we need. Besides, tweets obtained from the twitter API are up-to-date. This enables us to find out some interesting results like how people feel about the recent events.
To extract a large number of tweets, the Twitter API is very helpful [1], especially the Twitter Streaming APIs, which give us low latency access to Twitter’s global stream of tweet data. Twitter has three streaming options available. They are public stream, user stream, and site stream. However, the user stream and the site stream are really limited to some particular purposes because the user stream only contains the data corresponding with a single user’s view of Twitter, and the site stream is just a multi-user version of the user stream. Therefore, the public stream that contains public data flowing through Twitter is more suitable for our project. In the public streams, Twitter provides two kinds of endpoints. One is a filter that returns public statuses by matching one or more filter predicates. The other is a sample that returns a small random sample of all public
statuses. Generally, the sample endpoint gives us an overall picture, but it only has 1% of the tweets, so if there are 3000 relevant tweets, we only get 30 of them using the sample endpoint. With the filter endpoint, we can feed in a set of keywords and then get more relevant data.
It is worth mentioning that, to extract and analyze large amounts of tweets using the Streaming API, not only an authentication for extracting tweets is required by Twitter, but also we need to fully build a database (such as SQL) server to store all those tweets. In our project, 100,000 tweets are collected and stored in the database.
Preprocess Data
Before training our data for sentiment analysis, we need to clean them. Tweets contain lots of informal words. For instance, “They are reeeeeeeeeeeeeally awesome!!!”. In this sentence, there are repeated character ‘e’ in the word ‘really’, people will show their excitement by saying so. However such casual language will be difficult to analyze. To clean data, we will typically deal with stop words, emoticon, repeated characters and URL links in tweets. This step is also called feature reduction [2].
3.2.1 Feature Reduction
As we will use words in the tweet as features, we need to reduce features by excluding stop words and emoticon, substituting URL link, Username and repeated character. In general, feature reduction can be divided into two steps: exclusion and substitution.
Exclusion Stop words are words filtered out before or after processing of natural language data [13]. Words like ‘is’, ‘and’, ‘a’ belong to stop words. In our stop words list, there are 423 words. Stop words are used frequently but they are not indicative of sentiment. Besides, as we need to calculate the sentiment score of each tweet based on keyword, emoticons like ‘:)’, ‘:(’ will be stripped off also. Go et al also find that emoticons will have a negative impact on the performance of machine learning classifiers [13].
Substitution We also need to substitute some components in tweets to make the calculation of sentiment score faster. In tweets, URL link and @username appear frequently. However, just like stop words they do not provide any valuable information about sentiment. We will substitute url links with URL and @username with USER. Besides, as mentioned above, some informal words contain repeated characters and we should also substitute these words with their proper form. One thing worth mentioning is that the word ‘USER’ and ‘URL’ will be added to our stop words list after the
substitution step is done.
3.2.2 Calculate Sentiment Score
Once tweets are all preprocessed, we can calculate the sentiment score for each tweet. We will label a tweet as sentiment if the sentiment score is greater than 0, and negative if the score is less than 0. We will also include neutral class in our model, so tweet will be labeled as neutral if the sentiment score is 0. Besides, the sentiment score will also be useful for our relevance ranking. The way we calculate the sentiment score is based on AFINN-111 [8]. It is a list of English words rated for valence with an integer ranging from -5 to 5. The words in the AFINN-111 have been manually labeled by Finn in 2009-2011. AFINN-111 is the newest version available and it contains 2477 words and phrases.
To get the sentiment score, we will scan through every processed word in a tweet and sum up the score of those words that are in the AFINN-111.
Store and Index Data in the Database
This part is quite straightforward. We simply store our 100,000 processed tweets in the MySQL database and index them based on their order. For each record, the first column will always be the sentiment score, and the second column is the tweet.
Sentiment Analysis
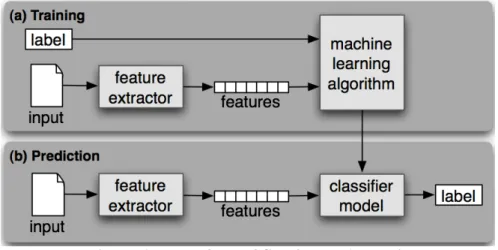
This is the most challenging and important part of our project. Figure 3 below show the workflow chart of sentiment analysis. As shown in the workflow chart, before training our classifier model, we need to extract features of the tweet. We will use unigrams and bigrams as the features of our model and machine learning algorithms like Naïve Bayes and Maximum Entropy will be implemented to train our model.
Figure 3. Workflow of Sentiment Analysis Picture source: http://nltk.googlecode.com/ 3.4.1 Feature Extraction
Unigram Extracting unigrams from a tweet is the easiest way to get a feature. After tweets are processed, we simply parse a tweet into words, and every single word is a unigram.
Bigram We will also use bigrams to parse the tweet. The advantage of bigrams over unigrams is that bigrams are more eligible to handle negated phrases like “not well”, “never like”. If parsing such phrases with unigrams, we can’t accurately get their sentiment. In our experiment, we show that accuracy is significantly improved when bigrams are used.
3.4.2 Machine Learning Algorithms 3.4.2.1 Naive Bayes
The Naïve Bayes Algorithm is used widely for document classification. The method is named so because it is based on Bayes’ theorem, which assumes that each word in the document is statistically independent with the next word [7]. At first glance, such
assumption does not seem to be correct. For instance, “England” is more likely to follow the word “Queen [of]” than other words. Though such assumption is naïve, studying words separately may yield good results [1].
The reason Naïve Bayes works well is that it de-correlates the frequency of a word seen in a document from its statistical importance. To understand this, think of the word “a”. This word is so common that it can be found in many languages. Assuming that you have an English corpora training set, the probability that ‘a’ appears in the data set can be up to 100%. However, we cannot conclude that documents containing ‘a’ are English. By using
may be 50% or less). In this way, common words found everywhere are assigned weaker weight and unique words that appear in the document will be assigned stronger weight. This makes sense because we are not interested in common words such as ‘this’, ‘the’, ‘can’, etc.
The assumption of Naïve Bayes is simple and the algorithm is easy to implement. This is the advantage of using Naïve Bayes to analyze sentiment. The formula of Naïve Bayes in our model can be written as
P(s | T) = P(s) * P(T | s) /P(T)
Where s denotes sentiment, T is for tweets. However, one problem of this formula is that P(T) can be zero if there are no related tweets found given the query. Though such case is rare, but if it happens, we cannot use Naïve Bayes in our model. One way to fix this is Laplace Smoothing, in which we add one to each count [1].
3.4.2.2 Maximum Entropy
Maximum Entropy (MaxEnt) is another useful method for Text Classification and Sentiment Analysis. MaxEnt is based on the maximum principle entropy. The idea behind MaxEnt is that when nothing is known, the probability distribution should be as uniform as possible, that is, have maximal entropy [10]. The purpose of choosing the most ‘uniform’ model is that we want to minimize the risk of prediction. When we want to make prediction, the safest way is to assume the distribution of what we are uncertain is uniform and the prediction should satisfy the given constraint. For instance, when we roll a dice, if we are told that we have 1/3 probability to get the number 4, intuitively, we will guess the probability of the other number is 2/15 respectively. Here, the given constraint is the probability of 4 appears, which is 1/3, and the situation that we are uncertain is the probability of other five number appears, which is (1-1/3)/5 =2/15. Unlike Naïve Bayes, MaxEnt does not make any assumption of the independence of its features. This is particularly meaningful for documentation classification. Therefore, features like bigrams and phrases can be added to MaxEnt without worrying about overlapping features. This is one of advantage of Maximum Entropy against Naïve Bayes.
Where λi is a weight vector, which measures the significance of feature in the classification, x is the tweet in our model and y is the class. The larger the value of weight is, the higher the probability that feature x should be labeled as class y. To build a training model with maximum entropy, I use the python NLTK package, which is developed by Stanford NLP group. Stochastic gradient descent is applied to train the weight.
In theory, Maximum Entropy handles feature overlap better than Naïve Bayes does, so Maximum Entropy is supposed to performs better. However, Naïve Bayes can still perform well on lots of problems [10], which is also consistent with our result. We will discuss it further in our Experiment section.
Vector Space Modeling
The Vector Space model is a simple but effective text retrieval model based on linear algebra [11]. Compared with the Boolean model of information retrieval that only returns the binary relevant documents, the Vector Space model can computer the degrees of similarity between queries and documents, therefore allowing for the terms to be ranked and partially matched. The Vector Space model uses algebraic vectors as identifiers in order to represent user queries and text documents. The vectors are then used to filter, index, and rank for the information retrieval system.
On the other hand, the disadvantages of using the Vector Space model are as follows:
• Search keywords must precisely match document (false positive matching)
• Documents with similar context but different term vocabulary won't be associated
(false negative matching)
• The order in which terms appear in the document is lost in the vector space
To implement the relevancy rankings, we adopted the term frequency-inverse document frequency model (TF-IDF), which is a classic and well-known vector space model proposed by Salton, Wong, and Yang [14]. Generally, documents are represented as
times in the document, the TF-IDF model will reward a high weight to that dimension. On the other hand, if a term is frequent in the collection, the TF-IDF model will offer a low weight to that dimension.
3.5.1 Architecture
Step 1: Construct the term-document incidence matrix
The construction of the term-document incidence matrix lists the documents as the columns and term as the rows of the matrix. The intersection of the row and column will be equal to the value 1 if the term occurs in the document and 0 if the term does not. After the construction of the term-document incidence matrix, each term (row) can be assigned a Boolean value that can be used for the user's search.
Step 2: Construct an inverted index, with frequency information
a) Collect the documents to be indexed
b) Tokenize the text, turning each document into a list of tokens
c) Do linguistic preprocessing, producing a list of normalized tokens, which are the
indexing terms.
d) Index the documents that each term occurs in by creating an inverted index,
consisting of a dictionary and postings
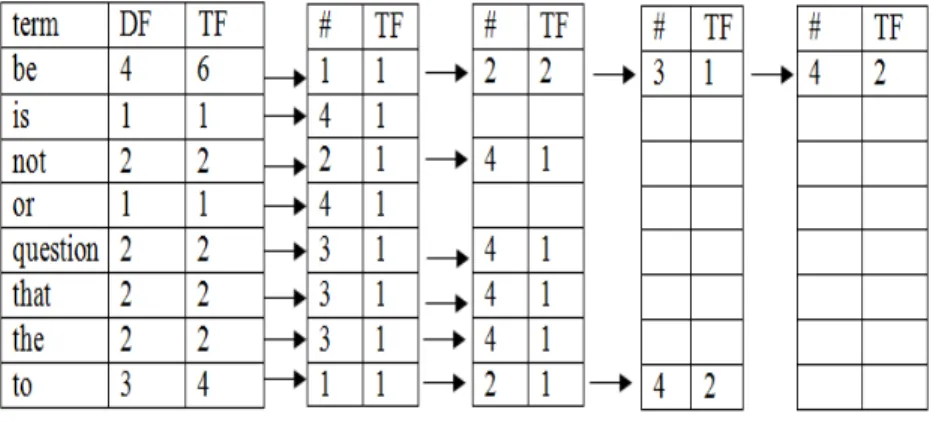
Figure 4 shows a sample of an inverted index construction. Specifically, for example, the term “be” was mentioned 6 times in 4 different documents - Document 1mentioned it once, Document 2 mentioned it twice, Document 3mentioned it once, and Document 4 mentioned it twice.
Figure 4. Sample of Inverted Index Construction
Step 3: Calculate the inverse document frequency (IDF) for each term
The inverse document frequency is
Where N refers to the total number of documents and dft refers to the number of
documents containing term t. The calculation of the IDF allows for the document vectors to be taken column wise. Once the document vectors are defined, we can calculate the cosine similarity for each term in order to filter, index, and rank the terms for an information retrieval system.
Step 4: Calculate the TF-IDF weight
The TF-IDF weight of a term is the product of its TF weight and its IDF weight. wt,d = tft,d * idft
Where tft is the frequency of term t in document d (how many times term t occurs in
document d) and idft is the inverse document frequency of term t defined for the
collection of documents (how many documents have term t).
Step 5: Calculate the cosine similarity score between query and candidate documents
In order to calculate the cosine similarity, the following processes must be completed:
a) Compute the vector magnitude or length for each corresponding document vector
by taking the square root of sum of squared of individual terms in the document vector.
b) Identify candidate documents for incoming query
c) Compute the vector magnitude or length of the query vector
Cosine similarity is calculated by multiplying corresponding terms of documents (dot product) and normalization is done by dividing dot product with product of magnitudes.
Step 6: Sort the candidate documents base on the cosine similarity scores
Relevance Ranking
Generally, the purpose of ranking documents is to return the most important information (e.g., the most relevant document with respect to the query) to the user at the boldest position of the web page. Therefore, back to our Twitter sentiment search engine, ranking each tweet is not only based on the score of the cosine similarity, but also take the
sentiment score into account. To balance and combine the cosine similarity score of a tweet with its sentiment score, we introduce the sentiment proportion to our search engine. Particularly, we calculate the overall ranking score for each tweet using the
OS = p * |SS| + (1 - p) * CSS (0 ≤ p ≤ 1)
Here, OS means the overall ranking score of a tweet; p refers to the sentiment proportion; SS means the tweet’s sentiment score; CSS means the tweet’s cosine similarity score. However, this intuitive but sensible ranking method raises two problems.
Problem 1: How to set the value of the sentiment proportion
It is difficult and unreasonable for us to set a fixed value to the sentiment proportion. To personalize our search engine, we design a drop-down list to let users feel free to select the sentiment proportion value from 0% to 100%. Therefore, for examples, if users are concerned only with the sentiment of the tweets and want to see the strongest sentimental tweet at first, they can select 100% sentiment proportion when searching queries; if users only care about the relevance of the tweets with respect to the query and hope to see the most relevant tweet at first, they can set the sentiment proportion to 0%. In summary, this solution allows users to balance the sentiment scores and the relevance scores of the tweets by themselves for the corresponding results they desire.
Problem 2: The sentiment scores and the cosine similarity scores are in different scales
Actually, because the relevance of a tweet to the query is calculated by the cosine, the cosine similarity score, or called relevance score, is always between 0 and 1. However, the sentiment score is based on the sentiment dictionary - each word has a specific sentiment value in the dictionary from -5 (most negative sentiment) to +5 (most positive sentiment), so if a tweet is able to have infinite words, the sentiment score will be on a scale of -∞ to +∞. Without identical scales, we cannot balance the cosine similarity score with the sentiment score. That is because the sentiment score is so significant that it will dominate the overall ranking score since it can be much larger than the cosine similarity score. To solve this problem, we design a method to normalize the sentiment scores and make them on the scale of -1 to +1. Specifically, after finding all the candidate tweets that include at least one keyword in the query, the search engine will try to obtain the
maximum absolute value of the sentiment score among those candidate tweets. Then divide every candidate tweet’s sentiment score by that maximum absolute value. Therefore, at this point, every sentiment score is on the scale of -1 to +1.
User Interface Design
We use PHP to create the Twitter sentiment search engine. The feature search algorithm takes regular expressions to parse user queries. According to the user input, our search engine constructs a list of relevant tweets. Specifically, users type one or more keywords to query which tweets include at least one of the input keywords. On the other hand, users also need to select a sentiment proportion from the drop-down list when they search a query, so the search engine will show the tweet with highest overall ranking score at the top of the list and the tweet with lowest overall ranking score at the bottom of the list. As mentioned before, the overall ranking score is calculated based on the cosine similarity score of each tweet to the query, the corresponding normalized sentiment score, and the
sentiment proportion that users set. For each tweet in the list, if it expresses a positive sentiment (the sentiment score is greater than zero), this tweet will be displayed in a green frame with a green background; if it expresses a negative sentiment (the sentiment score is lower than zero), this tweet will be displayed in a red frame with a red
background; if it expresses a neutral sentiment (the sentiment score is equal to zero), this tweet will be displayed in a grey frame with a white background. From the data structure perspective, we use arrays to record the query vector and the candidate tweet vectors. The time complexity of constructing a list of ranked tweets is dominated by the computation of the similarity between the query vector and each candidate tweet vector, and hence is equal to: O(Number of candidate tweets * Number of terms per tweet).
According to the user input, our search engine also constructs a sentiment analysis summary for that input. Inspired by Welbourne et al. [15], we count the number of positive sentiment tweets, negative sentiment tweets, and neutral sentiment tweets in the database, and then use Google Line Chart and Google Pie Chart to represent those numbers and their percentages.
EXPERIMENT
We crawl 100,000 tweets using the twitter stream API. The API has a parameter that specifies what kind of language to retrieve the tweets in. In our project, we just focus on tweet in English. We set up our URL parameter in the API as follows:
‘http://stream.twitter.com/1.1/statuses/sample.json?language=en&result_type=recent’. This URL shows that we collect tweets using the twitter stream API 1.1 version, and the raw tweet obtained will be in JSON format. The language parameter is equal to ‘en’ and result_type is recent. That means we will only extract tweets in English that are newly posted.
The detail of our training data and test data is shown in table 2 below. The training dataset consists of 21657 tweets, in which 9812 are labeled as positive and 8628 are negative. The number of neutral tweets is much less than others. 5000 tweets are randomly chosen from our 100,000 tweets that are not used for training classifier.
Dataset Positive Neutral Negative Total Training 9812 3217 8628 21657
Test Randomly Chosen 5000
Table 2. Training Data and Test Data
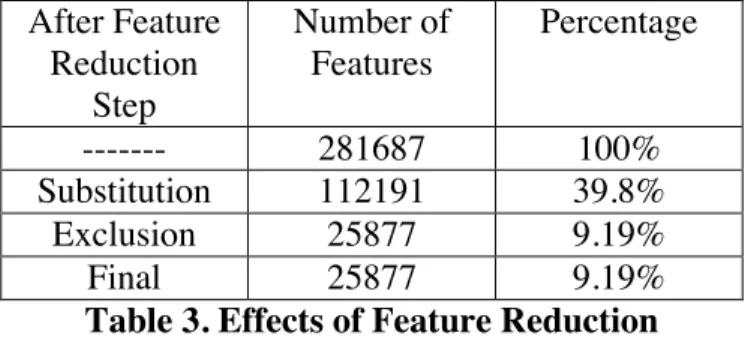
We know that not all words in a tweet offer valuable information for sentiment analysis. Extracting all the features without filtering will make the computation and analysis run quite slowly. To avoid such an issue, we need to make the feature vector sufficiently small. As mentioned previously, feature reduction can take this role. Table 3 below shows the effects of feature reduction in our training dataset. The number of feature turns out to be down to 9.1% of the original number of features. With such a “small number” of features, we can train our classifier efficiently.
After Feature Reduction Step Number of Features Percentage --- 281687 100% Substitution 112191 39.8% Exclusion 25877 9.19% Final 25877 9.19%
RESULTS
5.1 Classifier Performance
After training our classifier with Naïve Bayes and Max Entropy, we compare their accuracy given the 5000 test data. The result of the comparison is shown in table 4. It is not surprising that training classifier with bigrams perform better than that with unigrams. As bigrams use two consecutive words in a tweet as feature, it can deal with double negation and negated phrases. Another interesting of our finding is that Naïve Bayes always performs better than Maximum Entropy in our experiment. Unlike Naïve Bayes, Maximum Entropy makes no assumption about the independence between words, so it should perform better than Naïve Bayes. Our result is consistent with what Nigam et al [10] proposed in 1999. We think two possible reasons may explain this situation. For one thing, inter-correlation among predictor variables is not as strong as we think. Thus the assumption of independence made by Naïve Bayes may have limited impact on the performance. On the other hand, Zhang [9] proposed that Naïve Bayes is good not only when features are independent, but also when dependencies of features from each other are similar between features. In our randomly chosen test data, we have striped off emoticons, stop words and substituted repeated character. After feature reduction, dependencies in our feature vector could be quite similar especially when we only focus on plain text.
Features Naïve Bayes Max Entropy
Unigrams 63.42% 58.31%
Bigrams 76.78% 69.02%
Table 4. Accuracy of Classifiers 5.2 Search Engine Demo
In this section, we demonstrate our proposed Twitter sentiment search engine.
Specifically, we focus on the retrieval of tweets based on two different queries: query with a known sentiment and query with an unknown sentiment.
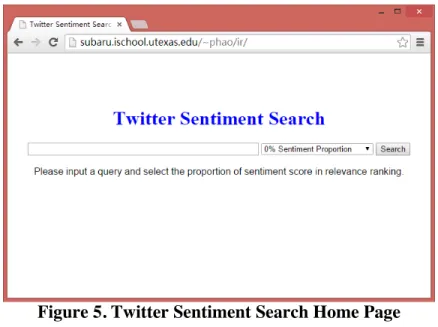
Figure 5 shows the interface of our Twitter sentiment search engine. The input form consists of three parts: a one-line input field for text input, a drop-down list for sentiment proportion selection, and a Search button for submitting the form. Users can type a query in the input field, select a sentiment proportion from the drop-down list, and then click the Search button to retrieve tweets.
Figure 5. Twitter Sentiment Search Home Page
Figure 6 shows the result page according to the query “glad” with 50% sentiment proportion. The search engine returned 137 tweets that include the term “glad”. As everyone knows, the term “glad” should be a positive word, so the sentiment analysis summary shows that 91% of the results expressed the positive sentiment. Also, the background color of the top tweets is green, which means the sentiment of those tweets is positive. In addition, in each frame of a tweet, we can see some details of the tweet, such as the user who posted the tweet, the content of the tweet, the rank, the total score, the cosine similarity score, the sentiment score, and the posted date.
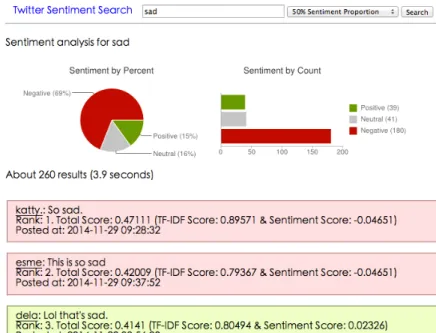
Figure 7 shows the result page according to the query “sad” with 50% sentiment proportion. Though the term “sad” is a known negative word, there is still a certain amount of results (15%) that expressed a positive sentiment. That probably means people sometimes use negative words for joking.
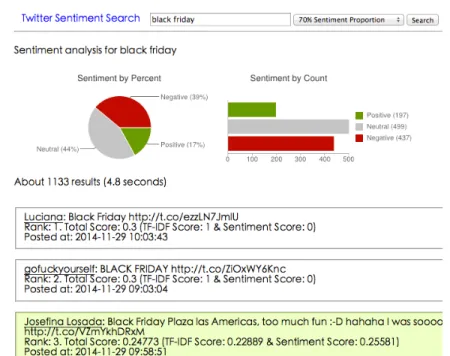
Figure 7. Result Page for the Query “sad” with 50% Sentiment Proportion Figure 8 shows the result page according to the query “black friday” with 70% sentiment proportion. It is hard to imagine the sentiment of the query “black friday” before
searching. Then the result page provided some information: among the 1133 relevant tweets, 44% of them (499 tweets) expressed the neutral sentiment, 39% of them (437 tweets) expressed the negative sentiment, and 17% of them (197 tweets) expressed the positive sentiment. This can be interpreted that when we mention “black friday”, most of people would have either neutral or negative sentiment.
CONCLUSION
Micro-blogging nowadays became one of the major types of the communication [3]. The information contained in tweets makes them an attractive source of data for opinion mining and sentiment analysis. In our project, we build a sentiment-based search engine that enables users to check the sentiment of his query. We train our model by using two different features: unigrams and bigrams. Instead of using unigrams, which uses each word in the tweet as a feature, we find that bigrams will result in better performance. As bigrams usually contain more information about the feature than unigrams.
Besides, in our experiment, Naïve Bayes performs better than Maximum Entropy. For either feature (unigrams and bigrams) used in our training model, the Naïve Bayes classifier always achieves higher accuracy than Maximum Entropy. This is consistent with what Nigam et al found [10].
The term frequency-inverse document frequency model is a classic and well-known vector space model. In our Twitter sentiment search engine, the performance of this model is sensible. However, the TF-IDF model is a very old model. It may be not robust enough to fulfill the requirement of today’s search engines. Moreover, the TF-IDF model is used to rank documents that have certain long content (e.g. blog and news). It may not be good enough to deal with short document (such as tweets) rankings. Therefore, in the future, we will try to find a more robust and powerful ranking algorithm to judge the relevance of a tweet to the user’s query.
Letting users select the sentiment proportion is a convenient and personalized method to balance sentiment weight and cosine similarity weight. However, sometimes, users are not quite sure what sentiment proportion they should set. They would prefer the search engine to help them select the best sentiment proportion. Therefore, for that point, maybe we should introduce some machine learning technologies to our search engine. In
addition, the equation for the overall ranking score is constructed based on our intuition. We still need to find a more effective method to balance and combine the relevance score of a tweet with its sentiment score.
FUTURE WORK
The overall performance of our classifier is not satisfactory. We think in the future we can improve our model in several aspects.
Larger Dataset One possible reason for the unsatisfactory performance of our model is that our training data only contains 21657 tweets. Larger dataset will cover a wider range of words appearing in tweets, which results in better feature vector.
Feature Extraction Among the n-grams features, unigrams and bigrams are the simplest feature we can obtain from corpora. However, if we try more complex feature such as trigram, our model may achieve higher accuracy. One potential flaw of using complex feature is that sometimes the length of the tweet may be less than three words. Therefore trigrams will be of no use. However, we can avoid such problem by only collecting tweets whose length is long enough for analysis.
Emoticons Emotions are not included in the feature vectors. In fact, emoticons can also be a valuable source for sentiment analysis.
Internationalization We only collect English tweets in our project. However, there are lots of twitter users from non-English speaking countries. Sentiment analysis applicable in other languages.
Besides, our work could be more promising if our sentiment analysis is based on real-time data rather than static data.
Real-time Data Even though we have 100,000 tweets stored in the database, it is still likely that a user may fail to check sentiment of his query. The number of tweets
increases dramatically fast and many new words and topics are generated each day. Storing a limited number of static tweets in the database will not meet users’ need. One way to solve such a problem is to use twitter search API. By twitter search API, we can instantly retrieve sufficient real time tweets for analysis. Analyze the sentiment in a dynamic way may also lead us to detect sentiment trend for an event.
REFERENCES
[1] Alec Go, Lei Huang and Richa Bhayani. 2009. Twitter Sentiment Analysis. Final
Projects from CS224N for Spring 2008/2009 at The Stanford Natural Language Processing Group
[2] Alec Go, Richa Bhayani, Lei Huang. Twitter Sentiment Classification using Distant
Supervision. Technical report, Stanford Digital Library Technologies Project, 2009.
[3] Alexander Pak, Patrick Paroubek. 2010. Twitter as a Corpus for Sentiment Analysis
and Opinion Mining. In Proceeding of the Seventh conference on International Language Resources and Evaluation.
[4] B. Jansen, M. Zhang, K. Sobel, A. Chowdury. The Commerical Impact of Social
Mediating Technologies: Micro-blogging as Online Word-of-Mouth Branding, 2009.
[5] B. Pang, L. Lee, and S. Vaithyanathan. Thumbs up? Sentiment classification using
machine learning techniques. In Proceedings of the Conference on Empirical Methods in Natural Language Processing (EMNLP), pages 79–86, 2002.
[6] Changhua Yang, Kevin Hsin-Yih Lin, and Hsin-Hsi Chen. 2007. Emotion
classification using web blog corpora. In WI ’07: Proceedings of the
IEEE/WIC/ACM International Conference on Web Intelligence, pages 275–278, Washington, DC, USA. IEEE Computer Society.
[7] Christopher D. Manning, Prabhakar Raghavan and Hinrich Schütze, Introduction to
Information Retrieval, Cambridge University Press. 2008
[8] Finn Årup Nielsen, A new ANEW: Evaluation of a word list for sentiment analysis in
microblogs, Proceedings of the ESWC2011 Workshop on 'Making Sense of
Microposts': Big things come in small packages 718 in CEUR Workshop Proceedings: 93-98. 2011 May.
[9] Harry Zhang, “The Optimality of Naive Bayes”. In FLAIRS Conference (2004)
[10]K. Nigam, J. Lafferty, and A. Mccallum. Using maximum entropy for text
classification. In IJCAI-99 Workshop on Machine Learning for Information Filtering, pages 61–67, 1999.
[11]Lee, Dik L., Huei Chuang, and Kent Seamons. "Document ranking and the
vector-space model." Software, IEEE 14.2 (1997): 67-75.
[12]Moshe Koppel and Jonathan Schler. 2005. The Importance of Neutral Examples for
Learning Sentiment. Workshop on the Analysis of Informal and Formal Information Exchange during Negotiations (FINEXIN)
[13]Rajaraman, A.; Ullman, J. D. (2011). "Mining of Massive Datasets". pp. 1–
17. doi:10.1017/CBO9781139058452.002
[14]Salton, Gerard, Anita Wong, and Chung-Shu Yang. "A vector space model for