ContentslistsavailableatScienceDirect
Information
Sciences
journalhomepage:www.elsevier.com/locate/ins
Online
personal
risk
detection
based
on
behavioural
and
physiological
patterns
Ari
Yair
Barrera-Animas
a,
Luis A.
Trejo
a,∗,
Miguel Angel
Medina-Pérez
a,
Raúl
Monroy
a,
J.
Benito
Camiña
a,
Fernando
Godínez
baTecnologico de Monterrey, Escuela de Ingeniería y Ciencias, Carretera al Lago de Guadalupe Km. 3.5, Atizapán de Zaragoza, Estado de
México, C.P. 52926, Mexico
bMicrosoft. 1 Microsoft WayRedmond WA, 98052, United States
a
r
t
i
c
l
e
i
n
f
o
Article history: Received31October2015 Revised22July2016 Accepted3August2016 Availableonlinexxx Keywords: Patternrecognition Physiologicalpatterns Behaviouralpatterns Personalriskdetection Anomalydetection One-classclassificationa
b
s
t
r
a
c
t
We define personal risk detection as the timely identification of when someone is in the midst of a dangerous situation, for example, a health crisis or a car accident, events that may jeopardize a person’s physical integrity. We work under the hypothesis that a risk- prone situation produces sudden and significant deviations in standard physiological and behavioural user patterns. These changes can be captured by a group of sensors, such as the accelerometer, gyroscope, and heart rate. We introduce a dataset, called PRIDE, which provides a baseline for the development and the fair comparison of personal risk detection mechanisms. PRIDE contains information on 18 test subjects; for each subject, it includes partial information about the user’s behavioural and physiological patterns, as captured by Microsoft Band©. PRIDE test subject records include sensor readings of not only when a subject is carrying out ordinary daily life activities, but also when exposed to a stress- ful scenario, thereby simulating a dangerous or abnormal situation. We show how to use PRIDE to develop a personal risk detection mechanism; to accomplish this, we have tack- led risk detection as a one-class classification problem. We have trained several classifiers based only on the daily behaviour of test subjects. Further, we tested the accuracy of the classifiers to detect anomalies that were not included in the training process of the clas- sifiers. We used a number of one-class classifiers, namely: SVM, Parzen, and two versions of Parzen based on k-means. While there is still room for improvement, our results are encouraging: they support our hypothesis that abnormal behaviour can be automatically detected.
© 2016 Elsevier Inc. All rights reserved.
1. Introduction
Rapidprogress inmicroelectronics andcomputer systems in recentyears has led tothe development ofsensors and mobiledeviceswithunprecedentedcharacteristicssuchaslowcost,smallsize,andhighcomputationalpower[6,20,22,30]. Asaresult,therehasbeenrapidgrowthanddevelopmentofsensorsthatcanbeintegratedinmobilephonesandwearable devices.
∗ Correspondingauthor.
E-mail addresses: [email protected](A.Y.Barrera-Animas),[email protected](L.A. Trejo),[email protected](M.A. Medina-Pérez),[email protected](R. Monroy),[email protected](J.B.Camiña),[email protected](F.Godínez).
http://dx.doi.org/10.1016/j.ins.2016.08.006
0020-0255/© 2016 Elsevier Inc. All rights reserved.
Overthepastdecade,VitalSignsMonitoring(VSM)andonlineHumanActivityRecognition(HAR)throughwearable sen-sorshaveattractedconsiderableinterestinavarietyoffields,includingpervasiveandubiquitoussensing,mobilecomputing, context-aware computing, andambient assistedliving [1,6,20,21,23,30,34,36,37,43], with specialapplications in medicine, security, healthcare,entertainment,military defence,andcommercialfields[1,6,10,20,22,27,29,30,35–37,43].Gartner’s2015 Hype Cycle for emerging technologies pinpoints wearables atthe peak ofinflated expectations [4]. Moreover, firms like SoreonResearchhaveforecastedanannualgrowthrateof65%until2020forthesmartwearablehealthcareindustry[19].
In thisstudy, we focus on a different butrelated applicationof wearable sensors, namely personal risk detection. We define personal risk detectionasthe timely identificationofwhen someoneis inthe midst ofa dangeroussituation, for example,a healthcrisis ora caraccident,eventsthat mayjeopardizeaperson’s physicalintegrity.Recently, we deployed a personal security solution based on mobile devices called ELISA1 (Emergency, Positioning, and Immediate Assistance). ELISA [40] aims at significantly increasing the possibility of quickly locating and assisting a person in the case of an emergency situation,such askidnapping, car accident, or health crisis. The currentnumber of users is around 750 and growing.When usingELISA, analarmistriggered manuallybythe userincaseofimminentrisk, whichisthen displayed in an authorized C4 (Command, Control, Communications, and Computers). However, aspart of the original design, we envisionedautomaticalarmgenerationbymeansofasetofwearablesensorsthat couldconsiderbothenvironmentaland userhealthconditions.
Ourultimategoalisthustodevelopamechanismthatisabletodetect,inatimelyfashion,whenanELISAuserisunder imminentrisk, such asahealth crisis oracar accident(for example,aturnover orahighimpact crash). Ourhypothesis is that a risk-prone situation produces sudden and significant deviations in standard physiological andbehavioural user patterns.Thesechangescanbecapturedbyagroupofsensors,suchasanaccelerometer,gyroscope,andheartratedetector. Theaimofthisstudyistwofold.First,we introduceadataset,calledPersonalRIskDEtection(PRIDE, forshort),which providesabaselineforthedevelopmentandthefaircomparisonofriskdetectionmechanisms.PRIDEcontainsinformation of18testsubjects; foreach subject,itincludespartial informationaboutuser’sbehaviouralandphysiologicalpatterns,as capturedbyMicrosoftBand®.MicrosoftBandisanetworkofwearable sensorsthatmonitors 3Dacceleration,3Dangular velocity,heartrate,distance,skintemperature,andexposuretoultravioletrays,amongothers.PRIDErecordsincludesensor readings of not only when a test subject is engaged in ordinary daily life activities, but also when that subjectis in a stressfulsituation,whichmayindicateadangerousorabnormalcondition.
Wehavecarefullydesignedanumberofsuchscenarios,inordertosimulateanomalousconditions,comprisingpossibly risk-prone situations.The scenarios includerunning100 m atmaximumspeed, fallingbackwards, andmore.Further, we evaluated thefollowingdetectionproblem:tobuild amechanismthat isabletodetect,inatimelyfashion,whena given userisinadangerousorabnormalsituation,byidentifyingacleardeviationfromtheuser’sordinaryprofileofbehaviour. Thus,westructurepersonalrisk detectionasan anomalydetectionproblem.Theanomalydetectorisaone-class classifier, which isnot trainedusing stress scenarios;itis trainedonly withauser’s ordinary conditionsdata.Stress scenarios are onlyusedtoverifyiftheclassifieriscapableofidentifyingthemasananomaly,andnottoidentifywhichscenario/activity isbeingobserved.The stressscenarios arethus intendedto simulatecertain dangerorabnormalbehaviour; however,we acknowledgethey are onlyan approximationtoreal-life situations.Ouraimisto detectanomalies thatcan bethe result of acar accident, healthcrisis, robbery,and soon. Since we donot have themeans to capturedataduring areal crisis situation,wedecidedtoundertakethisapproach.
Thesecond aimofthispaperistoshowhowtousePRIDEtoaddresstheabove statedanomaly detectionproblem;to accomplish this, we havetackledrisk detection asaone-class classification problem. We trainedseveralclassifiersbased solelyonthe dailybehaviourofusers.Next,we testedthe performanceoftheclassifiersto detectanomaliesthat wedid notincludeinthetrainingprocessoftheclassifiers.WetestedSVM [41],Parzen classifier[9],andtwoversionsofParzen based on k-means [13,39]. While thereis still room for improvement,our resultsare encouraging.We have successfully validatedourworkinghypothesis,namelythat,aone-class classifierisable todetectanomaliesinthesensorinformation ofatestsubject,asprovidedbyMSBand,forpersonalriskdetection.
It is worth noting that anomalous situations may sometimes be related to a dangerous situation, i.e., to a personal risk-pronesituation.However,taggingabehaviourasabnormaldoesnotalwaysimplyrisk.Furthermore,notallrisk-prone situationsalwaystranslateintoabnormalbehaviour,atleastwiththetechnologyusedinthisstudy.Inotherwords,weare ableto differentiateabnormal behaviourandordinary behaviour,therebydetecting some (butnot all)possiblerisk-prone situations.
Paper overview. In Section 2, we review state-of-the-artapproaches inHAR andVSM includingsome applications; addi-tionally, we describe some populardatasets inthe area. Wealso review themain algorithms fromthe machine learning andpatternrecognitiondomainsthatareappliedtoHARandVSMsystems.InSection3,wedescribePRIDE,anewdataset publicly available forpersonal risk detection. Therein,we briefly describe the procedure to capturetest subject data, as well as the mobile application and sensor network used during the process. In Section 4, we present our proposal for onlinepersonal riskdetectionandthemannerinwhichweusePRIDEforthispurpose;wealsopresentexperimentsusing
one-classclassificationalgorithmsrunonthePRIDEdataset.Next,inSection5,wesummarizeourmainresultsalongwith abriefdiscussion.Finally,inSection6,weconcludewithourfindingsandcommentsonfuturedirectionsofresearch. 2. Relatedwork
This section outlines state-of-the-art approaches in HAR and VSM, problems that are most related to personal risk detection.First,we presentan overviewofthe keychallengesfacedbyeitherHAR orVSM. Then,wediscussthetypesof sensors andhowthey havebeenused to capturebehavioural andvitalstest subjectpatterns forHAR orVSM. Next,we outlinethealgorithmsthathavebeenusedforHARorVSM,andfinallywebrieflydescribesomeexistingdatasetsthatare oftenreferredtointheliterature.
2.1. HARandVSM:keychallenges
Notwithstandingthatboth HARandVSMhavebeenhot research areasformorethan adecade,they stillhaveseveral shortcomings.Forexample,achallengeofHARistherecognitionandlabellingofcomplexactivitiesindailylifesituations, especiallyin a non-laboratory environment [1,20,22,29,30,34,37,43].According to [1,6,23],a complexactivity isa group of consecutivemovementsofsingle/simpleactivitiesperformedbyasubjectunderinspection.InthecaseofVSM, thereisa lackofvitalsamplescorrespondingtoscenariosofcrisisthatcouldserveascounterexamplesofordinary,stableconditions. Thatis, there is a plethora of vitalsunder healthy or normal conditions; nevertheless, vitals undercrisis conditions are sparse and difficult to obtain [30,35]. In addition, expensive computational cost, near real-time classification, resource consumption,amongothers,arealsoshortcomingsinbothHARandVSM[1,10,21–23,27,29,30,35–37,43].
AkeychallengeforresearchcommunitiesofbothHARandVSMisthelackoffaithfulandreliablepublicdatasets[34,37]. Inbuildingsuchadatasetseveralcomplexitiesusuallyarise.Tobeginwith,itisnoteasytorecruitvolunteers,owingto pri-vacyandanonymityconcerns.Inaddition,openlysharingadatasetofsuchakindintothescientificcommunityrequiresa proper,legalagreementwiththeownerofthedata[1,22,29,34,35,37].Eveniflegalissuesareovercome,developingareliable datasetinvolvesconsideringtechnicalaspects;forexample,oneneedstodeterminethenumberandtypeofsensors,how in-trusivetheywouldneedtobefortheapplicationathand,whethertheyareuser-friendly,whereinthebodywouldtheybe located,howlongwouldtherecordingsneedtobecarriedoutfor,andsoonandsoforth.Inaddition,thefinal,intended ap-plicationmustalsobetakenintoconsideration,sinceitisnotthesametoconductastudytowardsmappingvitalsto phys-icalactivity,asaimingatidentifyingcriticalconditionsthatcouldrepresentanimminentrisktothefinaluser[10,29,34,37]. 2.2.SensorsforHARorVSM
During the early studies on activity monitoring and recognition, dedicated wearable sensors such asaccelerometers, gyroscopes,andmagnetometerswereusedtorecognizeabroadnumberofsimplephysicalactivities[36,37,43].Later,they beganusingeitherdedicatedsensorsattachedtothehumanbodyand/or sensorsintegratedintomobilephonesowing to theirhigheravailabilityandlowcost[6,36].Asaresult,thenumberandvarietyofsensorshaveincreased.RFID,GSR,GPS, cameras, microphones, skintemperature, blood pressure, heart rate, EEG, ECG, respiratoryrate, proximity, in addition to accelerometers,gyroscopes,andmagnetometers,arethemostcommonsensorsusedacrossvariousrelatedstudiesoverthe years[1,6,20–23,27,29,30,34–37,43].
There are two main approaches in HAR, one involves the use of external sensors and the other involves the use of wearable sensors. The external approach involves sensors placed in an environment that surrounds test subjects or on specificobjectswithwhichsubjectsinteractdirectly.Incontrast,wearablesensorsaredirectlyorindirectlyattachedtothe humanbody[6,22].
Examplesof applicationsof theexternal HAR approach aretypically found in intelligent laboratoriesandhomes[22]. Valedo system, CLARITY Centre, Technology Research forIndependent Living (TRIL) Centre, Oregon Centre forAging and Technology (ORCATECH), University ofFlorida Gator-TechSmart House, GeorgiaInstitute ofTechnology Aware Home,and theMassachusettsInstituteofTechnologyPlaceLabexemplifythesesmartfacilities[3,15,24,30,31,38,44].
Wristbands,smartwatches,andsmartclothessuchasfitbit©,Basis©,Athos©,andMicrosoft©,aswellasresearchprojects such asLiveNet, LifeGuard, AMON, MyHeart, WEALTHY, MagIC,andcommercial deviceslike Life Alert,and AlertOne,are examplesofapplicationsofthewearableHARapproach[30].Wearablesensorscanbeobtrusiveorunobtrusive,depending onthewaytheyattachtothehumanbody.Sensorsthatadheretothehumanbodyareconsideredobtrusive.Ontheother hand,sensorsembeddedin clothes,eyeglasses, belts,shoes, wristwatches,wristbands, headbands, mobile devices,andso on,areconsideredunobtrusive[6,20,36].
HARstudiesfocusonthe recognitionofanykindofhumanactivity;however,onlyalimitedlistrepresentingcomplex humanactivities prevailsinseveralworks[1,6,10,20–23,27,29,34–37,43].Examplesofsuchactivities areasfollows:prepare and consume food, personal hygiene, such as taking a shower and brushing teeth, household chores, physical exercise, driving,walking,sitting,lyingdown,climbingstairs,interactingwithpersonalobjects,etc.
LimingChenetal.[6]surveyedstate-of-the-artresearchonsensor-basedactivityrecognition,andprovidedahigh-level overviewaboutapproachesandmethodsassociatedwithsensor-basedactivitymonitoring,modelling,andrecognition. Fur-thermore,theycompareddifferentmethodsbasedontheirrobustnessinreal-worldconditionsandreal-timeperformance.
Roggenetal.[34]describeddatasetsthatcontainedcomplexactivitiesoftenfoundintheliterature;theyalsoprovidedtheir owndatasetwithenvironmentandwearablesensors,highlightingtheir usetodevelop newsensornetworksandmachine learningtechniquesforhumanactivityrecognitionsystems.Liuetal.[23]addressedtheproblemofcomplexactivity recog-nition using time seriesextracted frommultiple sensors, by representing single/atomic activities asa dictionary of time seriespatternscalledshapelets;theyevaluatedtheirapproachusingtwodatasetsfromtheliteratureandonedevelopedby them.Inaddition,acomparisonwithclassifierscommonlyusedforbothatomicandcomplexactivityrecognitionisgiven. Soumya etal.[10]implemented a wirelesssensor networkforactivity recognitionfocused on healthcare;three activities areidentified,sitting,walking,andstanding,with81%accuracyusingalow-energyflexsensorbandwornontheknee.
LaraandLabrador[22],andMukhopadhyay[27]surveyedthestate-of-the-artinHARwithregardtowearable sensors; they compared HAR systems in terms oflearning approach,types of sensors (obtrusiveness, wearables, etc.), monitoring activities,anddetectionaccuracy.Intheirsurvey,theymentiontheworkofStikicetal.[37],wheredifferentdirectionsare proposedtobridgethegapbetweenstate-of-the-artactivityrecognitionapproachesandreal-worlddeployment ofactivity recognition systems;they builtan unobtrusive activityrecognitionsystemthat requires minimaluser involvementinthe trainingprocess.
Patel et al. [30] summarized recent developments in the field of wearable sensors and systems that are relevant to the field of rehabilitation, describing applications focused on health and wellness,safety, home rehabilitation, treatment efficiency,andearlydetectionofdisorders.Selvaraj[35]investigatedtheeffectivenessofpatchsensorsforcontinuousand long-termmonitoringinoldersubjectsover50consecutivedaysattheirhomesetting;resultsconfirmedthatpatchsensors are suitable for long-termvital signmonitoring asthey achieve high accuracymeasurements and positive userfeedback for home use.Lamprinakos etal. [21]described thedesign and implementationof a platform that integratesvital signs monitoring(Telehealth)withbehaviouralanalysisbasedonhomecaresensors(Telecare)aimedatimprovingthequalityof life ofelderlypeople andreducing healthcarecosts. Moreover,the platformenablesthe deployment ofservicestofollow up withapatient’shealthstatusbasedonasetofmonitoredparameters perdiseaseanddiagnosesdeviationsfromtheir usual activities. Avcietal.[1]surveyedthecurrentresearch directions ofactivityrecognitionusinginertial sensors(such asgyroscopeandaccelerometer),withpotentialapplicationinhealthcare,wellbeing,andsports.Shoaibetal.[36]reviewed themainworksthatimplementHARsystemsonmobilephonesusingonlytheirbuilt-insensors.
2.3. MainalgorithmsandtechniquesusedinHARandVSMsystems.
Pattern recognition and classification algorithms are the most relevant processes in HAR and VSM systems. A wide rangeofmachine learningtechniqueshavebeen usedtomanipulatedata,findpatterns,andclassifythem,which implies labellingdata accordingto an activity.The learningtechniques are classifiedassupervised andunsupervised.Supervised learning handles labelled collected data, whereas unsupervised learning deals with unlabelled data [6,20,22,27,37]. Ref-erences [1,6,20,22,23,27,29,37,43] list the most common classification algorithms used in HAR literature . Additionally, Shoaib et al.[36] presented a survey of the main classifiers implemented on mobile phones. The following algorithms are frequently mentioned: decision trees,Bayesian networks, k-nearest neighbours,support vector machines, fuzzylogic, regressionmethods,Markovmodels,classifierensembles(boostingandbagging),artificialneuralnetworks,etc.
RegardingVSM, in[7,16,18,28,32,33],differentalgorithmsandtechniquessuch asKalman filter,hiddenMarkovmodels, autoregressive hiddenMarkovmodels,Gaussianmodels,Rao-Blackwellisedparticlefiltering,templates, thresholds,spectral analysis,fuzzylogic,andartificialneuralnetworksareapplied.
2.4. Existingdatasets
Acrosstheliterature,therearefewpublicdatasetssuitableforcomplexactivityrecognition,whilethereareplentythat addresstherecognitionofspecificactivities.
Existingdatasets inVSMcompriseveryprecise anddedicated sensorsfromthemedicaldomainsuchas electrocardio-grams,pulse oximeters,andrespiratoryratesensors, to mentionsome. Eventhough there are some open datasets, their purpose ismainly oriented to registermedical conditionssuch as arrhythmia,hypertension, surgical care, coronarycare, andneonatalcare,amongothers.
Below,wedescribesomeofthedatasetsthatalignwithourresearchinterest.Thereaderisreferredtotheoriginalwork formoredetail.
2.4.1. MITPlaceLabdatasets
ThePlaceLabisalive-inlaboratoryinCambridge,forthestudyofubiquitoustechnologiesinhomesettings.Itisajoint MITHouseandTIAXinitiative.Theirprincipal datasetsarePLIA1(PlaceLab IntensiveActivity1), PLIA2(PlaceLabIntensive Activity 2), andPLCouple1 (PlaceLab Couple 1). Eventhough PLIA2 is an improvementof PLIA1, PLCouple1 is the more activeandricherdatasetamongthethree;hence,wedescribeitnext.
PLCouple1containsdataofacouplethatlivedinthePlaceLabforaperiodof10weeks,withapproximately206ambient sensors placedaround thelaboratoryenvironment, 277motiondetectionsensors, 435RFIDtags,and5 wearablesensors. Inaddition,thelaboratoryhasaudio-visualrecordingsthatarenotpubliclyavailableduetoprivacyissues.
Inaddition,thereare100hoflabelledactivities,makingadistinctionbetween“foreground” and“background” activities. “Foreground” activitiesarethosethetestsubjectpaysfullattentiontowhenperforming theactivity.Intheother case,the activityisconsidered “background”. Activitieswere fined-grained,forexample,sweeping, foldinglaundry, brushingteeth, activelywatchingTV,andwatchingTVinthebackground.
Althoughthedatasetisveryrichinsensormeasurements,therearesomelimitationstheauthorsareawareof.Data col-lectioninalaboratoryenvironment,only104hofmarkedactivities,missinginterestingactivitiessuchassleepandpersonal hygiene,testsubjectsparticipatinginsimultaneousexperimentsrequiringwearablesensors,andasmallamountoftest sub-jects,areexamplesoftheselimitations.ThePLCouple1datasethasbeenusedinseveralworks,including[3,15,24,31,38,44]. 2.4.2. TUDarmstadtdataset.
Developed andintroduced by Hu`ynh et al.in [14].The dataset consists ofseven daysof recording, 84h ofeffective labelleddata, one male test subject, two wearable accelerometer-based sensors, and20 activities. The types ofactivities recordedare:eating,washingdishes,personal hygiene,walking,driving,sitting,standing,etc.Therestoftheactivitiesare unlabelled.
DespitethefactthattheTUDarmstadtdatasetfacesconstraintssuchasthenumberoftestsubjectsandthenumberof wearablesensors,itcontainsareasonableamountofeffectivehoursandan extensiverangeofsingleactivities thatcanbe translatedintocomplexones.Furthermore,datawasalsocollectedunderrealworldconditions.
2.4.3. TheOPPORTUNITYactivityrecognitiondataset.
Roggenetal.[34]contributedwithanextensivecomplexdatasetthathasbeenabenchmarkintheHARfield.Itconsists of12testsubjects,72sensors,around twohours ofeffectivedatapersubject, approximately27,000labelledinteractions, andatotalof25hofsensordata.Multiplesensorsystemsweredeployedonobjects,intheenvironment,andonthebody oftestsubjects.
Accordingtotheauthors,thedatasetaimed atmaximizingthenumberofactivityinstancesthat werecollected, while keepingtheexecution naturalistic.However, the activities were recordedin a laboratoryenvironment, namelyin aroom thatsimulatesaflatstudiowithadeckchair,akitchen,accessdoorstotheoutside,acoffeemachine,atable, andachair. Testsubjectsperformedactivities ofdaily livingsuch aslyingon thedeckchair andgettingup,moving around theroom interactingwithobjects,walkingoutsidethe laboratory,preparing andeating food, drinkingcoffee,cleaning up thetable andwashingdishes,openingandclosingdifferentfurnitureandhouseholdelectricalappliance,etc.
The dataset contains rich gestures instances and annotations. However, it presents some limitations; for example, naturalbody movementsand interactions withobjects are restricted by consecutiverepetitions within a shortperiod of time;moreover,the testsubject mustfollowa givensequenceof activities,andfinally,all recordings areperformedin a laboratoryenvironment.
2.4.4. TheMHEALTHdataset
Banoset al.describe the dataset in [2]. It is built frombody motion andvital signsof 10 test subjects withdiverse profiles,12 activities,andthreewearable sensordevices.The sensorsare 3-axisgyroscopes,3-axismagnetometers,3-axis accelerometers,andanelectrocardiogram. Therecordedactivities are:standingstill,sitting,lying down,walking,climbing stairs,waistbendsforward,frontalelevationofarms,crouching,cycling,running,jogging,andjumping.
The test subjects performedeach activity in independent sessions. Some activities were recorded in sessions of one minuteand othersduring repetitionsof 20. Despitethe guided recording,the dataset wascaptured ina non-laboratory environmentthatofferedthetestsubjectsthefreedomtoperformtheactivitiesnaturally.Limitationsofthedatasetarethe numberofsensorsused,aswellasthescarcetimeforactivityexecution,whichledtoalimitednumberofrecordings.
Existingdatasetsastheonesjustdescribed, whenavailable totheresearch community,havebeenofgreat supportin thedevelopmentofnewtechniquesandapplications.Webelievethatadatasetshouldavoiddatacollectedinalaboratory environmentand/orwiththepresenceofathirdpersonthatcouldleadtounnaturalbehavioursduringtheexecutionofan activityasfaraspossible.Inaddition,wheneverpossible,theuseofobtrusivewearablesensorsforlongperiodsshouldbe avoided.Additionally,itisdesirablethatadatasetcontainmoreeffectivehoursoflabelledand/orunlabelleddata.
3. Buildinganewdataset:thePRIDEdataset
As mentioned earlier, our aim is to distinguish any non-ordinary condition or risk-prone situation from normal be-haviour;therefore,ourworkcannot explicitlyclassifiedaseitherHARorVSM.ItisnotHARsincewearenotpursuingthe recognitionofa useractivity,andit isnot VSM,since we arenot usingspecializedmedicalsensors (indeed,we monitor onlyheartrate).Thisisoneofthereasonswedecided toundertakethecreationofa newdataset,basedonordinary life activitiescomplementedwithspecificscenariosunderstressfulsituations.However,algorithmsandtechniquesusedinHAR andVSM systems(summarized inSection 2.3) arewell suited toourcase, which canbe statedasan anomaly detection problem, where one-class classification algorithms have proved effective.As explained later in Section 4, we decided to performourclassificationexperimentsusingthefollowingtechniques: supportvectormachines, Parzen,andtwo versions ofParzenbasedonk-means.Next,wedescribethemethodologyemployedtobuildsuchadataset.
3.1. Buildingthedataset
The PRIDE (Personal Risk Detection)dataset isbuilt withthe help of18 test subjects anda periodof data collection ofoneweekeach,24hper day;thenormalconditionsdataset(NCDS)isbuiltinthismanner.Next,tobuildtheanomaly conditionsdataset(ACDS),thesame18testsubjectscollaborateinanotherprocess togather dataunderspecificabnormal orstressfulconditions.The scenariosincludeactivities suchasrunningseveralmeters,goingup anddownthestairsofa several-floorbuildingasfastaspossible,simulatingafight,andsoon.
The NCDS also includes 14 labelled activities such as having breakfast, having lunch, having dinner, drinking coffee, driving a car,watching TV/goingto the cinema,sleeping, ridinga bike, jogging,running, asocial gathering, usingpublic transport, andgym(anaerobic activity,e.g. weight lifting,sprinting). Additionally,an extra fieldwasincluded, sothe test subjectcould labelanyother activities ofinterest.However, inthe presentstudy,wedo notattempt torecognize anyof theseactivities.
To collect data we use Microsoft Band© and a mobile application that we developed using the available SDK. We captureddatafromtestsubjectsundernormalandabnormalconditions.Allcapturedstreamdataistransferredtoaprivate cloudunderouradministration.
During the period ofdata collection,each test subjectregisters their dailylife activities under realworld conditions. Hence,their behaviourandvitalsignsarenotrestrictedtoalaboratoryenvironment.Forthisreason,thedatasetprovides real data underreal daily situations,where the test subjects feel comfortablewearing the band [35] and without being deprivedoftheirprivacy[10].
To ensure a more complete study [22], test subjects with diverse characteristics such as gender, age, height, and sedentarylifestylewereconsidered.Thetestsubjectsgroupcomprises5femaleand13malevolunteerswithagesbetween 21and52yearsold,heightsfrom1.56 mto1.86 m,weightsrangingfrom42to101 kg,exercising0–10h aweek,and timespentsittingduringworkinghoursorleisurefrom20to84haweek.
Tobuildtheanomaly dataset,wedesignedfivespecificscenarios thatsimulateabnormalorstressful conditions.These scenarios were carefullyplanned and included the following activities:rushing 100 m asfast aspossible, going up and down the stairs ofa several-floor buildingasfast as possible,a two-minute boxing practice, fallingback and forth, and holding one’s breath for as long as possible. Each activity, respectively, aims at simulating a real-world dangerous or abnormalcondition:runningaway fromadanger situation,leavinga buildingowingtoan evacuationalert, fightingback anaggressorduringaquarrel,swoons,andbreathingproblemslikedyspnoea.
Inordertoobtainreliableresultsthatservetodistinguishabnormalfromnormalconditions,thescenariosaremonitored without interfering withtest subjects concerning their freedom to perform such activities. The special session to build the anomalydataset lastsforabouttwohours anddemands considerablephysicaleffort. Althoughtheelderly area very important group in society aspointed out in [21], we cannot include them in the process to collect data owing to the demandingnatureofourmethodology.
As mentioned in Related Work, Section 2, activities such asrunning, climbing stairs, andfalling have been success-fully detected by accelerometers and gyroscopes [1,6,10,22,23,27,29,30,34–37,43]. We believe that other abnormal events originatingfromsituationssuchasafightorlossofconsciousness,canbedetectedwiththesamesetofsensors.
Adaylogfromatestsubjectincludesallobservationsthatappearfrom00:00hto23:59h.Eventhoughatestsubject gathereddataforaperiodofsevendays,thereisagapinthelogofatleast40minnormallythreetimesperdayowingto thebatteryrechargingprocess.Moreover,sincethecollectionofdataisperformedduringordinaryandquotidianlife,test subjectsnormallypauseddatacollectionforseveralpersonalreasons,e.g.,toperformanaquaticactivity.
PRIDE isfreely available fordownload,through Syncplicity©cloud solution,by sendinga request tothe corresponding author.Fortheinterestedreader,weshowinAnnex1fromthePRIDEdataset,themeanvalue,x,andthesamplestandard deviation,s,ofalltestsubjectfeaturesaswellasthenumberofobservations.
Inthefollowing,webrieflydescribethemobileapplicationdevelopedaswellastheband’sbuilt-insensors. 3.2. Mobileapplicationandsensornetworkdescription
To capture test subject data,we decided to use Microsoft Band [25,26], mainly for two important reasons: first, the numberandnature ofsensors includedinthe band;andsecond, theavailability ofan SDKthat allows usto develop an applicationaccordingtoourneeds.TheapplicationwedevelopedforAndroid platformconnectstothebandviaBluetooth. It then readsthesensor datain realtime andstoresall measurements into aCSV file that residesin themobile phone. ThefileistransferredtoasecureFTPserverunderouradministration.Thisisdonebythetestsubjectonceortwiceaday, usingtheUploadFiletoServeroptionontheapplication.
AccelerometerandGyroscopedata isreadatan intervalof125ms (sensorsoperatingfrequencysetto8Hz),inorder toensurea reasonablefile size(about175 MB)after24h andabatterylife ofalmost 9h.Thebatterycanbe recharged to80%ofitsfullcapacityinapproximately40min.Tocompare,ifweuseasensoroperatingfrequencyof31Hzor62Hz, thesizeofthefilegrowsupto650MBand870MB,respectively,andbatterylifeisdegradedto8hand6h,respectively. However, thefrequency ofoperationcan be setto 8,31or 62Hzanytime directlyfromthe application. Distance,heart rate,pedometer,andcaloriesmeasurementsareloggedusingareadoutintervalof1s,whileUVandskintemperaturedata are collectedevery 60s and30s,respectively, orwheneverthe value changes.Since GPS dataisnot available usingthe
Table1
Sensordescription.
Sensor Description Frequency Accelerometer ProvidesX,Y,andZaccelerationingunits. 8 Hz
1g=9.81mpersecondsquared(m/s2).
Gyroscope ProvidesX,Y,andZangularvelocityin 8 Hz degreespersecond,(°/sec)units.
Distance Providesthetotaldistanceincentimeters, 1 Hz currentspeedincentimetersper
second(cm/s),currentpaceinmilliseconds permeter(ms/m).
Heartrate Providesthenumberofbeatsperminute,also 1 Hz indicatesiftheheartratesensorisfullylocked ontothewearer’sheartrate
Pedometer Providesthetotalnumberofsteps 1 Hz theuserhastaken.
Skintemperature Providesthecurrentskintemperature 33mHz oftheuserindegreesCelsius.
UV Providesthecurrentultraviolet 16mHz radiationexposureintensity
(none,low,medium,high,veryhigh)
Calories Providesthetotalnumberofcalories 1 Hz theuserhasburned.
SDK,itisimportanttomentionthatdistanceisderivedbyaMicrosoftproprietaryalgorithm,whichtakesintoconsideration the numberof steps taken by the user (pedometer),and user’s stridelength and height. Height andother generaluser information is provided when setting up the application andwhen synchronizingwith the band for the first time. The algorithmisaMicrosoftpatent.2
InTable1,welistanddescribethesensorsinthebandaswellasthefrequenciesatwhichdatacanbe retrievedfrom them.Usingtheshownsensorsoperatingfrequencies,testsubjectdatagrowstoapproximately1,670,160registersinaday (around175 MB)andbatterylifeisabout9h.
4. Proposalforonlinepersonalriskdetection
Inordertodetectapersonalrisksituation,weuseanapproachbasedontherationalethatpeopleusuallybehavebased on the same behavioural and physiological patterns or with small variationsthereof. To support our claim, we use the PRIDE dataset todevelop a personal risk detectionmechanism, butbefore running anyexperiments, we first performed pre-processingonthedataset.Thefollowingstepssummarizethedatasetpre-processingprocedure:
• ForeachtestsubjectinthePRIDEdataset,thedatacollectedisarrangedbyday.
• Dateandactivitylabelfeaturesareremoved.
• The feature vector is computed using a window size of one second. Because the frequency of our sensors varies significantly,we apply three rules tocompute the featurevector of agiven window:1) ifthe readoutinterval isless than onesecond, thefeature vectorisassignedboth theaverage andthe samplestandarddeviationforall thesensor measurements;2)ifitisequaltoonesecond,thenthefeaturevectorisdirectlyassignedthesensorvalue, and3)ifit isgreaterthanonesecond,thefeaturevectorisassignedthelastsensorvalue.
Morespecifically,afeaturevectorforagivenwindowcontains:
• Meanandstandarddeviationforgyroscopeandaccelerometermeasures.
• Absolutevaluesofheartrate,skintemperature,pace,speed,andUVsensors.
• The incremental change (
-value) for absolutevalues of total steps, total distance, and calories burnt. A
-value is computedasthedifferencebetweenthecurrentandpreviousone.
Asaresult,a26dimensionalfeaturevectorisobtainedanditsvaluesrefreshedeverysecond.Thestructureofthevector isshown inTables 2 and3. Both, the NCDSand theACDS are pre-processedusing thismethod. Next,we proceed with thedescriptionofseveralexperimentsthatsupportourhypothesisthatabnormalbehaviourcanbeautomaticallydetected usingaone-classclassificationapproach[17].
Wedividedeachofthetestsubjectlogsinto5foldstousetheminafive-foldcross-validation.Inthecross-validation, we used 4 folds of the test subject normal behaviour for training and one fold, joined with the anomaly dataset log, fortesting the classifiers.We repeated thisprocedure five times alternating the test subject fold that isleft fortesting. Accordingly,wecreated5trainingdatasetsand5testingdatasets.
Table2
Featurevectorstructure(1–18fields).
Gyroscopeaccelerometer Gyroscopeangularvelocity Accelerometer
Xaxis Yaxis Zaxis Xaxis Yaxis Zaxis Xaxis Yaxis Zaxis
x s x s x s x s x s x s x s x s x s
1 2 3 4 5 6 7 8 9 10 11 12 13 14 15 16 17 18
Table3
Featurevectorstructure(19–26fields).
Heartrate Skintemperature Pace Speed UV Pedometer Distance Calories
19 20 21 22 23 24 25 26
Inourdatasets(the pre-processedPRIDEdataset),everyobjectisstoredasarowina CSVfile,followingthestructure ofthefeaturevectordescribedpreviously.Thelastcolumnofeveryrowcontainsoneoftwolabels(“typical” or“atypical”). Thelabel“typical” indicatesthattheobjectrepresentsnormaltestsubjectbehaviour,andthelabel“atypical” indicatesthat theobjectrepresentsananomalousstate.Thislabel, though,isneverusedformethodtraining,butonlyforcomputingthe methoddetectionperformance.
Users want to be protected by the ideal classifier, namely, the one that is able to detect every possible abnormal behaviour without confusing for normal behaviour. Therefore, our task is to build classifiers that maximize true posi-tive classifications(i.e.true abnormal conditions) while minimizing false positive ones (i.e. false abnormal or dangerous situations).Therefore,weevaluatedtheclassifiersusingthefollowingperformanceindicators:
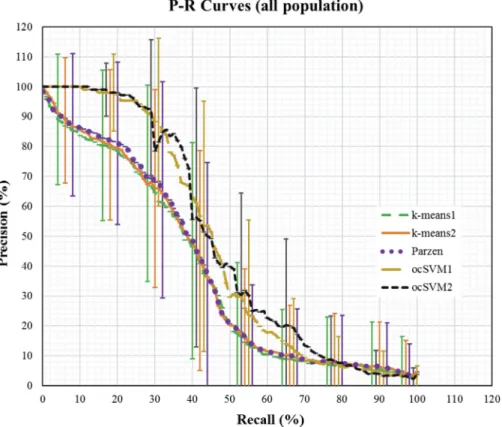
• Precision-Recall(P-R)curves:Precisionisthefractionofretrievedinstancesthatarerelevant,whileRecall(alsoknown assensitivity)isthefractionofrelevantinstancesthatareretrieved.Inourcase,arelevantinstanceischaracterizedby atrueanomaly.Inaddition,Recallisequivalenttothetruepositivedetectionrate(TPR). Webuilta P-Rcurveforeach userindependentlyandasingleP-Rcurvefrommeanandstandarddeviationofallusers.
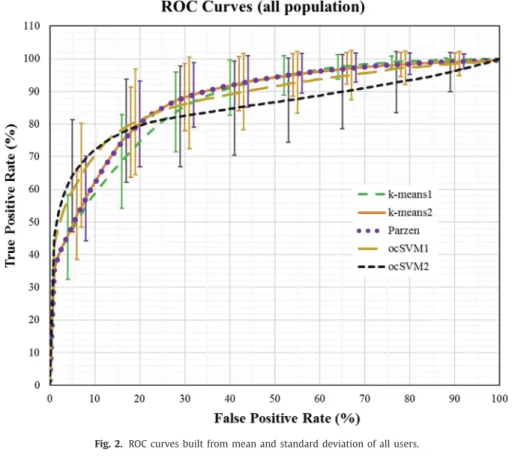
• ROC curves: We computed the performance indicators from Receiver Operating Characteristic (ROC) curves, which we builtaccordingto [11]. Wefollowed a similar approachas inthe P-Rcurves.We builta ROC curve foreach user independentlyandasingleROC curvefrommeanandstandard deviationofallpopulation. Inthecontext ofpersonal risk detection, sensitivity is crucial, i.e., it is preferable to receive several false alerts (false abnormal or dangerous situation)thanmissingonetrue(falseordinaryornormalcondition);hence,itisimportanttomaximize Recallevenat thecostofexperimentingacertainfalsealarmrate.
• AUC:Areaunderthecurveoftruepositivedetectionrate(TPR)versus falsepositivedetectionrate(FPR).Thisindicator givesanideaofthegeneralperformanceoftheclassifierforallfalsepositivedetectionrates.
• EAR:EqualAccuracyRateisthevalueofthetruepositivedetectionratewhenitisequaltothetruenegative(i.e.normal testsubjectbehaviour)detectionrate(TNR).Thisvalue representsthebesttrade-off betweenthetwotypesofmetrics TPRandTNR.Thismeasuremightnotbeofinterestinthepresentcontextofpersonalriskdetection;however,wehave notexcludedithere,asitoffersacomplementaryperspectiveofdetectionperformance.
• Accuracy: The number of correct classifications (true positives plus true negatives) divided by the total number of classificationsmade.
Inordertocreateabaselineforfutureresearches,weevaluatedthefollowingclassifiers:
• Parzen:ParzenWindowClassifierusingMahalanobisdistance[9].Foreverytrainingdataset,wecomputedthewidthof theParzen-windowaveragingthedistancesbetweenobjectssampledevery60s.3
• k-means1:A versionof ParzenWindow Classifierbased onk-means [39].k-means1 classifiesnewobjects basedonly ontheclosestcentreofcluster.
• k-means2: A version of Parzen Window Classifier based on k-means [13]. k-means2 classifies new objects using all centresofclusters.
• ocSVM1:Theimplementationofone-classSupportVectorMachines[41]includedinLibSVM[5]withdefaultparameter values(
γ
=0.038andν
=0.5)andusingtheradialbasisfunctionkernel.• ocSVM2: A version of ocSVM1 with a pseudo-exhaustive algorithm that maximizes max(TPR+TNR). First, we fixed
ν
=0.01 and, startingwithγ
=0.0, we increasedγ
by 1.0untilmax(TPR+TNR) didnot increase inthree consecutive iterations.Then,weiteratedoverfivevaluesnearthebestγ
foundandforeachiteration,wetestedfivedifferentvalues ofν
in[0.1,1.0].Ifmax(TPR+TNR)didnotincreaseaftertryingtwoconsecutivevaluesofν
,weincreasedγ
andstarted withthevaluesofν
alloveragain.We repeatedthisprocedure10times,eachtimetestingvaluesclosertothebestγ
andν
. Itis worthmentioning that thisoptimizationwasperformedonthetestingdataset, withthesoleintentionof demonstratingtheperformanceofSVM,withfine-tunedparameterssetup.Fig.1. Precision-Recallcurvesbuiltfrommeanandstandarddeviationofallusers.
5. Resultsanddiscussion
In the previous section, we showed how to use PRIDE to develop a personal risk detection mechanism and found encouraging results. We trained several classifiers based only on the daily behaviour of users; then, we tested their performancetodetectanomalies.Theexperimentssupportedourhypothesisthatabnormalbehaviourcanbeautomatically detectedusingaone-classclassificationapproach.
Forthe sakeofsimplicityandspace, weonlyshow theP-RandROCcurvesofall populationinFigs. 1and2, respec-tively;standard deviationisshownasa verticalline peralgorithm atdifferentintervals. Forthoseseeking furtherdetail, individualP-RandROCcurvescanbeviewedthroughSyncplicity©cloudsolution,thesamewayasthePRIDEdataset.
FromP-RcurvesshowninFig.1,wecanpointoutthatocSVM1andocSVM2outperformthethreeParzenmethods;this isconfirmedbytheROCcurvesanalysisbelow.Wealsonoticethatallclassifiersattainedabove80%ofRecallatthecostof averyhighfalsealarmrate,above 90%,sincePrecisionislower than10%;percentagesprovidedaretheaveragevaluesof allpopulation.
ROCcurvesinFig.2showthat ocSVM1andocSVM2achievedthehighestvaluesofTPRforFPRbetween0% and20%; hereagain, percentagesaretheaveragevaluesofall users.ForvaluesofFPRhigherthan20%theperformanceofocSVM2 drasticallydrops.ThecurvesalsoshowthatocSVM2exhibitsthehigheststandarddeviation;hence,weperformedamore exhaustive analysis to study the particular performance of the algorithms for each user. Tables 4–6 show that ocSVM1 achievedthe best performance for mostof the test subjects (the best result by test subject isshown in bold typeface). Surprisingly, the optimization of ocSVM2 according to max(TPR+TNR) did not boost its performance, which leads us to believethatmultiobjectiveoptimizationcouldberequired.
Tofurther studythe differencesamong thealgorithms, we applied the Friedman test [8]and theBergmann-Hommel dynamicpost-hoc [12]. We comparedthe results considering a level ofsignificance
α
=0.05.We used Critical Difference diagrams(CDdiagrams)[8]toshowthepost-hocresultsbecauseCDdiagramscompactlypresenttherankofthealgorithm accordingtoone performanceindicator.CDdiagramsalsoshow themagnitudeofdifferencesbetweenalgorithmsandthe significance of the observed differences [8]. In a CD diagram, the rightmost algorithm is the best algorithm, while the algorithmssharingathick linehavestatisticallysimilar behaviours.CDdiagramsinFig.3showthat ocSVM1achievedthe bestaverageranking;however,thereisnosignificantdifferencecomparedwiththerestofthealgorithms formostofthe performanceindicators.Withregard toaccuracy, ocSVM2andocSVM1achievedthebestresultsandtheir performance is significantlybetterthantherestofthealgorithms.Table4
Area(inpercentage)underthecurveofTPRversusFPR.
Testsubject Parzen k-means1 k-means2 ocSVM1 ocSVM2 TS1 94.4 92.7 94.4 97.3 97.8 TS2 93.3 92.5 93.4 94.5 87.5 TS3 88.3 87.4 88.3 87.4 85.0 TS4 85.0 88.0 84.8 83.9 82.2 TS5 88.9 84.4 89.0 80.8 79.6 TS6 95.0 93.1 95.1 96.1 97.9 TS7 76.3 78.7 76.2 69.4 67.3 TS8 90.3 89.6 90.3 93.8 86.6 TS9 89.4 88.4 89.8 95.3 90.9 TS10 89.9 84.4 89.9 94.0 92.2 TS11 90.1 88.5 90.1 93.4 90.6 TS12 79.7 80.0 79.4 74.6 75.9 TS13 84.7 84.3 84.3 75.8 62.5 TS14 79.9 75.0 79.9 78.0 79.1 TS15 91.6 90.8 91.6 93.8 94.0 TS16 87.0 86.3 87.0 83.2 77.0 TS17 92.8 90.7 92.8 98.1 97.9 TS18 88.7 87.0 88.8 89.1 87.0 Table5
Equalaccuracyrate:thevalueofTPR(inpercentage)whenTPR=TNR. Testsubject Parzen k-means1 k-means2 ocSVM1 ocSVM2 TS1 86.1 82.2 86.0 91.7 94.3 TS2 85.4 84.3 85.5 85.6 83.8 TS3 81.5 79.2 81.3 78.8 78.9 TS4 80.6 81.8 80.4 75.5 76.2 TS5 83.2 75.5 83.6 70.7 72.0 TS6 86.0 83.6 86.2 88.7 93.9 TS7 70.9 71.4 70.5 64.7 62.2 TS8 80.2 80.1 80.2 85.3 78.3 TS9 79.7 77.7 80.3 90.0 86.2 TS10 80.6 73.7 80.6 87.8 84.3 TS11 81.3 77.2 81.4 83.8 84.4 TS12 71.3 69.3 71.1 66.8 70.5 TS13 74.8 75.1 74.6 66.9 56.1 TS14 72.9 68.2 73.1 72.5 72.4 TS15 82.6 81.3 82.6 86.3 87.9 TS16 76.1 75.5 76.2 74.9 70.1 TS17 87.3 83.2 87.4 94.7 93.7 TS18 80.0 76.9 80.5 82.4 82.2 Table6
Bestaccuracy(inpercentage)perclassifier.
Testsubject Parzen k-means1 k-means2 ocSVM1 ocSVM2 TS1 99.3 99.3 99.3 99.5 99.4 TS2 99.2 99.2 99.2 99.3 99.4 TS3 99.3 99.3 99.3 99.5 99.5 TS4 99.1 99.1 99.1 99.2 99.2 TS5 98.9 98.9 98.9 99.0 99.0 TS6 99.3 99.3 99.3 99.4 99.4 TS7 98.7 98.7 98.7 98.8 98.8 TS8 99.3 99.3 99.3 99.4 99.4 TS9 99.4 99.4 99.4 99.4 99.4 TS10 98.7 98.7 98.7 98.9 98.8 TS11 99.4 99.4 99.4 99.4 99.4 TS12 98.9 98.9 98.9 99.0 99.0 TS13 99.5 99.5 99.5 99.6 99.6 TS14 97.1 97.2 97.1 97.3 97.4 TS15 98.8 98.8 98.8 98.9 98.9 TS16 99.2 99.2 99.2 99.4 99.4 TS17 97.1 97.1 97.1 97.9 97.9 TS18 98.8 98.8 98.8 99.0 99.0
Fig.2. ROCcurvesbuiltfrommeanandstandarddeviationofallusers.
Fig.3. CDdiagramswiththestatisticalcomparisonsofSVM,Parzen,k-means1,andk-means2.
Theseresultsshowthatthereisplentyofroomforimprovement.Duetothelargeamountofdatathatisgeneratedper user,we planto furtherinvestigatethe suitabilityofDeep Learningapproaches [42,43]fordiscovering patternsthat best describetheusersandthenimprovetheclassificationprocess.
6. Conclusionsandfurtherwork
Our working hypothesis states that a risk-prone situation induces sudden and significant deviations in standard physiologicalandbehaviouraluserpatterns;thus,potentialthreatsituationscanbeautomaticallyidentified.
Inthisstudy, we introducedPRIDE (Personal RIsk DEtection),a publiclyavailable dataset that providesa baseline for thedevelopmentandthefaircomparisonofpersonalriskdetectionmechanisms.PRIDEincludespartialinformationabout
userbehaviouralandphysiologicalpatterns.Datafromtestsubjectswascollectedwhiletheycarriedoutordinarydailylife activities,andalsounderstressscenarios,therebysimulatingadangerousorabnormalcondition.
Next, we showed how to use PRIDE to develop a personal risk detection mechanismand found encouraging results: we run several experimentsthat support our hypothesis that abnormalbehaviour can be automatically detected using a one-classclassification approach.Toachieveourobjective,wetrainedseveralclassifiersbasedonlyonthedailybehaviour ofusers;thenwetestedtheiraccuracytodetectanomaliesthatwedidnotincludeinthetrainingprocess.
One-classSupportVectorMachinesachievedthebestperformanceandbestaveragerankingamongthetestedclassifiers formostofthe users.However,thereisstill roomforimprovement.Owingtothelarge amountofdatathatisgenerated pertestsubject,weplantofurtherinvestigatethesuitabilityofDeepLearningapproaches[42,43]todiscoverpatternsthat bestdescribeauseraimingatimprovingtheclassificationprocess.
Acknowledgements
WethankthemembersoftheGIEE-MLgroupatTecnologicodeMonterreyforprovidinginvaluable,usefulsuggestions andadviceonearlierversionsofthispaper.ThefirstauthorwassupportedbyCONACYTstudentscholarship515676.Special thankstoallvolunteersforthedatacollectionprocess,fromwhichPRIDEwasbuiltandbecauseofthiseffort, thedataset isnowavailable totheresearch community.Inaddition,wesincerelyappreciateMicrosoftfortheir supportanddonation ofwearablesensors.
Annex1. ThePRIDEdataset.Xandsofalltestsubjectfeatures.
Table7
Normalconditionsdataset.PartI.
No.ofrecords Gyroscopeaccelerometer Gyroscopeangularvelocity
Xaxis Yaxis Zaxis Xaxis Yaxis Zaxis
x(s) x(s) x(s) x(s) x(s) x(s) TS1 466,175 −0.066(0.479) 0.282(0.491) 0.312(0.573) 0.346(13.712) −0.644(9.379) −0.894(12.138) TS2 314,975 −0.060(0.493) −0.349(0.531) −0.201(0.551) −0.646(20.150) 0.837(15.469) −0.090(16.640) TS3 341,645 −0.079(0.439) −0.296(0.452) 0.493(0.508) −0.298(18.403) −0.120(12.021) 0.053(15.084) TS4 373,019 0.051(0.567) −0.347(0.424) 0.359(0.483) −0.702(16.034) −0.411(11.139) 0.174(12.828) TS5 296,270 −0.094(0.487) 0.321(0.473) 0.381(0.520) −0.711(18.799) 0.463(12.088) −0.398(14.399) TS6 328,976 −0.214(0.432) 0.359(0.435) 0.463(0.488) −0.606(14.530) −0.431(9.046) −0.062(11.104) TS7 288,386 0.024(0.519) −0.398(0.448) 0.318(0.512) −0.083(19.638) −0.254(13.010) −0.945(16.512) TS8 397,320 −0.128(0.543) 0.263(0.492) 0.387(0.471) −0.412(14.073) −0.157(8.302) −0.023(9.557) TS9 336,474 −0.190(0.511) −0.267(0.563) −0.149(0.541) 0.377(12.486) −0.671(10.083) −0.879(10.745) TS10 251,383 −0.123(0.493) 0.334(0.424) 0.566(0.360) −0.344(13.887) −0.079(9.187) −0.036(13.403) TS11 442,304 −0.032(0.412) −0.299(0.491) −0.262(0.640) −0.601(15.472) −0.287(10.329) 0.058(11.972) TS12 243,701 0.016(0.485) 0.265(0.432) 0.520(0.474) −0.735(19.527) 0.087(12.183) −0.373(14.832) TS13 431,496 0.019(0.451) −0.321(0.534) 0.225(0.598) −0.515(15.429) −0.253(10.246) 0.018(11.710) TS14 160,975 −0.082(0.498) 0.430(0.373) −0.276(0.582) 0.262(24.231) −0.861(15.893) −1.255(19.733) TS15 302,863 −0.178(0.448) 0.287(0.540) 0.220(0.588) −0.722(19.533) −0.382(14.578) 0.030(15.678) TS16 327,804 0.001(0.481) 0.379(0.430) −0.503(0.428) −0.832(18.842) −0.017(13.758) −0.002(16.473) TS17 133,795 −0.094(0.396) 0.168(0.628) −0.356(0.536) 0.259(11.996) −0.627(7.500) −0.948(9.317) TS18 335,424 −0.021(0.511) −0.376(0.492) −0.225(0.546) −0.725(12.759) 0.548(8.500) −0.170(11.065) Table8
Normalconditionsdataset.PartII.
Accelerometer Heartrate Skintemperature Pace
Xaxis Yaxis Zaxis
x(s) x(s) x(s) x(s) x(s) x(s) TS1 −0.066(0.479) 0.282(0.491) 0.312(0.573) 71.856(10.254) 33.553(1.300) 47.613(249.390) TS2 −0.059(0.493) −0.349(0.531) −0.201(0.551) 64.426(10.274) 32.821(1.412) 134.718(431.197) TS3 −0.079(0.439) −0.296(0.452) 0.493(0.508) 71.488(8.425) 31.885(1.789) 74.004(319.042) TS4 0.051(0.567) −0.347(0.424) 0.359(0.483) 68.335(10.309) 32.127(2.239) 49.351(271.310) TS5 −0.094(0.487) 0.321(0.473) 0.381(0.520) 68.911(9.593) 33.381(2.001) 65.316(301.010) TS6 −0.214(0.432) 0.359(0.435) 0.463(0.488) 66.160(11.398) 32.749(1.144) 49.332(248.829) TS7 0.024(0.519) −0.398(0.447) 0.318(0.512) 74.341(9.454) 33.184(3.004) 156.612(438.505) TS8 −0.128(0.543) 0.263(0.491) 0.387(0.471) 65.663(11.600) 31.970(1.880) 43.232(219.687) TS9 −0.190(0.511) −0.267(0.563) −0.149(0.541) 81.414(11.777) 34.166(1.571) 46.143(247.978) TS10 −0.123(0.493) 0.334(0.424) 0.566(0.360) 77.573(14.253) 32.970(1.239) 40.556(220.579) TS11 −0.032(0.412) −0.299(0.492) −0.262(0.640) 72.384(10.791) 34.237(1.426) 40.066(232.637) TS12 0.016(0.485) 0.265(0.432) 0.520(0.474) 71.344(9.123) 38.917(1.942) 65.041(296.546) TS13 0.019(0.451) −0.321(0.534) 0.225(0.598) 71.832(15.471) 31.981(2.379) 72.149(296.384) TS14 −0.082(0.498) 0.430(0.373) −0.276(0.582) 70.741(7.681) 32.512(1.615) 102.405(375.538) TS15 −0.178(0.448) 0.287(0.540) 0.220(0.588) 71.081(8.969) 32.926(2.354) 80.668(340.809) TS16 0.001(0.481) 0.379(0.430) −0.503(0.428) 73.199(10.221) 33.224(2.119) 84.804(339.817) TS17 −0.094(0.396) 0.168(0.628) −0.356(0.536) 61.294(11.812) 34.141(1.331) 70.054(325.963) TS18 −0.021(0.511) −0.376(0.492) −0.225(0.546) 73.254(10.305) 41.339(1.881) 69.961(284.993)
Table9
Normalconditionsdataset.PartIII.
Speed UV Pedometer Distance Calories
x(s) x(s) x(s) x(s) x(s) TS1 4.992(23.964) 0.022(0.148) 0.068(0.513) 5.277(40.239) 0.026(0.810) TS2 11.247(33.578) 0.020(0.183) 0.180(5.749) 14.001(449.963) 0.037(1.902) TS3 7.146(28.243) 0.036(0.203) 0.107(2.468) 8.187(183.953) 0.034(1.975) TS4 3.871(19.806) 0.035(0.184) 0.087(8.173) 6.946(653.910) 0.030(1.789) TS5 5.678(24.098) 0.038(0.203) 0.111(6.601) 8.859(527.082) 0.037(1.954) TS6 5.123(23.836) 0.020(0.138) 0.087(3.533) 6.788(308.571) 0.037(2.059) TS7 17.295(46.119) 0.034(0.206) 0.298(26.685) 24.777(2186.446) 0.042(1.936) TS8 5.117(24.167) 0.040(0.195) 0.088(4.579) 6.993(362.702) 0.034(1.597) TS9 4.311(21.449) 0.027(0.173) 0.068(1.205) 4.804(85.353) 0.022(0.797) TS10 5.343(26.415) 0.025(0.156) 0.101(6.972) 7.950(550.756) 0.046(3.286) TS11 3.477(18.744) 0.000(0.000) 0.057(0.659) 3.841(43.986) 0.024(0.807) TS12 5.966(25.317) 0.046(0.226) 0.105(5.378) 8.240(417.039) 0.040(2.834) TS13 9.248(35.681) 0.056(0.268) 0.253(80.693) 11.237(463.311) 0.042(1.507) TS14 8.549(29.013) 0.039(0.193) 0.320(31.097) 19.210(1361.480) 0.055(4.229) TS15 6.909(27.264) 0.022(0.183) 0.198(12.125) 15.908(970.020) 0.044(1.611) TS16 7.687(28.507) 0.011(0.105) 0.929(469.171) 8.790(208.055) 0.035(1.633) TS17 5.485(23.726) 0.004(0.060) 0.282(31.805) 22.152(2507.279) 0.062(5.433) TS18 8.582(31.890) 0.001(0.029) 0.120(2.264) 9.411(177.234) 0.035(2.723) Table10
Abnormalconditionsdataset.PartI.
No.ofrecords Gyroscopeaccelerometer Gyroscopeangularvelocity
Xaxis Yaxis Zaxis Xaxis Yaxis Zaxis
x(s) x(s) x(s) x(s) x(s) x(s) TS1 770 0.113(0.619) −0.679(0.414) 0.017(0.417) −0.846(40.900) −1.102(38.233) 0.524(33.024) TS2 608 0.384(0.501) −0.699(0.492) 0.114(0.642) 2.209(50.987) 2.188(31.660) −3.077(35.142) TS3 494 0.339(0.803) −0.655(0.673) 0.374(0.410) −12.002(59.791) −4.086(32.065) 2.214(33.438) TS4 708 0.431(0.609) −0.346(0.387) 0.324(0.489) −3.294(42.243) −2.153(34.449) 0.413(33.770) TS5 792 0.586(0.783) 0.532(0.525) 0.161(0.349) 2.098(29.158) −2.664(27.008) -0.408(38.388) TS6 674 0.457(0.669) 0.571(0.658) 0.560(0.446) 1.093(47.790) −1.054(32.493) 0.516(40.079) TS7 770 0.411(0.685) −0.635(0.606) 0.298(0.389) 1.095(41.332) 1.919(35.214) −2.004(42.678) TS8 724 0.580(0.838) 0.832(0.657) −0.214(0.617) 2.072(39.552) −10.207(39.374) −1.571(36.128) TS9 566 0.086(0.647) −0.399(0.556) 0.449(0.350) 2.317(40.801) −0.828(36.996) −5.515(42.064) TS10 767 0.299(0.517) 0.321(0.818) −0.023(0.532) 2.590(37.810) 1.085(25.954) −0.927(30.640) TS11 647 0.365(0.739) −0.236(0.626) 0.231(0.575) −2.795(45.353) 5.866(32.214) 3.660(49.090) TS12 679 0.740(0.716) 0.058(0.600) 0.454(0.466) −0.114(41.168) −1.030(35.996) −2.367(36.503) TS13 485 0.491(0.826) −0.549(0.526) 0.030(0.494) −0.647(41.101) −4.246(41.316) 2.940(41.405) TS14 1066 0.464(0.656) 0.491(0.502) 0.108(0.507) −5.939(40.240) 5.508(32.998) −1.785(33.435) TS15 881 0.245(0.593) 0.799(0.687) −0.095(0.430) 7.482(48.483) 2.926(37.574) −0.901(43.749) TS16 578 0.560(0.796) 0.809(0.667) −0.130(0.475) −7.245(39.853) 7.422(31.144) 0.075(37.856) TS17 941 0.194(0.525) 0.689(0.534) 0.295(0.501) 1.151(45.200) 0.685(25.359) −0.138(29.349) TS18 904 0.320(0.574) −0.656(0.339) 0.213(0.428) −0.638(38.582) 2.106(27.732) −3.557(33.302) Table11
Abnormalconditionsdataset.PartII.
Accelerometer Heartrate Skintemperature Pace
Xaxis Yaxis Zaxis
x(s) x(s) x(s) x(s) x(s) x(s) TS1 0.110(0.622) −0.680(0.411) 0.015(0.417) 97.097(22.148) 31.739(0.429) 258.291(371.325) TS2 0.395(0.482) −0.696(0.511) 0.156(0.670) 80.655(6.793) 29.113(1.196) 460.569(419.805) TS3 0.338(0.805) −0.655(0.667) 0.374(0.411) 87.263(17.918) 28.942(1.791) 287.767(418.495) TS4 0.431(0.611) −0.346(0.388) 0.324(0.491) 82.602(15.916) 28.941(1.645) 558.905(633.728) TS5 0.603(0.781) 0.538(0.528) 0.154(0.352) 81.412(11.368) 33.933(0.829) 339.201(542.872) TS6 0.457(0.668) 0.569(0.652) 0.555(0.450) 85.220(14.215) 29.616(0.402) 246.426(371.220) TS7 0.412(0.685) −0.635(0.605) 0.297(0.390) 76.544(6.768) 29.921(1.307) 393.745(574.313) TS8 0.579(0.837) 0.818(0.653) −0.215(0.615) 79.148(8.492) 28.358(0.921) 221.006(310.291) TS9 0.085(0.643) −0.399(0.555) 0.448(0.347) 79.936(12.531) 30.151(1.243) 160.900(259.476) TS10 0.298(0.518) 0.321(0.817) −0.023(0.532) 81.675(11.959) 30.589(1.417) 221.785(413.279) TS11 0.365(0.739) −0.236(0.625) 0.232(0.573) 86.611(20.806) 31.249(1.198) 206.471(305.513) TS12 0.746(0.740) 0.054(0.607) 0.446(0.482) 79.031(8.765) 39.856(1.977) 262.915(472.168) TS13 0.492(0.829) −0.550(0.528) 0.030(0.493) 79.563(8.671) 31.597(0.993) 230.324(435.552) TS14 0.466(0.661) 0.490(0.494) 0.102(0.501) 83.398(14.065) 31.157(0.984) 251.290(415.069) TS15 0.253(0.597) 0.799(0.673) −0.085(0.433) 79.748(11.037) 27.039(0.673) 330.247(538.912) TS16 0.564(0.799) 0.811(0.669) −0.131(0.475) 88.540(20.952) 33.407(0.918) 216.730(353.419) TS17 0.189(0.516) 0.690(0.533) 0.310(0.499) 81.963(16.540) 27.289(0.985) 120.472(243.084) TS18 0.320(0.573) −0.655(0.342) 0.213(0.428) 93.290(24.697) 37.815(2.559) 183.941(356.975)
Table12
Abnormalconditionsdataset.PartIII.
Speed UV Pedometer Distance Calories
x (s ) x (s ) x (s ) x (s ) x (s ) TS1 118.190(133.248) 0.118(0.323) 1.164(1.662) 123.790(178.250) 0.078(0.268) TS2 176.948(122.629) 0.523(0.500) 1.714(1.680) 176.194(181.270) 0.094(0.292) TS3 134.763(160.947) 0.223(0.516) 1.279(1.846) 142.591(229.427) 0.071(0.257) TS4 77.801(92.240) 0.097(0.297) 0.893(1.601) 82.054(159.729) 0.055(0.228) TS5 104.194(138.165) 0.665(0.472) 0.990(1.782) 105.869(190.114) 0.037(0.188) TS6 144.616(157.949) 0.405(0.491) 1.315(1.788) 151.721(210.877) 0.042(0.200) TS7 116.610(145.402) 0.553(0.832) 1.047(1.710) 121.081(203.444) 0.032(0.177) TS8 140.436(158.209) 0.394(0.489) 1.199(1.776) 141.738(221.937) 0.033(0.179) TS9 117.992(149.526) 0.498(0.500) 1.155(1.712) 127.212(193.314) 0.023(0.150) TS10 85.001(126.758) 0.248(0.432) 0.866(1.616) 95.557(180.922) 0.031(0.174) TS11 85.121(115.315) 0.233(0.423) 0.989(1.573) 94.414(152.147) 0.039(0.193) TS12 124.980(162.112) 0.236(0.492) 1.037(1.939) 125.973(235.163) 0.037(0.188) TS13 121.590(164.312) 0.243(0.598) 1.010(1.775) 128.878(238.527) 0.035(0.184) TS14 88.249(126.044) 0.067(0.249) 0.797(1.455) 86.081(170.038) 0.034(0.181) TS15 109.222(152.789) 0.314(0.465) 0.981(1.711) 114.547(205.342) 0.034(0.181) TS16 139.817(169.673) 0.351(0.478) 1.128(1.678) 141.412(222.837) 0.059(0.235) TS17 71.153(125.804) 0.000(0.000) 0.618(1.416) 72.259(169.026) 0.052(0.222) TS18 85.978(125.400) 0.198(0.399) 0.772(1.468) 86.354(168.715) 0.063(0.243) Supplementarymaterials
Supplementarydataassociatedwiththisarticlecanbefound,intheonlineversion,at10.1016/j.ins.2016.08.006. References
[1] A.Avci,S.Bosch,M.Marin-Perianu, R.Marin-Perianu,P.Havinga, Activityrecognition usinginertialsensing forhealthcare,wellbeingandsports applications:Asurvey,in:23rdInternationalConferenceonArchitectureofComputingSystems(ARCS),VDE,2010,pp.1–10.
[2] O.Banos,R.Garcia,J.A.Holgado-Terriza,M.Damas,H.Pomares,I.Rojas,A.Saez,C.Villalonga,mhealthdroid:anovelframeworkforagiledevelopment ofmobilehealthapplications,in:AmbientAssistedLivingandDailyActivities,LectureNotesinComputerScience,vol.8868,SpringerInternational Publishing,2014,pp.91–98,doi:10.1007/978-3-319-13105-4_14.
[3] J.S.Beaudin,S.S.Intille,E.M.Tapia,R.Rockinson,M.E.Morris,Context-sensitivemicrolearningofforeignlanguagevocabularyonamobiledevice,in: AmbientIntelligence,LectureNotesinComputerScience,vol.4794,SpringerBerlinHeidelberg,2007,pp.55–72,doi:10.1007/978-3-540-76652-0_4.
[4] B.Burton,M.J.Walker,HypeCycleforEmergingTechnologies,2015,ResearchNoteG00289755,Gartner,2015.
[5] C.-C.Chang,C.-J.Lin,Libsvm:alibraryforsupportvectormachines,ACMTrans.Intell.Syst.Technol.2(3)(2011)1–27,doi:10.1145/1961189.1961199.
[6] L.Chen,J.Hoey,C.D.Nugent,D.J.Cook,Z.Yu,Sensor-basedactivityrecognition,IEEETrans.Syst.ManCybern.PartC(Appl.Rev.)42(2012)790–808, doi:10.1109/TSMCC.2012.2198883.
[7] X.Chen,C.Ho,E.Lim,T.Kyaw,Cellularphonebasedonlineecgprocessingforambulatoryandcontinuousdetection,in:ComputersinCardiology,vol. 34,IEEE,2007,pp.653–656,doi:10.1109/CIC.2007.4745570.
[8] J.Demšar,Statisticalcomparisonsofclassifiersovermultipledatasets,J.Mach.Learn.Res.7(2006)1–30.
[9] R.O.Duda,P.E.Hart,D.G.Stork,PatternClassification,seconded.,Wiley-Interscience,2001.
[10] A.S.Evani,B.Sreenivasan,J.S.Sudesh,M.Prakash,J.Bapat,Activityrecognitionusingwearablesensorsforhealthcare,in:SENSORCOMM2013:The SeventhInternationalConferenceonSensorTechnologiesandApplications,IARIA,2013,pp.173–177.
[11] T.Fawcett,AnintroductiontoROCanalysis,PatternRecognit.Lett.27(8)(2006)861–874,doi:10.1016/j.patrec.2005.10.010.
[12] S.García,F.Herrera,Anextensionon“statisticalcomparisonsofclassifiersovermultipledatasets” forallpairwisecomparisons,J.Mach. Learn. Research9(2008)2677–2694.
[13] G.Giacinto,R.Perdisci,M.D.Rio,F.Roli,Intrusiondetectionincomputernetworksbyamodularensembleofone-classclassifiers,Inf.Fusion9(2008) 69–82.SpecialIssueonApplicationsofEnsembleMethods,doi:10.1016/j.inffus.2006.10.002.
[14] T.Hu`ynh,M.Fritz,B.Schiele,Discoveryofactivitypatternsusingtopicmodels,in:Proceedingsofthe10thInternationalConferenceonUbiquitous Computing,UbiComp’08,ACM,2008,pp.10–19,doi:10.1145/1409635.1409638.
[15] S.S.Intille,K.Larson,E.M.Tapia,J.S.Beaudin,P.Kaushik,J.Nawyn,R.Rockinson,Usingalive-inlaboratoryforubiquitouscomputingresearch,in: PervasiveComputing,LectureNotesinComputerScience,vol.3968,SpringerBerlinHeidelberg,2006,pp.349–365,doi:10.1007/11748625_22.
[16] Z.Jin,J.Oresko,S.Huang,A.C.Cheng,Hearttogo:apersonalizedmedicinetechnologyforcardiovasculardiseasepreventionanddetection,in:Life ScienceSystemsandApplicationsWorkshop,2009.LiSSA2009.IEEE/NIH,IEEE,2009,pp.80–83,doi:10.1109/LISSA.2009.4906714.
[17] S.S.Khan,M.G.Madden,One-classclassification:taxonomyofstudyandreviewoftechniques,Knowl.Eng.Rev.29(03)(2014)345–374,doi:10.1017/ S026988891300043X.
[18] W.Z.Khan,Y.Xiang,M.Y.Aalsalem,Q.Arshad,Mobilephonesensingsystems:asurvey,IEEECommun.Surv.Tut.15(2013)402–427,doi:10.1109/SURV. 2012.031412.00077.
[19] P.Koenig,L.Elsler,S.Binder,SmartWearableHealthcareReport2014,ResearchReport,SoreonResearch,2014.
[20] M.A.Labrador,O.D.L.Yejas,HumanActivityRecognitionUsingWearableSensorsandSmartphones,Chapman&Hall/CRCComputerandInformation ScienceSeries,CRCPress,2013.
[21]G.Lamprinakos,S.Asanin,T.Broden,A.Prestileo,J.Fursse,K.Papadopoulos,D.Kaklamani,I.Venieris,Anintegratedremote monitoringplatform towardstelehealthandtelecareservicesinteroperability,Inf.Sci.308(2015)23–37,doi:10.1016/j.ins.2015.02.032.
[22] O.D.Lara,M.A.Labrador,Asurveyonhumanactivityrecognitionusingwearablesensors,IEEECommun.Surv.Tut.15(3)(2012)1192–1209,doi:10. 1109/SURV.2012.110112.00192.
[23] L.Liu,Y.Peng,S.Wang,M.Liu,Z.Huang,Complexactivityrecognitionusingtimeseriespatterndictionarylearnedfromubiquitoussensors,Inf.Sci. 340(2016)41–57,doi:10.1016/j.ins.2016.01.020.
[24] B.Logan,J.Healey,M.Philipose,E.M.Tapia,S.Intille,Along-termevaluationofsensingmodalitiesforactivityrecognition,in:Proceedingsofthe9th InternationalConferenceonUbiquitousComputing,in:UbiComp’07,vol.LNCS4717,Springer-VerlagBerlin,2007,pp.483–500.
[26]Microsoft,Microsoftbandsdkdocumentation,2015(MicrosoftBandforDevelopersOfficialSite),URLhttps://developer.microsoftband.com/bandSDK. [27]S.C.Mukhopadhyay,Wearablesensorsforhumanactivitymonitoring:areview,IEEESensorsJ.15(2015)1321–1330,doi:10.1109/JSEN.2014.2370945.
[28]N.Oliver,F.Flores-Mangas,Healthgear:automaticsleepapneadetectionandmonitoringwithamobilephone,J.Commun.2(2)(2007)1–9,doi:10. 4304/jcm.2.2.1-9.
[29]J.Pärkkä,M.Ermes,P.Korpipää,J.Mäntyjärvi,J.Peltola,I.Korhonen,Activityclassificationusingrealisticdatafromwearablesensors,IEEETrans.Inf. Technol.Biomed.10(2006)119–128,doi:10.1109/TITB.2005.856863.
[30]S.Patel,H.Park,P.Bonato,L.Chan,M.Rodgers,Areviewofwearablesensorsandsystemswithapplicationinrehabilitation,J.NeuroEng.Rehabil.9 (1)(2012)9–21,doi:10.1186/1743-0003-9-21.
[31] M.Philipose,J.R.Smith,B.Jiang,A.Mamishev,S.Roy,K.Sundara-Rajan,Battery-freewirelessidentificationandsensing,IEEEPervasiveComput.4(1) (2005)37–45,doi:10.1109/MPRV.2005.7.
[32]M.A.Pimentel,D.A.Clifton,L.Clifton,L.Tarassenko,Areviewofnoveltydetection,SignalProcess.99(2014)215–249,doi:10.1016/j.sigpro.2013.12.026.
[33]J.A.Quinn,C.K.Williams,N.McIntosh,Factorialswitchinglineardynamicalsystemsappliedtophysiologicalconditionmonitoring,IEEETrans.Pattern Anal.Mach.Intell.31(2009)1537–1551,doi:10.1109/TPAMI.2008.191.
[34]D.Roggen,A.Calatroni,M.R.T.Holleczek,K.Föster,P.L.GerhardTröster,D.Bannach,A.F.GeraldPirkl,J.Doppler,C.Holzmann,M.Kurz,R.C.Gerald Holl,H.Sagha,H.Bayati,M.Creatura,J.delR.Millàn,Collectingcomplexactivitydatasetsinhighlyrichnetworkedsensorenvironments,in:Seventh InternationalConferenceonNetworkedSensingSystems(INSS),IEEE,2010,pp.233–240,doi:10.1109/INSS.2010.5573462.
[35]N.Selvaraj,Long-termremotemonitoringofvitalsignsusingawirelesspatchsensor,in:HealthInnovationsandPoint-of-CareTechnologies Confer-ence,HealthcareInnovationConference(HIC),IEEE,2014,pp.83–86,doi:10.1109/HIC.2014.7038880.
[36]M.Shoaib,S.Bosch,O.D.Incel,H.Scholten,P.J.Havinga,Asurveyofonlineactivityrecognitionusingmobilephones,Sensors15(1)(2015)2059–2085.
SpecialIssueHCIInSmartEnvironments,doi:10.3390/s150102059.
[37]M.Stikic,D.Larlus,S.Ebert,B.Schiele,Weaklysupervisedrecognitionofdailylifeactivitieswithwearablesensors,IEEETrans.PatternAnal.Mach. Intell.33(2011)2521–2537,doi:10.1109/TPAMI.2011.36.
[38]E.M.Tapia,S.S.Intille,L.Lopez,K.Larson,Thedesignofaportablekitofwirelesssensorsfornaturalisticdatacollection,in:PervasiveComputing,in: LectureNotesinComputerScience,vol.3968,SpringerBerlinHeidelberg,2006,pp.117–134,doi:10.1007/11748625_8.
[39]D.M.J.Tax,R.P.W.Duin,Combiningone-classclassifiers,in:MultipleClassifierSystems,vol.2096, SpringerBerlinHeidelberg,2001,pp.299–308, doi:10.1007/3-540-48219-9_30.
[40]L.A.Trejo,E.Sanchez,R.Alonso,J.Vazquez,J.Cardona,Elisa:emergency,positioning,andimmediateassistancesystem,in:C.daRocha(Ed.),XSafety, HealthandEnvironmentalWorldCongressConvergingTowardsSustainability(SHEWC),ClaudiodaRochaandMelaniM.Ciampi,2010,p.26.
[41] V.N.Vapnik,StatisticalLearningTheory,vol.1,firsted.,Wiley-Interscience,1998.
[42]P.Vepakomma,D.De,S.K.Das,S.Bhansali,A-wristocracy:Deeplearningonwrist-wornsensingforrecognitionofusercomplexactivities,in:The12th InternationalConferenceonWearableandImplantableBodySensorNetworks(IEEEBSN2015),IEEE,2015,pp.1–6,doi:10.1109/BSN.2015.7299406.
[43]L.Wang,Recognitionofhumanactivitiesusingcontinuousautoencoderswithwearablesensors,Sensors16(2016)189–208,doi:10.3390/s16020189.
[44]C.R.Wren,E.M.Tapia,Towardscalableactivityrecognitionforsensornetworks,in:Location-andContext-Awareness,LectureNotesinComputer Sci-ence,vol.3987,SpringerBerlinHeidelberg,2006,pp.168–185,doi:10.1007/11752967_12.
AriYairBarreraAnimasisaPh.D.studentinComputerScienceatTecnólogicodeMonterrey,CampusEstadodeMéxico.His thesisworkisfocusedinmultisensordatafusionsystemsandtechniques.HeisamemberoftheGIEE-ML(MachineLearning) researchgroupatTecnólogicodeMonterrey.Hisresearchinterestsareconcentratedondatafusionmodels,patternrecognition, datamining,machinelearning,one-classclassification,physiologicalconditionmonitoring,wearablesensors,andcomputer secu-rity.HeobtainedthedegreeinComputerSystemsEngineeringin2012fromInstitutoTecnológicodePachuca.
LuisA.TrejoobtainedaPh.D.inComputerScience(ParallelProcessing)in1993fromUniversité Claude-BernarddeLyon,France. Heisafull-timeProfessorattheSchoolofScienceandEngineering,fromTecnólogicodeMonterrey.Since2015,heisamember ofCONACyT’sNationalResearchSystem,Level1,andamemberoftheGIEE-ML(MachineLearning)researchgroupat Tecnó-logicodeMonterrey.Histopicsofinterestareinternetworking,InternetofThings,informationsecurity,intrusiondetectionand preventionsystems,machinelearning,datascience,andparallelprocessing.
MiguelAngelMedina-PérezgraduatedinInformaticsEngineeringfromUniversityofCiegodeÁvila,Cuba,in2007andreceived hisM.Sc.degreeinAppliedInformaticsfromthesameuniversityin2007.HereceivedhisPh.D.inComputerSciencein2014 fromNationalInstituteofAstrophysics,OpticsandElectronics,Mexico.Currently,heisaResearchProfessoratTecnólogicode Monterrey,CampusEstadodeMéxico,whereheisalsoamemberoftheGIEE-ML(MachineLearning)researchgroup.His re-searchinterestsincludesupervisedclassification,clustering,dataminingandknowledgediscovery,featureselection,one-class classification,masqueraderdetection,fingerprintrecognition,andpalmprintrecognition.
RaúlMonroyobtainedaPh.D.inArtificialIntelligencein1998fromEdinburghUniversity,underthesupervisionofProf.Alan Bundy.Heisa(full)ProfessorinComputingatTecnólogicodeMonterrey,CampusEstadodeMéxico.Since1998heisamember ofCONACyT’sNationalResearchSystem,currentlyrank2.HeistheleaderoftheGIEE-ML(MachineLearning)researchgroupat TecnólogicodeMonterrey.Dr.Monroy’sresearchisconcernedwiththediscoveryandapplicationofgeneralsearchcontrol strate-giesforuncoveringandcorrectingerrorsineitherasystemoritsspecification;fordetectinganomaliesendangeringinformation security;andforplanningrobotmotion.
J.BenitoCamiñaobtainedaPh.D.degreeinComputerSciencein2015fromTecnólogicodeMonterrey,CampusEstadode Méx-ico,underthesupervisionofProf.RaúlMonroy.Currently,heisamemberoftheGIEE-ML(MachineLearning)researchgroup. Camiña’sresearchisconcernedwiththeuseofMachineLearningtechniquesformasqueradedetection.
FernandoGodínezstudiedElectronicSystemsEngineering(ISE)atTecnólogicodeMonterrey,CampusEstadodeMéxico,classof 1999.HeobtainedaPh.D.inArtificialIntelligencefromTecnólogicodeMonterrey,CampusMonterrey,classof2005.Dr.Godínez startedonMicrosofton2006intheDataMiningteam(partoftheSQLServerorganization)asasoftwaredeveloperengineer.He workedonExcelservicesfor2yearsthenonAnalysisServicesandmovedtotheXboxaccessoriesgroupon2011;theteamlater becametheMicrosoftBandteam.Currently,heisasoftwareengineermanageronMicrosoftHealthleadingtheDataAnalytics andExchangeteam.