is an open access repository that collects the work of Arts et Métiers ParisTech
researchers and makes it freely available over the web where possible.
This is an author-deposited version published in: https://sam.ensam.eu Handle ID: .http://hdl.handle.net/10985/15039
To cite this version :
Hanan HINDY, David BROSSET, Ethan BAYNE, Amar SEEAM, Xavier BELLEKENS - Improving SIEM for Critical SCADA Water Infrastructures Using Machine Learning - 2019
Any correspondence concerning this service should be sent to the repository Administrator : [email protected]
Infrastructures Using Machine Learning
Hanan Hindy1, David Brosset2, Ethan Bayne1,Amar Seeam3, and Xavier Bellekens1 1
Division of Cyber Security, Abertay University, Dundee, Scotland, UK {1704847,e.bayne,x.bellekens}@abertay.ac.uk
2
Naval Academy Research Institute, France
3
Department of Computer Science, Middlesex University, Mauritius
Abstract. Network Control Systems (NAC) have been used in many industrial processes. They aim to reduce the human factor burden and efficiently handle the complex process and communication of those sys-tems. Supervisory control and data acquisition (SCADA) systems are used in industrial, infrastructure and facility processes (e.g. manufac-turing, fabrication, oil and water pipelines, building ventilation, etc.) Like other Internet of Things (IoT) implementations, SCADA systems are vulnerable to cyber-attacks, therefore, a robust anomaly detection is a major requirement. However, having an accurate anomaly detection system is not an easy task, due to the difficulty to differentiate between cyber-attacks and system internal failures (e.g. hardware failures). In this paper, we present a model that detects anomaly events in a water sys-tem controlled by SCADA. Six Machine Learning techniques have been used in building and evaluating the model. The model classifies different anomaly events including hardware failures (e.g. sensor failures), sabo-tage and cyber-attacks (e.g. DoS and Spoofing). Unlike other detection systems, our proposed work helps in accelerating the mitigation process by notifying the operator with additional information when an anomaly occurs. This additional information includes the probability and confi-dence level of event(s) occurring. The model is trained and tested using a real-world dataset.
Keywords: Cyber-Physical Systems · Machine Learning · SCADA · SIEM
1
Introduction
An increasing number of networked control systems are being deployed for the monitoring, control and response of physical infrastructure. Deprecated infras-tructure is being replaced by SCADA systems that are compatible with IoT
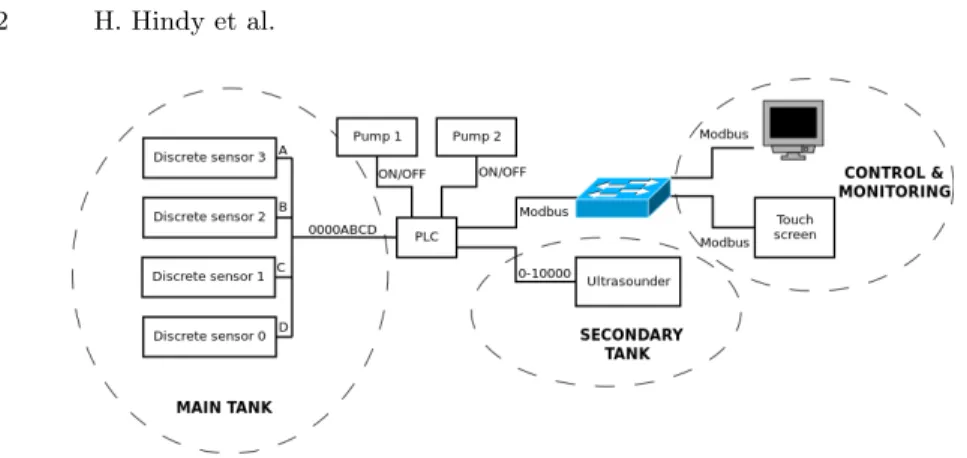
Fig. 1: Network Architecture
devices, enabling remote monitoring and control of previously isolated systems. Through this upgrade, industries are able to achieve higher reliability and flexi-bility of deployed systems. However, by enabling external internet access, indus-tries are introducing the increased risk of cyber-attacks to potentially critical infrastructure [28].
Vulnerabilities in critical infrastructure protection (CIP) is due to five factors. The first is the lack of open protocols. Current programmable logic controllers (PLCs) are often controlled through proprietary network protocols that have not been scrutinized by security professionals and act as a black box, hence increasing the attack surface [9]. The second is due to the lack of segmentation
in network infrastructure [17]. Current PLCs are connected to control networks for the data to be analysed in real time by higher management. Whilst this may increase profit margins and decrease the reaction time to market changes, the lack of segmentation allows for transversal network attacks. The third one is due to the number of off-the-shelf equipment being set up in the network [8]. By including off-the-shelf hardware, the attack surface increases, and introduces other potentially weak links (i.e. Entry points). The fourth one is due to the
lack of training received by the operators and the inability of the operator to distinguish between incidents and cyber-attacks [6, 2]. Finally, the fifth one is due to the exponential growth of organized cyber-crime and nation state-sponsored cyber-warfare to destabilize countries [16, 27].
Critical infrastructure network Security is intrinsically different from com-puter networks as the interaction between the nodes is done in real time at a physical level. Threats affecting computer networks and their associated intru-sion detection systems (IDS) are discussed in [14, 13]. Numerous efforts have been made to apply current cyber-security solutions to CIP networks, however, the solutions proposed are often not suited for the infrastructure and do not con-sider the underlying risks posed by compromised sensor data [12]. As a results, despite the advances made in the design and implementation of cyber-security solutions, there is little research being made with the goal of improving SIEM and increase the resilience of CIP against cyber-incidents. In recent years, the number of attacks against critical infrastructure has significantly increased. The
Stuxnet malware is an example of a high-profile SCADA attack, which was first discovered in an Iranian power plant in 2010. Stuxnet was used to infect and reprogramme the PLCs while hiding the changes made using a custom-made PLC rootkit [19]. Another example is the Maroochy attack against a sewage system, causing 800.000L of sewer waste to be released in waterways and parks. The Maroochy attack was perpetrated by an insider, taking advantage of in-secure communication between the pumping station and the central SCADA control system [7]. The Ukrainian power grid attack is another example of a large SCADA attack, where 225,000 people were affected by the loss of power. The attacker managed to switch off 30 substations for over 6 hours. In total, over 74 MWh of electricity was not supplied to the energy grid, representing a total of 0.015% of the daily electricity consumption of the country. The attack was later attributed to ”Sandworm”, a Russian group of hackers known for ad-vanced persistent threats [22]. These attacks demonstrate that when attacking a CIP, attackers often study the system extensively to perpetrate the attack as stealthily as possible, tailoring their strategies towards the particular system.
In this manuscript, we aim at improving Security Information and Event Management (SIEM) for critical infrastructure using machine learning to identify patterns in the data reported by PLCs in a water system controlled by SCADA. The contributions of this paper are as follows:
– We provide a new SIEM methodology that leverage sensor data and the event-driven nature of cyber-physical systems.
– We categorize the attacks in 14 categories, based on the data emerging from the dataset. Out prototype features 3 experiments using machine learning algorithms for the detection of the said anomalies.
– We propose the usage of probabilistic model to decrease the mitigation time. – We conduct a thorough evaluation of SIEM performances through a op-erational scenarios in the third experiment. The two best predictions are proposed to the operator allowing him to alleviate cyber-attacks when an event is detected. The anomaly detection provides an accuracy of 95.64% with an 85% confidence.
The remainder of this paper is organized as follows; Section 2 discusses equip-ment used to generate the dataset. Section 3 provides an overview of the dataset, the scenarios and the features, while Section 4 presents the results obtained by applying machine learning technique to differentiate between different scenarios. Section 5 discusses the results and limitations discovered. Section 6 presents re-lated work in this field. The paper ends by concluding our findings in Section 7.
2
Experimental Set-up
In this section we describe the architecture of SCADA controlled critical in-frastructure (CI) used to gather the dataset described in Section 3. Current CI systems are interconnected and are increasingly prone to faulty operations and
cyber-attacks. Risks present are caused by the fragmentation of technology in-corporated into the CI, vulnerabilities within hardware and software components and through physical tampering of equipment by malicious actors. The design of the CI presented in this research represents a real world, real-time system that is capable of working under normal and abnormal conditions. Additionally, the presented system can be exposed to the aforementioned vulnerabilities.
Figure 1 provides a high level overview of the network of the system. The system is composed of two tanks— the main tank and a secondary tank. Each tank can contain either fuel or water and can be set to two distinct modes— acting either as a distributor or as storage. The main and secondary tank has a capacity of 9 and 7 litres respectively. The main tank is composed of four sensors connected to a PLC. The sensors are then connected to both Pump1 and Pump2. Both pumps control the flow of water between the main tank and the secondary tank. The main tank utilizes the four sensors to measure the level of liquid, whilst the secondary tank monitors fluid volume with an ultrasound sensor. Data gathered from the sensors are transferred to the control and monitoring network using the Modbus protocol.
2.1 Modbus Protocol
The Modbus protocol operates at the application layer of the open systems in-terconnection (OSI) model. It enables communication between interconnected network nodes based on a request and reply methodology. The protocol requires little processing overhead, which makes it a sensible candidate for communica-tions between PLCs, Sensors, or Remote Terminal Units (RTUs).
The Modbus protocol works independently of protocols implemented in other layers of the OSI model, hence, it can be used both on routable network or used for serial communications [15].
The data being stored by the Modbus protocol in slave devices can be cate-gorized in four different ways as listed below:
– Discrete InputRead-Only Access, it provides Physical I/O – Input Register Read-Only Access, it provides Physical I/O – Holding RegisterRead-Only Access, it provides Read-Write Data – CoilRead-Write Access, it provides application data
Each table can contain up to 9,999 values, however, some devices can allow up to 65,536 addresses across all tables. Each vendor has its own specification of the Modbus data tables, and the set-up often requires the operator to read the vendor-specific documentation.
2.2 Sensors and PLC
As shown in Figure 1 the system is composed of a single PLC. The PLC is a compact Base Twido PLC, with 40 discrete I/O, 24 discrete inputs, and 14 relays. The system is also composed of a Modicon M238 logic controller. The
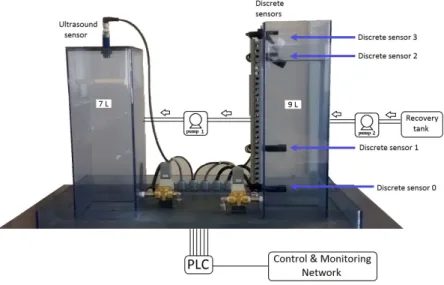
Fig. 2: System Architecture
system can be sent instructions through the touch screen or via a remote system connected to the network.
The system is also composed of five sensors as shown in Figure 1 . Four discrete level sensors are located in the main tank. The first sensor (S0) indicates a low level in the tank (1.25L), the second sensor (S1) indicates a measure of less than 3.35L, the third sensor (S2), indicates a level of 8L while the last sensor (S3) indicates a full tank measure (9L).
The secondary tank is fitted with a single ultrasound sensor. The ultrasound sensor is a Schneider-Electric cylindrical M18 ultrasonic sensor. The sensor is fitted at the top of the tank and is used to measure the distance of the liquid surface to the top of the tank. The sensor can also be used to detect the presence or absence of liquid in the tank.
2.3 Operation Mode
The system is controlled automatically through the PLC to avoid the spillage of liquid stored in tanks. Figure 2 illustrates the physical system. For the purpose of this research, the primary tank is filled from a recovery tank, however, the recovery tank in our system can be substituted by other liquid source, such as a river, a fuel line, etc.
Once the primary tank is filled from the recovery tank using pump2, the PLC activates Pump1 to transfer liquid to the secondary tank to avoid spillage.
To simulate a constant liquid consumption from the tanks, valves at the bottom of both the primary and the secondary tanks can be opened. The PLC monitors tank volumes by reading all sensor data registers at 0.1 second intervals.
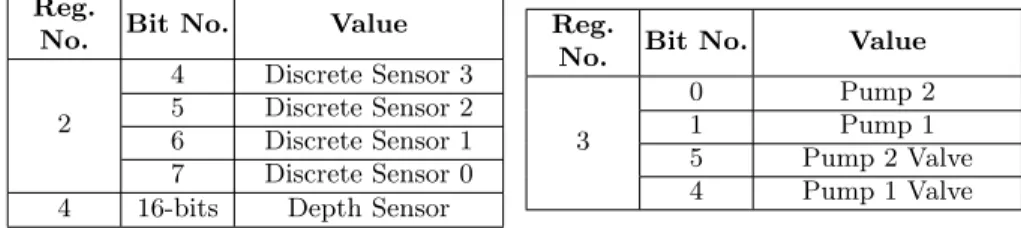
Table 1: Registers Extracted Bits Representation Reg.
No. Bit No. Value
2
4 Discrete Sensor 3 5 Discrete Sensor 2 6 Discrete Sensor 1 7 Discrete Sensor 0 4 16-bits Depth Sensor
Reg.
No. Bit No. Value
3
0 Pump 2
1 Pump 1
5 Pump 2 Valve 4 Pump 1 Valve
The PLC will automatically refuel the primary tank using Pump 2 when the volume of liquid goes below 1.25L. Similarly, Pump2 will be instructed to stop when a total volume of 9L is reached. The secondary tank will be refuelled when ultrasound sensors detect the liquid level to be below 2.1L. Furthermore, the PLC will only deactivate pump 1 once the ultrasound sensor detects that the secondary tank has reached a level of 6.3L.
3
Dataset
This section describes the dataset gathered by the IC and the scenarios recorded. The dataset used in this manuscript has been published separately in a dataset publication [21].
The CI presented in section 2 was used to gather data for the dataset and outputted into CSV format. The dataset comprises actuator and sensor readings that the PLC recorded periodically at 0.1 second intervals. Within the data collected, PLC registers 2 through 4 provided output data describing the state of the system that was used for analysis.
Table 1 provides an overview of the different registers used by the PLC. As shown, Register 2, provides the bits indicating the binary state of the discrete sensors. A population count can be done on the register to retrieve the state of each sensor separately. Register 3 contains the state of the pump, either as active or inactive, while Register 4 contains the step value from 0 to 10,000 of the ultrasound sensors (e.g. Step 3,000 represents 2.1L of liquid in the tank).
3.1 Scenarios
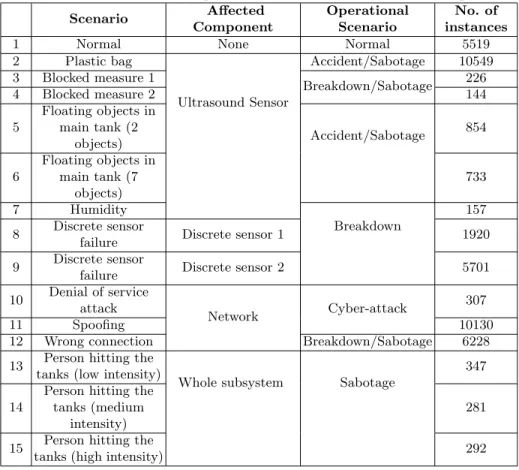
The dataset consists of 14 different scenarios as shown in Table 2. Each scenario covers one of 5 operational scenarios representing the potential threat (i.e. sab-otage, accident, breakdown, or cyber-attack) as well as 6 affected components. The affected components are system components that are directly affected by the anomaly.
The recorded data is organized in 15 different CSV files of variable duration based on the type of incident recorded (i.e. a sabotage incident may take less time than a distributed denial of service).
Table 2: Dataset Scenarios, Operational Scenarios and Affected Components Scenario Affected Component Operational Scenario No. of instances
1 Normal None Normal 5519
2 Plastic bag Ultrasound Sensor Accident/Sabotage 10549 3 Blocked measure 1 Breakdown/Sabotage 226 4 Blocked measure 2 144 5 Floating objects in main tank (2 objects) Accident/Sabotage 854 6 Floating objects in main tank (7 objects) 733 7 Humidity Breakdown 157 8 Discrete sensor
failure Discrete sensor 1 1920
9 Discrete sensor
failure Discrete sensor 2 5701
10 Denial of service attack
Network Cyber-attack
307
11 Spoofing 10130
12 Wrong connection Breakdown/Sabotage 6228 13 Person hitting the
tanks (low intensity)
Whole subsystem Sabotage
347
14
Person hitting the tanks (medium
intensity)
281
15 Person hitting the
tanks (high intensity) 292
3.2 Pre-processing
This subsection highlights the processing of the data obtained. The pre-processing is composed of six steps.
1. Extract Instances
Firstly, each scenario instances are extracted from the log file. An instance is represented by the recording of the register values at a specific time. Each log file has 10 rows per instance. Each row contains The Date, Time, the Register Number, and the Register Value of the PLC.
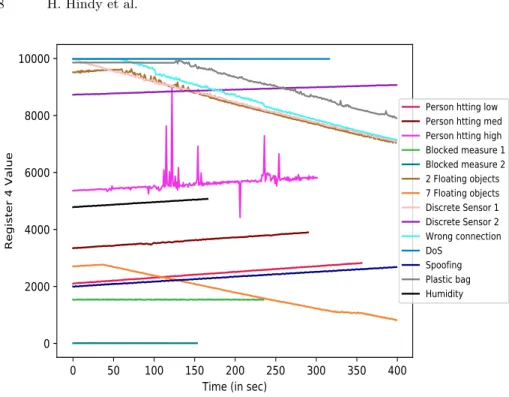
2. Calculate rate of change of Register 4
The value of Register 4 is the most significant. However, the significance is not in its single value but in how the value changes over time. This significance can be formulated in the rate of change over time. Figure 3 shows the rate change in Register 4 value over 15 different scenarios.
0
50
100 150 200 250 300 350 400
Time (in sec)
0
2000
4000
6000
8000
10000
Register 4 Value
Person htting low Person htting med Person htting high Blocked measure 1 Blocked measure 2 2 Floating objects 7 Floating objects Discrete Sensor 1 Discrete Sensor 2 Wrong connection DoS Spoofing Plastic bag Humidity
Fig. 3: Rate of change of register 4 value over different scenarios
For each instances, the rate of change is calculated over 10 time frames as expressed in Equation 1. Rate of changei= reg4i−reg4i−10 timei−timei−10 (1) 3. Apply Threshold
Table 2 shows the number of recorded instances per scenario. As shown in the table, the events are not statistically distributed over the scenarios. Therefore, the most instances scenario will bias the classification model output. A threshold is applied to take only the first N instances of each file.N should satisfy two conditions a) reduce the gap between instances count per scenario, b) keep the variation of instances count per scenario.
4. Serialization
A single file is needed for the training process. All Instances are, therefore, serialized.
5. Normalization 6. Split
Finally, the data is normalized and split into 80% training and 20% testing sets.
4
Experiments and Results
This section outlines three experiments conducted and how accurately threats could be identified. Note that the code (pre-processing and experiments) is avail-able in a Github repository1.
The aim of the experiments is to alert, and provide the operator with the most likely affected components, in order to decrease the time to apply the corrective action.
Six machine learning techniques are used for the classification models, namely, Logistic Regression (LR) Gaussian Na¨ıve Bayes (NB) , k-Nearest Neighbours (k-NN) , Support Vector Machine (SVM) , Decision Trees (DT) and Random Forests (RF) [29] [18] [23] [26] [20] [5].
4.1 Parameters
All experiments are conducted using the following computation parameters: – Training Set : Testing Set = 80% : 20%
– Evaluation: The overall accuracy is calculated as follows:
OverallAccuracy= T P +T N
T P+T N+F P +F N
Where:
• True Positive (TP): Number of anomaly instances which scenario is cor-rectly detected
• True Negative (TN): Number of normal instances which are correctly detected
• False Positive (FP): Number of normal instances which are detected as one of the anomaly scenarios
• False Negative (FN): Number of anomaly instances which are detected as normal scenarios
4.2 First Experiment
The aim of the first experiment is to alert the user when an anomaly occurs without specifying the associated scenario. The aim is to provide the operator of the CI with a binary output.
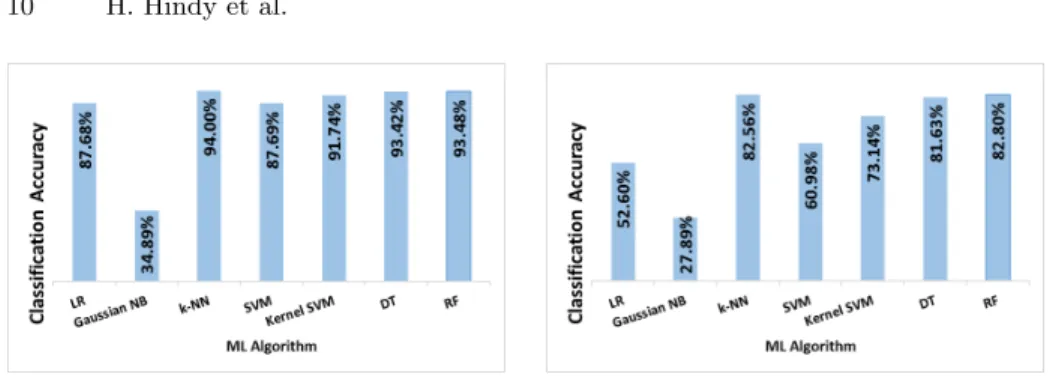
Figure 4 shows the classification results of the six machine learning algo-rithms applied to data. The algoalgo-rithms provide a binary output. As shown, the highest accuracies reached are 93.42%, 93.48% and 94% using DT, RF and k-NN respectively.
Providing an alert that an anomaly exists in the data recorded by the sensors is considered important, however, as the alert is provided in a binary fashion, the operator is – in this case – unable to identify the anomaly at first sight and take corrective action. To this end, a second experiment was established with the aim of proving more information to the operator.
1
https://github.com/AbertayMachineLearningGroup/machine-learning-SIEM-water-infrastructure
Fig. 4: Anomaly Classification Accu-racy
Fig. 5: Affected Component Classification Accuracy
Fig. 6: Scenarios Classification Ac-curacy. Trial One (Single scenario reported)
Fig. 7: Scenarios Classification Ac-curacy (Alerting with two probable scenarios)
4.3 Second Experiment
The second experiment aims at giving the operator capital information about the anomaly. The alert in this case includes the affected component. The model classifies what components are affected by the five components present in the CI (i.e. Network, Discrete Sensor 1, Discrete Sensor 2, Ultrasound Sensor and Whole System) as well as the ’None’ affected case.
Figure 5 shows the classification results of the different machine learning al-gorithms. The highest accuracies reached are 82.56% and 82.8% using k-NN and RF respectively. The result shows a trade-off between the binary classification offered in the first experiment and by providing the operator with more detailed information. As shown trade-off limits, the accuracy of the system accounts for a large number of false positive, potentially misleading the operator during normal operations.
4.4 Third Experiment
The third experiment aims at notifying the operator with an occurring scenario. To this end, the third experiment is divided in three operational trials.
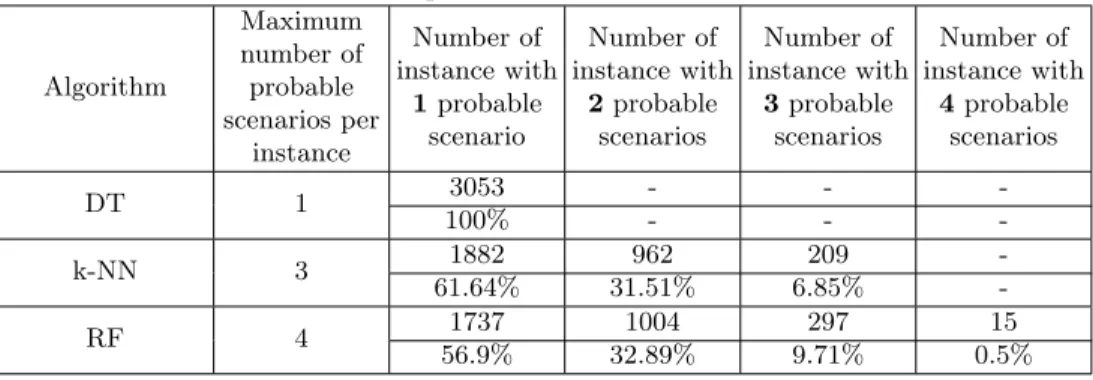
Table 3: Distribution of probabilistic classification of scenarios Algorithm Maximum number of probable scenarios per instance Number of instance with 1probable scenario Number of instance with 2probable scenarios Number of instance with 3probable scenarios Number of instance with 4probable scenarios DT 1 3053 - - -100% - - -k-NN 3 1882 962 209 -61.64% 31.51% 6.85% -RF 4 1737 1004 297 15 56.9% 32.89% 9.71% 0.5% Trial One:
In the first trial, models are trained to classify the different scenarios. The oper-ator is notified with the scenario occurring. Figure 6 shows the results of these trial. As shown, the accuracy is reduced and demonstrate a high false negative rate, with the highest accuracy only reaching 81.89%
To overcome this high false positive rate, the scenarios were reviewed and the following conclusions were made: (a) The scenarios are co-related. (b) When models are trained to output the probability of an event belonging to another of the 14 scenarios, a maximum of 4 scenarios have non-zero probabilities. For example, Table 3 shows the count of instances having 1, 2, 3 or 4 probable scenarios. In the second row of Table 3, 61.64% of the instances are classified to a single scenario, 31.51% are classified to be one of 2 possible scenarios and only 6.85% are classified to be one of 3 possible scenarios.
As a result of this analysis, trial two to four are based on reporting two prob-able scenarios to the operator, reducing the uncertainty of our approach. Trial Two:
In the second trial, the operator is notified with two potential attack scenarios in-stead of a single one. The two scenarios are the highest probabilities provided by the algorithms. Figure 7 demonstrates that this technique increased the accuracy to reach 95.55% and 95.64% using RF and k-NN receptively. By providing the operator with a probability in the attack scenario he is able to act accordingly and alleviate the attack, hence reducing the overall response time needed.
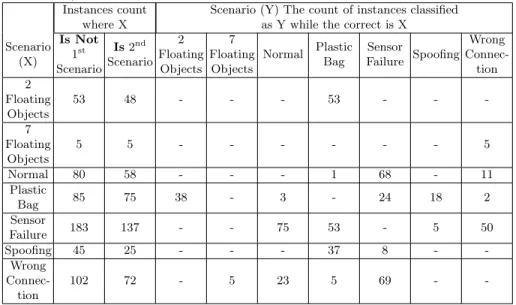
Table 4 shows an example of correctly classified instances when two probable scenarios are considered. The numbers are calculated in reference to the k-NN classifier. For example, in the first row, ’2 Floating Objects’ scenario misclassified instances are shown . 53 are misclassified as ’Plastic Bag’ sabotage. However, 48 of them can be correctly classified by considering the second probable scenario. In the same manner, in Table 4 row 4, 85 instances of the ’Plastic Bag’ scenario are misclassified to be ’2 Floating Objects’ (38 instances), ’Sensor Failure’ (24 instances), ’Spoofing’ (18 instances), ’Normal’ (3 instances) and ’Wrong
Con-Table 4: Co-relation of scenarios that are misclassified based on highest probable scenario and correct with the second probable one (Calculated based on k-NN experiment)
Instances count Scenario (Y) The count of instances classified where X as Y while the correct is X
Scenario (X) Is Not 1st Scenario Is2nd Scenario 2 Floating Objects 7 Floating Objects Normal Plastic Bag Sensor Failure Spoofing Wrong Connec-tion 2 Floating Objects 53 48 - - - 53 - - -7 Floating Objects 5 5 - - - 5 Normal 80 58 - - - 1 68 - 11 Plastic Bag 85 75 38 - 3 - 24 18 2 Sensor Failure 183 137 - - 75 53 - 5 50 Spoofing 45 25 - - - 37 8 - -Wrong Connec-tion 102 72 - 5 23 5 69 -
-nection’(2 instances). 75 can be correctly classified with the second probable scenario in consideration.
While the operator is notified with two probable scenarios, it can also be misleading. For this reason our third attempt provides a confidence measure to the operator increasing his situational awareness.
Trial Three and Four:
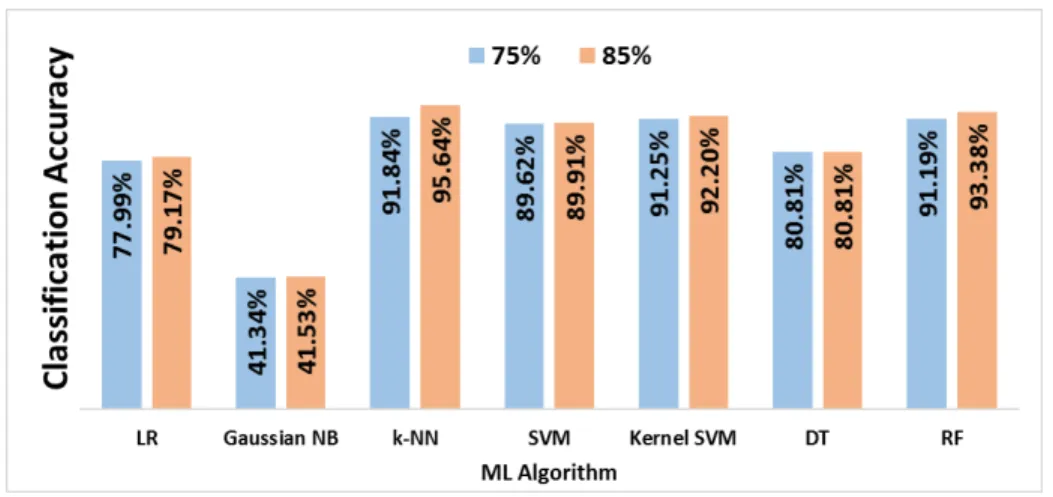
In the third and fourth trials, a single scenario is reported to the operator unless the probability is less than the confidence percentage. Figure 8 shows the results for 75% confidence. In the first case, a single scenario is reported if its probability is greater than or equal to 0.75, otherwise, if the threshold is reached a second scenario is reported as well. The accuracy provided is 91.84%.
This accuracy rises when using an 85% confidence. Figure 8 shows a maximum accuracy of 95.64% using k-NN.
It can be seen from Figure 7 and 8 that DT accuracy is the same. This is due to the DT output, as a single scenario for each instance is available, therefore it is not possible to output two probable scenarios to the operator.
Finally, the result shows that the fourth operational trial is the most convenient for the operator as a single scenario is provided, unless the threshold is reached. The accuracy provided by the fourth operational scenario also reaches 95.64%, hence reducing the uncertainty of the attack currently at hand, and the ability of the operator to alleviate the attack.
Fig. 8: Scenarios Classification Accuracy (Alerting with one/two scenario(s) based on 75% and 85% confidence)
5
Discussion and Limitations
In this section, we discuss the main takeaways based on the experiments evalu-ated in Section 4. Additionally, the limitations of our models are listed.
Key takeaways:
– Using high confidence:Probabilities are considered to solve the trade-off between the co-related scenarios and reducing the amount of information provided to the operator (i.e. multiple scenarios). This implies reporting the probability of having a scenario occurring. For this piece of work, a confidence interval of 85% is evidenced to provide the best results.
– Sensors location and architecture: The position of the sensors and the architecture of the SCADA system affects the collected data and, conse-quently, affects the model detection accuracy. Moreover, the collection of data greatly affect the pre-processing stages, it is therefore important to gather data consistently.
– Longer recording periods needed: In order to increase the accuracy of the machine learning model, the operators should have the recordings of long periods of time for all sensor data. This helps have multiple instances over time and therefore, more instances for training. Moreover, it is recommended to have similar recording duration for the different scenarios. In the case of massively different recording lengths, files need to be serialised in order to avoid bias towards the scenario with the longest recording time.
– Importance of scenarios:The more recorded scenarios used for training, the more robust the detection model. With more scenarios, the model can learn variations in scenarios. Moreover, the operator will be provided with higher confidence of reported anomalies.
Limitations:
– Limited Number of Scenarios: The experiments were conducted using 15 log files which covered 14 scenarios. Any new scenario other than the ones covered in the log files will not likely be reported to the operator.
– Model Evaluation:Models are evaluated using six machine learning tech-niques. Hence, the results are limited to these algorithms.
– Architecture:The data is limited to the scale of the CI used in this study. More complex architecture – such as introducing more tanks and sensors – may not yield the same anomaly detection accuracy.
– Real-Time testing: The model is built and tested based on the dataset, however, testing the model real-time is essential to measure the performance.
6
Related Work
The area of critical infrastructure protection and Security Information and Event Management has a rich history of books, deployments and lessons learned from both universities and organizations deploying tools and techniques to protect their environments.
Robert Mitchell and Ing-Ray Chen [25] presented a survey on recent Cyber-Physical Systems (CPS) intrusion detection systems. They classified CPSs into two categories based on potential detection technique: (1) Knowledge-Based or Misuse Detection and (2) Behaviour-Based. While the survey provides a general overview of potential threats, it focuses essentially on the network traffic rather than on data provenance and data accuracy. This survey, however, provides the stepping stone of the field. In [4] and [3] Amin et al. provide an overview a security threat assessment of a networked CI including different layers (i.e. su-pervisory and control networks). The manuscripts present a grey-box approach where the hacker possesses a certain level of knowledge of the system and is able to perpetrate a deception attack against the system in order to enable liquid spilling from the canal the IDS was tested on. Chenget al.[11] provide a tech-nique to alleviate control-oriented attacks, code-injection attacks or code-reuse attacks on embedded devices. The highlight the lack of existing mechanisms and present ’Orpheus’, a program behaviour model, taking advantage of the event-driven nature of embedded devices controlling critical infrastructure. Mathur [24] discusses the limitations of the detecting a incidents in critical infrastructures by analysing processes. The manuscript refers to two methods, the first described is the CUSUM [10]. CUMSUM is a statistical method allowing to detect anoma-lies in time series, corresponding to a specified process. The technique requires two parameters to operate, the ’bias’ and thethreshold’. The CUMSUM provides the cumulative sum of the deviation for the process measured. By plotting the predicted and observed state, the operator is able to identify the state of the facility and identify changes in behavior. The second methodology is based on State Entanglement (SE) [1]. SE combines the states of multiple components of a system to construct a state space. The state space act as a blacklist, highlighting prohibited states during normal operations.
7
Conclusion and Future Work
This work focused on building an anomaly detection and a SIEM tool for a SCADA water system. The model was evaluated using a real-world dataset cov-ering 14 anomaly scenarios including normal system behavior. The presented scenarios covered a wide range of events, ranging from hardware failure to sab-otage. Three experiments were conducted using 6 Machine Learning techniques. The experiments varied based on the level of information reported to the operator. The First experiment allowed anomaly event to be reported to the op-erator as a binary output. While events where being detected as either anomalies or normal operation, the operator was unaware of the type of anomaly occurring. The second experiment reported the affected component, providing the operator with information relating to a single or multiple sensor data. Finally, the third experiment - which provided the best results - reported the anomaly with an accuracy level, helping the operator to take subsequent correcting steps.
The overall evaluation showed that k-NN, Decision Tree and Random Forest outperformed ’Gaussian Na¨ıve Bayes, SVM and kernel SVM. Moreover, k-NN results demonstrated the highest accuracy amongst all algorithms in the three experiments. The experiments achieved the accuracy of94%for the binary out-put and95.64%for the scenarios classification. As aforementioned, the scenarios are co-related, therefore, the operator - in the third experiment - is notified with the most probable scenarios/anomaly occurring. Moreover, a confidence level was used to provide the operator with the best information available.
To further enhance the detection accuracy, the following should be consid-ered. Increasing the dataset instances to enhance the training process and build-ing hybrid model to classify subgroups of events.
References
1. Adepu, S., Mathur, A.: Distributed detection of single-stage multipoint cyber at-tacks in a water treatment plant. In: Proceedings of the 11th ACM on Asia Con-ference on Computer and Communications Security. pp. 449–460. ACM (2016) 2. Ahmed, I., Roussev, V., Johnson, W., Senthivel, S., Sudhakaran, S.: A scada system
testbed for cybersecurity and forensic research and pedagogy. In: Proceedings of the 2nd Annual Industrial Control System Security Workshop. pp. 1–9. ACM (2016) 3. Amin, S., Litrico, X., Sastry, S.S., Bayen, A.M.: Cyber security of water scada
sys-temspart ii: Attack detection using enhanced hydrodynamic models. IEEE Trans-actions on Control Systems Technology21(5), 1679–1693 (2013)
4. Amin, S., Litrico, X., Sastry, S., Bayen, A.M.: Cyber security of water scada systemspart i: Analysis and experimentation of stealthy deception attacks. IEEE Transactions on Control Systems Technology21(5), 1963–1970 (2013)
5. Barber, D.: Bayesian reasoning and machine learning. Cambridge University Press (2012)
6. Bellekens, X., Seeam, A., Nieradzinska, K., Tachtatzis, C., Cleary, A., Atkinson, R., Andonovic, I.: Cyber-physical-security model for safety-critical iot infrastructures. In: Wireless World Research Forum Meeting. vol. 35 (2015)
7. Brenner, J.F.: Eyes wide shut: The growing threat of cyber at-tacks on industrial control systems. Bulletin of the Atomic Scien-tists 69(5), 15–20 (2013). https://doi.org/10.1177/0096340213501372, https://doi.org/10.1177/0096340213501372
8. Bujari, A., Furini, M., Mandreoli, F., Martoglia, R., Montangero, M., Ronzani, D.: Standards, security and business models: key challenges for the iot scenario. Mobile Networks and Applications23(1), 147–154 (2018)
9. Calder´on Godoy, A.J., Gonz´alez P´erez, I.: Integration of sensor and actuator net-works and the scada system to promote the migration of the legacy flexible manu-facturing system towards the industry 4.0 concept. Journal of Sensor and Actuator Networks7(2), 23 (2018)
10. C´ardenas, A.A., Amin, S., Lin, Z.S., Huang, Y.L., Huang, C.Y., Sastry, S.: At-tacks against process control systems: risk assessment, detection, and response. In: Proceedings of the 6th ACM symposium on information, computer and communi-cations security. pp. 355–366. ACM (2011)
11. Cheng, L., Tian, K., Yao, D.D.: Orpheus: Enforcing cyber-physical execution se-mantics to defend against data-oriented attacks. In: Proceedings of the 33rd Annual Computer Security Applications Conference. pp. 315–326. ACM (2017)
12. Gupta, B., Agrawal, D.P., Yamaguchi, S., Arachchilage, N.A., Veluru, S.: Editorial security, privacy, and forensics in the critical infrastructure: advances and future directions (2017)
13. Hindy, H., Brosset, D., Bayne, E., Seeam, A., Tachtatzis, C., Atkinson, R., Bellekens, X.: A taxonomy and survey of intrusion detection system design tech-niques, network threats and datasets. arXiv preprint arXiv:1806.03517 (2018) 14. Hindy, H., Hodo, E., Bayne, E., Seeam, A., Atkinson, R., Bellekens, X.: A taxonomy
of malicious traffic for intrusion detection systems. In: Proceedings of the Cyber SA 2018. IEEE (6 2018)
15. Huitsing, P., Chandia, R., Papa, M., Shenoi, S.: Attack taxonomies for the mod-bus protocols. International Journal of Critical Infrastructure Protection1, 37–44 (2008)
16. Jensen, E.T.: Computer attacks on critical national infrastructure: A use of force invoking the right of self-defense. Stan. J. Int’l L.38, 207 (2002)
17. Jiang, N., Lin, H., Yin, Z., Xi, C.: Research of paired industrial firewalls in defense-in-depth architecture of integrated manufacturing or production system. In: In-formation and Automation (ICIA), 2017 IEEE International Conference on. pp. 523–526. IEEE (2017)
18. Jr, D.W.H., Lemeshow, S., Sturdivant, R.X.: Applied logistic regression, vol. 398. John Wiley & Sons (2013)
19. Langner, R.: Stuxnet: Dissecting a cyberwarfare weapon. IEEE Security Privacy 9(3), 49–51 (May 2011). https://doi.org/10.1109/MSP.2011.67
20. Larose, D.T., Larose, C.D.: Discovering knowledge in data: an introduction to data mining. John Wiley & Sons (2014)
21. Laso, P.M., Brosset, D., Puentes, J.: Dataset of anoma-lies and malicious acts in a cyber-physical subsystem (2017). https://doi.org///doi.org/10.1016/j.dib.2017.07.038, http://www.sciencedirect.com/science/article/pii/S2352340917303402, iD: 311593 22. Lee, R.M., Assante, M.J., Conway, T.: Analysis of the cyber attack on the ukrainian
power grid. SANS ICS Report) (2016)
23. Lior, R.: Data mining with decision trees: theory and applications, vol. 81. World scientific (2014)
24. Mathur, A.: On the limits of detecting process anomalies in critical infrastructure. In: Proceedings of the 4th ACM Workshop on Cyber-Physical System Security. pp. 1–1. ACM (2018)
25. Mitchell, R., Chen, I.R.: A survey of intrusion detection techniques for cyber-physical systems. ACM Comput. Surv. 46(4), 55:1–55:29 (Mar 2014). https://doi.org/10.1145/2542049, http://doi.acm.org/10.1145/2542049
26. Steinwart, I., Christmann, A.: Support vector machines. Springer Science & Busi-ness Media (2008)
27. Tan, E.E.: Cyber deterrence in singapore: Framework & recommendations (2018) 28. Ten, C.W., Manimaran, G., Liu, C.C.: Cybersecurity for critical infrastruc-tures: Attack and defense modeling. IEEE Transactions on Systems, Man, and Cybernetics-Part A: Systems and Humans40(4), 853–865 (2010)
29. VanderPlas, J.: Python data science handbook: Essential tools for working with data. ” O'Reilly Media, Inc.” (2016)