University of Birmingham
New Opportunities with Open Learner Models and
Visual Learning Analytics
Kay, Judy; Bull, Susan
DOI:10.1007/978-3-319-19773-9_87 License:
None: All rights reserved Document Version Peer reviewed version
Citation for published version (Harvard):
Kay, J & Bull, S 2015, New Opportunities with Open Learner Models and Visual Learning Analytics. in Artificial Intelligence in Education: 17th International Conference, AIED 2015, Madrid, Spain, June 22-26, 2015. Proceedings. Artificial Intelligence in Education, vol. 9112, Springer, pp. 666-669, International Conference on Artificial Intelligence in Education, Madrid, Spain, 22/06/15. https://doi.org/10.1007/978-3-319-19773-9_87
Link to publication on Research at Birmingham portal
Publisher Rights Statement:
The final publication is available at Springer via http://dx.doi.org/10.1007/978-3-319-19773-9_87 Eligibility checked August 2015
General rights
Unless a licence is specified above, all rights (including copyright and moral rights) in this document are retained by the authors and/or the copyright holders. The express permission of the copyright holder must be obtained for any use of this material other than for purposes permitted by law.
•Users may freely distribute the URL that is used to identify this publication.
•Users may download and/or print one copy of the publication from the University of Birmingham research portal for the purpose of private study or non-commercial research.
•User may use extracts from the document in line with the concept of ‘fair dealing’ under the Copyright, Designs and Patents Act 1988 (?) •Users may not further distribute the material nor use it for the purposes of commercial gain.
Where a licence is displayed above, please note the terms and conditions of the licence govern your use of this document. When citing, please reference the published version.
Take down policy
While the University of Birmingham exercises care and attention in making items available there are rare occasions when an item has been uploaded in error or has been deemed to be commercially or otherwise sensitive.
If you believe that this is the case for this document, please contact [email protected] providing details and we will remove access to the work immediately and investigate.
New Opportunities with Open Learner Models and
Visual Learning Analytics
Judy Kay1 and Susan Bull2
1 School of Information Technologies, University of Sydney, Australia 2 Electronic, Electrical and Systems Engineering, University of Birmingham, UK
[email protected], [email protected]
Abstract. This paper compares approaches to visualising data for users in educational settings, contrasting visual learning analytics and open learner models. We consider the roots of each, and identify how each field can learn from experiences and approaches of the other, thereby benefiting both.
Keywords: Open learner model, OLM, visual learning analytics, VLA.
1 Introduction
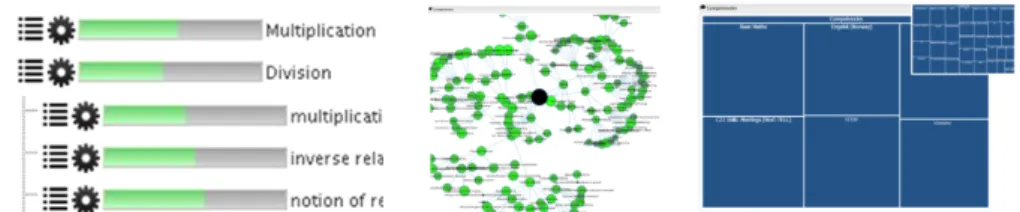
Open learner models (OLM) can be understood as learner models that allow a user, usually the learner, to view the internal system's learner model data in a human-understandable form. This allows learners to either act on the information, possibly with system guidance, to further their learning; and/or to reflect on it, then follow up with appropriate learning activities to achieve desired learning outcomes. OLMs typically aim to give learners greater control over their learning, as the learner model data can support their decisions about their learning [12]. Instead of seeing the system's underlying rules, numerical values, logical or conceptual structures, etc., about their knowledge and skills, the human-understandable nature of the OLM may be graphical, and so more readily understood. Learner models constructed in a variety of ways have been opened to users, for example: Bayesian networks [22]; concept maps [18]; constraint-based models [17]. Illustrating the variety of ways that learner models may be opened to users, Figure 1 shows three visualisations (of eight) from the Next-TELL OLM [1, 10], also used in the LEA’s Box (learning analytics toolbox) OLM (http://www.leas-box.eu). The reason for this particular choice for Figure 1 is to highlight that each visualisation is generated from the same underlying learner model, thus indicating that visualisations are not necessarily tied to particular learner modelling techniques. OLMs have been identified as an important sub-topic in learner modelling [7], and have also demonstrated significant learning benefits [14, 16, 17].
With the rapid emergence of big data in numerous fields, substantial interest has also grown in this area in education. Learning analytics, a relatively new field, includes the visualisation of learning-related data to help users interpret the vast amounts of data now available [15, 19]. The approach has some similarities to OLMs,
and learning analytics dashboards are being developed to support user interpretation of the data [21].
However, while visual learning analytics (VLA) approaches have received substantial attention, their focus is very often on issues such as performance level, activity completion, navigation to information, or other behaviour-focussed statistics. We highlight three of the key differences between VLA and OLM in the next section.
Figure 1. skill meter, concept map and overview-zoom-filter treemap visualisations from the Next-TELL and LEA’s Box OLMs
2 Open Learner Models and Visual Learning Analytics
There are three important differences between the state-of-the-art in VLA and OLM: 1. VLA tends to take a more statistical approach, presenting the corresponding
outcomes (such as number of pages viewed, or performance), for the user to then interpret; but OLM already presents processed data to the user, from the learner model (showing their competencies; or extent of coverage of material, perhaps in the form of a strategy used to try to gain understanding).
2. VLA is usually targeted at teachers or other stakeholders such as school or educational leaders, although the importance of learning visualisations to support learning is now growing (e.g. [8]). In contrast, OLMs have typically been developed primarily for learners, to help them reflect on, and take decisions about their learning, though there is also a history of OLMs shown to other stakeholders such as teachers [10], individual peers [4] or groups [20]. 3. VLA’s origin, based on recognition of the potential value of existing learning
data, aimed to make this easier to interpret, and for people to use it. In contrast, OLMs came from intelligent tutoring systems, with the learner model designed so that the system could adapt the interaction to suit the individual learner's needs. Opening the learner model made it a first class learning resource in its own right [2, 13]. Although OLMs began long before big data was so prevalent, they are now also looking towards big data, and approaches suitable for today's online learning contexts, for example: domain-independent reusable services for other systems [6, 13], or aggregated from multiple external systems, with visualisation of the combined evidence to the user [5, 13], are being developed. Thus, OLMs could be viewed as a specific kind of learning analytics, in that the visualisation is of the learner model rather than activities undertaken, performance, behaviour, etc. However, with a few exceptions [3, 8, 9, 11], there has been relatively little reference to learning analytics visualisations together with OLM.
3 Conclusions
Both visual learning analytics and OLMs aim to make data available to help users to interpret aspects of students' learning. A core difference, however, is that in OLMs, inferences relating to learning have already been made during the learner modelling process. An approach similar to this, even if not part of an adaptive system, may be useful to those working on learning analytics visualisations. A teacher may benefit from seeing (graphical) data that they do not need to further interpret to make it immediately useful to support their decision-making. Achieving the above, VLA could also become more commonplace in environments for students. The potential for learning analytics to facilitate metacognition has already been recognised. This was a foundation aim of OLMs [2], and so VLA for metacognition may be further enhanced by approaches already explored in OLM systems. While there are some exceptions, we have also identified the different target users in VLA and OLM research. Both fields may benefit from considering the utility of the approaches to other user types - all stakeholders have some kind of interest in learning data. Finally, OLM research could benefit substantially by the attention given to making big data understandable, found in VLA research, as classrooms are increasing bringing large amounts of data about learners as well as data that may reasonably contribute to learner models that is sourced away from the formal learning setting. This latter situation is perhaps where experiences from VLA have much to offer OLM research in Artificial Intelligence in Education: we can look forward to using techniques from learning analytics to contribute to learner modelling processes with increased data, combined with the more learning-focused visualisations of OLMs, and providing OLM visualisations for a greater range of stakeholders.
Acknowledgement
The first author’s research was supported by funding from the Faculty of Engineering & Information Technologies, The University of Sydney, under the Faculty Research Cluster Program. The second author’s research on OLM and VLA is supported by the European Commission (EC) under the Information Society Technology priority FP7 for R&D, contract 619762 LEA’s Box. This document does not represent the opinion of these bodies and the EC is not responsible for any use that might be made of its contents.
References
1. Bull, S., Johnson, M., Masci, D. & Biel, C. (in press). Integrating and Visualising Diagnostic Information for the Benefit of Learning, in P. Reimann, S. Bull, M. Kickmeier-Rust, R. Vatrapu & B. Wasson (eds), Measuring and Visualizing Learning in the Information-Rich Classroom, Routledge/Taylor and Francis.
2. Bull, S. & Kay, J. (2010). Open Learner Models, in R. Nkambou, J. Bordeau & R. Mizoguchi (eds), Advances in Intelligent Tutoring Systems, Springer, 318-338.
3. Bull, S., Kickmeier-Rust, M., Vatrapu, R., Johnson, M.D, Hammermueller, K., Byrne, W., Hernandez-Munoz, L., Giorgini, F. & Meissl-Egghart, G. (2013). Learning, Learning
Analytics, Activity Visualisation and Open Learner Model: Confusing? Proceedings of European Conference on Technology Enhanced Learning, Springer Verlag, Berlin. 4. Bull, S., Mabbott, A. & Abu Issa, A. (2007). UMPTEEN: Named and Anonymous Learner
Model Access for Instructors and Peers, International Journal of Artificial Intelligence in Education 17(3), 227-253.
5. Bull, S, Wasson, B., Kickmeier-Rust, M., Johnson, M.D., Moe, E., Hansen, C., Meissl-Egghart, G. & Hammermueller, K. (2012). Assessing English as a Second Language: From Classroom Data to a Competence-Based Open Learner Model, in G. Biswas et al. (eds), International Conference on Computers in Education, APSCE.
6. Conejo, R., Trella, M., Cruces, I. & Garcia, R. (2011). INGRID: A Web Service Tool for Hierarchical Open Learner Model Visualization, in F. Abel, S.M. Baldiris & N. Henze (eds), Adjunct Proc (UMAP) Poster and Demo Track, 10-12.
7. Demarais, M.C. & Baker, R.S.J.D. (2012). A Review of Recent Advances in Learner and Skill Modeling in Intelligent Environments, UMUAI 22, 9-38.
8. Durall, E. & Gros, B. (2014). Learning Analytics as a Metacognitive Tool, Proceedings of 6th International Conference on Computer Supported Education (CSEDU), 380-384. 9. Ferguson, R. (2012). Learning Analytics: Drivers, Developments and Challenges.
International Journal of Technology Enhanced Learning, 4(5/6), 304–317.
10.Johnson, M.D., Cierniak, G., Hansen, C., Bull, S., Wasson, B., Biel, C. & Debus, K.. (2013). Teacher Approaches to Adopting a Competency Based Open Learner Model, in Wong, L.-H. et al. (eds), International Conference on Computers in Education. APSCE. 11.Kalz, M. (2014). Lifelong Learning and its Support with new Technologies, in N.J. Smelser
& P.B. Baltes (eds.), International Encyclopedia of the Social and Behavioral Sciences, Pergamon, Oxford. (Author version: http://dspace.ou.nl/handle/1820/5321.
12.Kay, J. (1997). Learner Know Thyself: Student Models to Give Learner Control and Responsibility, International Conference on Computers in Education, AACE, 17-24. 13.Kay, J., & Kummerfeld, B. (2012). Creating Personalized Systems that People can
Scrutinize and Control: Drivers, principles and experience. ACM Transactions on Interactive Intelligent Systems (TiiS), 2(4), 24.
14.Kerly, A. & Bull, S. (2008). Children's Interactions with Inspectable and Negotiated Learner Models, in B.P. Woolf, E. Aimeur, R. Nkambou & S. Lajoie (eds), Intelligent Tutoring Systems: 9th International Conference, Springer-Verlag, 132-141.
15.Klerkx, J., Verbert, K. & Duval, E. (2014). Enhancing Learning with Visualization Techniques, in J.M. Spector, M.D. Merrill, J. Elen & M/J. Bishop (eds), Handbook of Research on Educational Communications and Technology, Springer New York, 791-807. 16.Long, Y. & Aleven, V. (2013). Supporting Students’ Self-Regulated Learning with an
Open Learner Model in a Linear Equation Tutor, in H.C. Lane, K. Yacef, J. Mostow & P. Pavlik (eds), Artificial Intelligence in Education, Springer-Verlag, 219-228.
17.Mitrovic, A. & Martin, B. (2007). Evaluating the Effect of Open Student Models on Self-Assessment, International Journal of Artificial Intelligence in Education 17(2), 121-144. 18.Perez-Marin, D., Alfonseca, E., Rodriguez, P., Pascual-Neito, I. (2007). A Study on the
Possibility of Automatically Estimating the Confidence Value of Students’ Knowledge in Generated Conceptual Models, Journal of Computers 2(5), 17-26.
19.Tervakari, A.M., Silius, K., Koro, J., Paukkeri, J. & Pirttilä, O. (2014). Usefulness of Information Visualizations Based on Educational Data, IEEE Global Engineering Education Conference (EDUCON), IEEE, 142-151.
20.Upton, K., & Kay, J. (2009). Narcissus: Group and Individual Models to Support Small Group Work. In Proc. User Modeling, Adaptation and Personalization, Springer, 54-65. 21.Verbert, K., Duval, E., Klerkx, J., Govaerts, S., Santos, J.L. (2013). Learning Analytics
Dashboard Applications, American Behavioral Scientist, 57(10), 1500-1509.
22.Zapata-Rivera, J.D., Greer, J.E. (2004). Interacting with Inspectable Bayesian Models, International Journal of Artificial Intelligence in Education 14, 127-163.