713
Why Study the
Thermal Properties
of Materials?
Materials selection decisions for components that are exposed to elevated/subambient temperatures, temperature changes, and/or thermal gradients re-quire the design engineer to have an understanding of the thermal responses of materials, as well as access to the thermal properties of a wide variety of materi-als. For example, in the discussion on materials that are used for the leadframe component of an integrated circuit package (Section 20.13), we note
restrictions that are imposed on the thermal charac-teristics of the adhesive material that attaches the integrated circuit chip to the leadframe plate. This adhesive must be thermally conductive so as to facilitate the dissipation of heat generated by the chip. In addition, its thermal expansion/contraction on heating/cooling must match that of the chip such that the integrity of the adhesive-chip bond is maintained during thermal cycling.
T
his photograph shows a white-hot cube of a silica fiber insulation material, which, only seconds after having been removed from a hot furnace, can be held by its edges with the bare hands. Initially, the heat transfer from the surface is rela-tively rapid; however, the thermal conduc-tivity of this material is so small that heat conduction from the interior [maximum temperature approximately 1250C (2300F)] is extremely slow.This material was developed espe-cially for the tiles that cover the Space Shuttle Orbiters and protect and insulate them during their fiery reentry into the atmosphere (Section 20.11). Other attrac-tive features of this high-temperature reusable surface insulation(HRSI) include low density and a low coefficient of ther-mal expansion. (Photograph courtesy of Lockheed Missiles & Space Company, Inc.)
714
After careful study of this chapter you should be able to do the following:
1. Define heat capacity andspecific heat.
2. Note the primary mechanism by which thermal
energy is assimilated in solid materials.
3. Determine the linear coefficient of thermal
expansion given the length alteration that accompanies a specified temperature change.
4. Briefly explain the phenomenon of thermal
expansion from an atomic perspective using a
potential energy-versus-interatomic separation plot.
5. Define thermal conductivity.
6. Note the two principal mechanisms of heat
con-dition in solids, and compare the relative magni-tudes of these contributions for each of metals, ceramics, and polymeric materials.
17.1 INTRODUCTION
By “thermal property” is meant the response of a material to the application of heat. As a solid absorbs energy in the form of heat, its temperature rises and its dimensions increase. The energy may be transported to cooler regions of the spec-imen if temperature gradients exist, and ultimately, the specspec-imen may melt. Heat capacity, thermal expansion, and thermal conductivity are properties that are often critical in the practical utilization of solids.
17.2 HEAT CAPACITY
A solid material, when heated, experiences an increase in temperature signifying that some energy has been absorbed.Heat capacityis a property that is indicative of a material’s ability to absorb heat from the external surroundings; it represents the amount of energy required to produce a unit temperature rise. In mathemat-ical terms, the heat capacity C is expressed as follows:
(17.1) where dQ is the energy required to produce a dT temperature change. Ordinar-ily, heat capacity is specified per mole of material (e.g., J/mol-K, or cal/mol-K). Specific heat (often denoted by a lowercase c) is sometimes used; this represents the heat capacity per unit mass and has various units (J/kg-K, cal/g-K, Btu/lbm-F).
There are really two ways in which this property may be measured, according to the environmental conditions accompanying the transfer of heat. One is the heat capacity while maintaining the specimen volume constant, the other is for con-stant external pressure, which is denoted Cp.The magnitude of Cpis always greater than however, this difference is very slight for most solid materials at room temperature and below.
Vibrational Heat Capacity
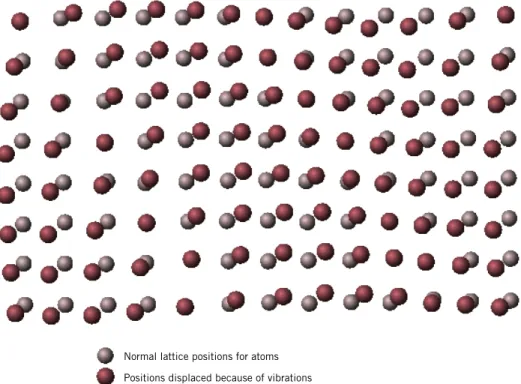
In most solids the principal mode of thermal energy assimilation is by the increase in vibrational energy of the atoms. Again, atoms in solid materials are constantly vibrating at very high frequencies and with relatively small amplitudes. Rather than being independent of one another, the vibrations of adjacent atoms are cou-pled by virtue of the atomic bonding. These vibrations are coordinated in such a way that traveling lattice waves are produced, a phenomenon represented in Fig-ure 17.1. These may be thought of as elastic waves or simply sound waves, having short wavelengths and very high frequencies, which propagate through the crystal
Cy;
Cy;
CdQ
17.2 Heat Capacity • 715
at the velocity of sound. The vibrational thermal energy for a material consists of a series of these elastic waves, which have a range of distributions and frequen-cies. Only certain energy values are allowed (the energy is said to be quantized), and a single quantum of vibrational energy is called a phonon.(A phonon is anal-ogous to the quantum of electromagnetic radiation, the photon.) On occasion, the vibrational waves themselves are termed phonons.
The thermal scattering of free electrons during electronic conduction (Section 12.7) is by these vibrational waves, and these elastic waves also participate in the transport of energy during thermal conduction (see Section 17.4).
Temperature Dependence of the Heat Capacity
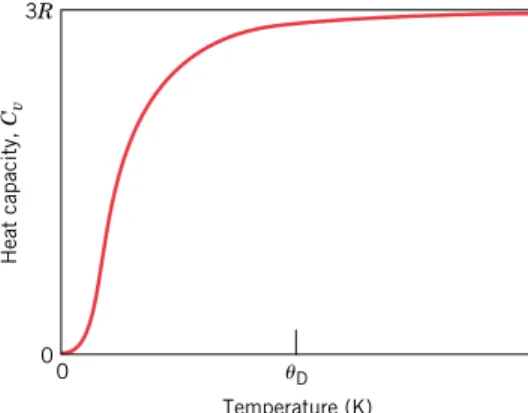
The variation with temperature of the vibrational contribution to the heat capac-ity at constant volume for many relatively simple crystalline solids is shown in Figure 17.2. The is zero at 0 K, but it rises rapidly with temperature; this cor-responds to an increased ability of the lattice waves to enhance their average energy with ascending temperature. At low temperatures the relationship between
and the absolute temperature T is
(17.2) where Ais a temperature-independent constant. Above what is called the Debye temperatureD, levels off and becomes essentially independent of temperature
at a value of approximately 3R,Rbeing the gas constant. Thus even though the total energy of the material is increasing with temperature, the quantity of energy
Cy
CyAT
3 Cy
Cy
Figure 17.1 Schematic representation of the generation of lattice waves in a crystal by means of atomic vibrations. (Adapted from “The Thermal Properties of Materials” by J. Ziman. Copyright © 1967 by Scientific American, Inc. All rights reserved.)
Normal lattice positions for atoms Positions displaced because of vibrations
Figure 17.2 The temperature dependence of the heat capacity at constant volume; Dis the Debye temperature.
required to produce a one-degree temperature change is constant. The value of D
is below room temperature for many solid materials, and 25 J/mol-K (6 cal/mol-K) is a reasonable room-temperature approximation for Table 17.1 presents exper-imental specific heats for a number of materials;cpvalues for still more materials are tabulated in Table B.8 of Appendix B.
Other Heat Capacity Contributions
Other energy-absorptive mechanisms also exist that can add to the total heat capac-ity of a solid. In most instances, however, these are minor relative to the magnitude of the vibrational contribution. There is an electronic contribution in that electrons absorb energy by increasing their kinetic energy. However, this is possible only for free electrons—those that have been excited from filled states to empty states above the Fermi energy (Section 12.6). In metals, only electrons at states near the Fermi energy are capable of such transitions, and these represent only a very small fraction of the total number. An even smaller proportion of electrons experiences excita-tions in insulating and semiconducting materials. Hence, this electronic contribution is ordinarily insignificant, except at temperatures near 0 K.
Furthermore, in some materials other energy-absorptive processes occur at specific temperatures, for example, the randomization of electron spins in a ferro-magnetic material as it is heated through its Curie temperature. A large spike is produced on the heat capacity-versus-temperature curve at the temperature of this transformation.
17.3 THERMAL EXPANSION
Most solid materials expand upon heating and contract when cooled. The change in length with temperature for a solid material may be expressed as follows:
(17.3a) or
(17.3b) where l0and lfrepresent, respectively, initial and final lengths with the temperature change from T0to Tf.The parameter l is called the linear coefficient of thermal
¢l l0 al¢T lfl0 l0 al 1TfT02 Cy. Temperature (K) Heat capacity, Cv 0 D 0 3R
17.3 Thermal Expansion • 717
expansion;it is a material property that is indicative of the extent to which a mate-rial expands upon heating, and has units of reciprocal temperature [(C)1or (F)1]. Of course, heating or cooling affects all the dimensions of a body, with a resultant change in volume. Volume changes with temperature may be computed from
(17.4) where Vand V0are the volume change and the original volume, respectively, and
symbolizes the volume coefficient of thermal expansion. In many materials, the ay
¢V
V0 ay¢T
Table 17.1 Tabulation of the Thermal Properties for a Variety of Materials
cp l k L Material (J/kg-K)a [(C)1106]b (W/m-K)c [-W/(K)2 108] Metals Aluminum 900 23.6 247 2.20 Copper 386 17.0 398 2.25 Gold 128 14.2 315 2.50 Iron 448 11.8 80 2.71 Nickel 443 13.3 90 2.08 Silver 235 19.7 428 2.13 Tungsten 138 4.5 178 3.20 1025 Steel 486 12.0 51.9 — 316 Stainless steel 502 16.0 15.9 — Brass (70Cu-30Zn) 375 20.0 120 — Kovar 460 5.1 17 2.80 (54Fe-29Ni-17Co) Invar (64Fe-36Ni) 500 1.6 10 2.75 Super Invar 500 0.72 10 2.68 (63Fe-32Ni-5Co) Ceramics Alumina (Al2O3) 775 7.6 39 — Magnesia (MgO) 940 13.5d 37.7 — Spinel (MgAl2O4) 790 7.6d 15.0e —
Fused silica (SiO2) 740 0.4 1.4 —
Soda–lime glass 840 9.0 1.7 —
Borosilicate (Pyrex) glass 850 3.3 1.4 —
Polymers Polyethylene 1850 106 –198 0.46–0.50 — (high density) Polypropylene 1925 145 –180 0.12 — Polystyrene 1170 90 –150 0.13 — Polytetrafluoroethylene 1050 126 –216 0.25 — (Teflon) Phenol-formaldehyde, 1590–1760 122 0.15 — phenolic (Bakelite) Nylon 6,6 1670 144 0.24 — Polyisoprene — 220 0.14 —
aTo convert to cal/g-K, multiply by 2.39 104; to convert to Btu/lb
m-F, multiply by 2.39 104. b
To convert to (F)1, multiply by 0.56.
cTo convert to cal/s-cm-K, multiply by 2.39 103; to convert to Btu/ft-h-F, multiply by 0.578. d
Value measured at 100C.
value of is anisotropic; that is, it depends on the crystallographic direction along which it is measured. For materials in which the thermal expansion is isotropic, is approximately 3l.
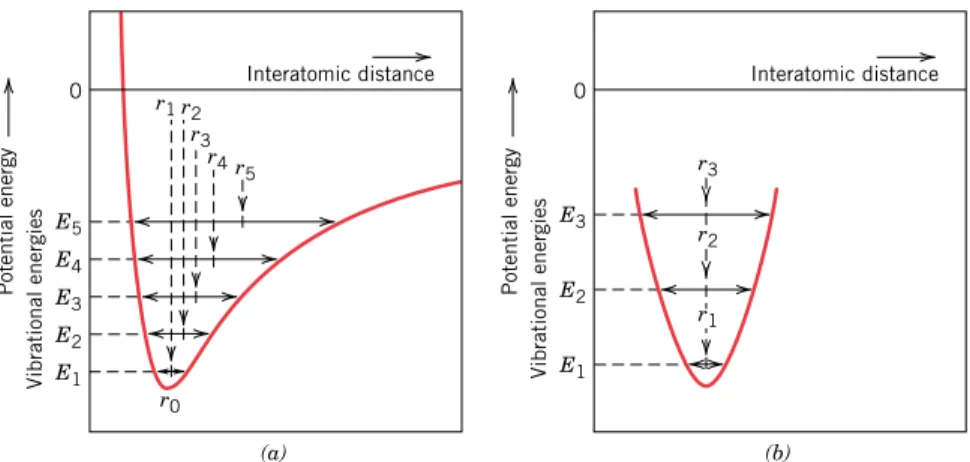
From an atomic perspective, thermal expansion is reflected by an increase in the average distance between the atoms. This phenomenon can best be understood by consultation of the potential energy versus interatomic spacing curve for a solid material introduced previously (Figure 2.8b), and reproduced in Figure 17.3a.The curve is in the form of a potential energy trough, and the equilibrium interatomic spacing at 0 K, r0, corresponds to the trough minimum. Heating to successively
higher temperatures (T1,T2,T3, etc.) raises the vibrational energy from E1to E2
to E3, and so on. The average vibrational amplitude of an atom corresponds to the
trough width at each temperature, and the average interatomic distance is repre-sented by the mean position, which increases with temperature from r0tor1tor2,
and so on.
Thermal expansion is really due to the asymmetric curvature of this potential energy trough, rather than the increased atomic vibrational amplitudes with rising temperature. If the potential energy curve were symmetric (Figure 17.3b), there would be no net change in interatomic separation and, consequently, no thermal expansion.
For each class of materials (metals, ceramics, and polymers), the greater the atomic bonding energy, the deeper and more narrow this potential energy trough. As a result, the increase in interatomic separation with a given rise in tempera-ture will be lower, yielding a smaller value of l.Table 17.1 lists the linear coeffi-cients of thermal expansion for several materials. With regard to temperature dependence, the magnitude of the coefficient of expansion increases with rising temperature. The values in Table 17.1 are taken at room temperature unless indi-cated otherwise. A more comprehensive list of coefficients of thermal expansion is provided in Table B.6 of Appendix B.
ay Potential energy Vibrational energies E1 r0 E2 E3 E4 E5 r1r2 r3 r4r 5 0 Interatomic distance (a) Potential energy Vibrational energies E1 E2 E3 r3 0 Interatomic distance (b) r2 r1
Figure 17.3 (a) Plot of potential energy versus interatomic distance, demon-strating the increase in interatomic separation with rising temperature. With heating, the interatomic separation increases from r0to r1to r2, and so on.
(b) For a symmetric potential energy-versus-interatomic distance curve, there is no increase in interatomic separation with rising temperature (i.e.,r1r2r3).
(Adapted from R. M. Rose, L. A. Shepard, and J. Wulff,The Structure and Prop-erties of Materials,Vol. 4,Electronic Properties.Copyright © 1966 by John Wiley & Sons, New York. Reprinted by permission of John Wiley & Sons, Inc.)
17.4 Thermal Conductivity • 719
Metals
As noted in Table 17.1, linear coefficients of thermal expansion for some of the common metals range between about 5 106and 25 106(C)1. For some applications, a high degree of dimensional stability with temperature fluctuations is essential. This has resulted in the development of a family of iron-nickel and iron-nickel-cobalt alloys that have lvalues on the order of 1 10
6
(C)1. One such alloy, tradename of Kovar (Table 17.1), has been designed to have expansion characteristics close to those of borosilicate (or Pyrex) glass; when joined to Pyrex and subjected to temperature variations, thermal stresses and possible fracture at the junction are avoided. Kovar and two other low-expansion alloys (Invar and Super-Invar) that have small lvalues are also included in Table 17.1.
Ceramics
Relatively strong interatomic bonding forces are found in many ceramic materials as reflected in comparatively low coefficients of thermal expansion; values typi-cally range between about 0.5 106 and 15 106 (C)1. For noncrystalline ceramics and also those having cubic crystal structures,l is isotropic. Otherwise, it is anisotropic; and, in fact, some ceramic materials, upon heating, contract in some crystallographic directions while expanding in others. For inorganic glasses, the coefficient of expansion is dependent on composition. Fused silica (high-purity SiO2glass) has a small expansion coefficient, 0.4 106(C)1. This is explained
by a low atomic packing density such that interatomic expansion produces rela-tively small macroscopic dimensional changes.
Ceramic materials that are to be subjected to temperature changes must have coefficients of thermal expansion that are relatively low, and in addition, isotropic. Otherwise, these brittle materials may experience fracture as a consequence of nonuniform dimensional changes in what is termed thermal shock, as discussed later in the chapter.
Polymers
Some polymeric materials experience very large thermal expansions upon heating as indicated by coefficients that range from approximately 50 106 to 400 106 (C)1. The highest l values are found in linear and branched polymers because the secondary intermolecular bonds are weak, and there is a minimum of crosslinking. With increased crosslinking, the magnitude of the expansion coefficient diminishes; the lowest coefficients are found in the thermosetting network polymers such as phenol-formaldehyde, in which the bonding is almost entirely covalent.
Concept Check 17.1
a. Explain why a brass lid ring on a glass canning jar will loosen when heated. b. Suppose the ring is made of tungsten instead of brass. What will be the effect
of heating the lid and jar? Why?
(The answer is given on the CD-ROM.)
✓
17.4 THERMAL CONDUCTIVITY
Thermal conduction is the phenomenon by which heat is transported from high-to low-temperature regions of a substance. The property that characterizes the ability of a material to transfer heat is the thermal conductivity.It is best defined
in terms of the expression
(17.5)
where qdenotes the heat flux,or heat flow, per unit time per unit area (area being taken as that perpendicular to the flow direction),k is the thermal conductivity, and dT/dx is the temperature gradient through the conducting medium.
The units of q and k are W/m2 (Btu/ft2-h) and W/m-K (Btu/ft-h-F), respec-tively. Equation 17.5 is valid only for steady-state heat flow, that is, for situations in which the heat flux does not change with time. Also, the minus sign in the expression indicates that the direction of heat flow is from hot to cold, or down the temperature gradient.
Equation 17.5 is similar in form to Fick’s first law (Equation 6.3) for atomic diffusion. For these expressions,k is analogous to the diffusion coefficient D, and the temperature gradient parallels the concentration gradient,dC/dx.
Mechanisms of Heat Conduction
Heat is transported in solid materials by both lattice vibration waves (phonons) and free electrons. A thermal conductivity is associated with each of these mechanisms, and the total conductivity is the sum of the two contributions, or
(17.6) where kl and kerepresent the lattice vibration and electron thermal conductiv-ities, respectively; usually one or the other predominates. The thermal energy associated with phonons or lattice waves is transported in the direction of their motion. The klcontribution results from a net movement of phonons from high-to low-temperature regions of a body across which a temperature gradient exists.
Free or conducting electrons participate in electronic thermal conduction. To the free electrons in a hot region of the specimen is imparted a gain in kinetic energy. They then migrate to colder areas, where some of this kinetic energy is transferred to the atoms themselves (as vibrational energy) as a consequence of collisions with phonons or other imperfections in the crystal. The relative contri-bution of ke to the total thermal conductivity increases with increasing free elec-tron concentrations, since more elecelec-trons are available to participate in this heat transference process.
Metals
In high-purity metals, the electron mechanism of heat transport is much more effi-cient than the phonon contribution because electrons are not as easily scattered as phonons and have higher velocities. Furthermore, metals are extremely good conductors of heat because relatively large numbers of free electrons exist that participate in thermal conduction. The thermal conductivities of several of the common metals are given in Table 17.1; values generally range between about 20 and 400 W/m-K.
Since free electrons are responsible for both electrical and thermal conduction in pure metals, theoretical treatments suggest that the two conductivities should
kklke
q k dT
17.4 Thermal Conductivity • 721
be related according to the Wiedemann–Franz law:
(17.7)
where is the electrical conductivity, T is the absolute temperature, and L is a constant. The theoretical value of L, 2.44 108-W/(K)2, should be independ-ent of temperature and the same for all metals if the heat energy is transported entirely by free electrons. Included in Table 17.1 are the experimental Lvalues for these several metals; note that the agreement between these and the theoretical value is quite reasonable (well within a factor of 2).
Alloying metals with impurities results in a reduction in the thermal conductiv-ity, for the same reason that the electrical conductivity is diminished (Section 12.8); namely, the impurity atoms, especially if in solid solution, act as scattering centers, lowering the efficiency of electron motion. A plot of thermal conductivity versus composition for copper–zinc alloys (Figure 17.4) displays this effect. Also, stainless steels, which are highly alloyed, become relatively resistive to heat transport.
L k
sT
Concept Check 17.2
The thermal conductivity of a plain carbon steel is greater than for a stainless steel. Why is this so? Hint:you may want to consult Section 13.2.
(The answer is given on the CD-ROM.)
✓
Figure 17.4 Thermal con-ductivity versus composition for copper–zinc alloys. (Adapted from Metals Handbook: Properties and Selection: Nonferrous Alloys and Pure Metals,Vol. 2, 9th edition, H. Baker, Managing Editor, American Society for Metals, 1979, p. 315.)
Ceramics
Nonmetallic materials are thermal insulators inasmuch as they lack large numbers of free electrons. Thus the phonons are primarily responsible for thermal conduc-tion:ke is much smaller than kl.Again, the phonons are not as effective as free electrons in the transport of heat energy as a result of the very efficient phonon scattering by lattice imperfections.
Composition (wt% Zn)
Thermal conductivity (W/m-K)
Thermal conductivity
(Btu/ft-h-° F) 0 10 20 30 400 50 100 150 200 250 0 100 200 300 400
Thermal conductivity values for a number of ceramic materials are contained in Table 17.1; room-temperature thermal conductivities range between approxi-mately 2 and 50 W/m-K. Glass and other amorphous ceramics have lower con-ductivities than crystalline ceramics, since the phonon scattering is much more effective when the atomic structure is highly disordered and irregular.
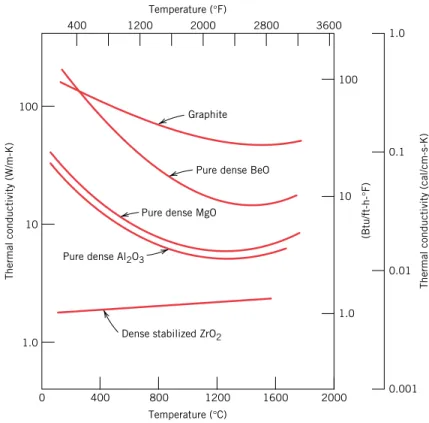
The scattering of lattice vibrations becomes more pronounced with rising tem-perature; hence, the thermal conductivity of most ceramic materials normally diminishes with increasing temperature, at least at relatively low temperatures (Figure 17.5). As Figure 17.5 indicates, the conductivity begins to increase at higher temperatures, which is due to radiant heat transfer: significant quantities of infrared radiant heat may be transported through a transparent ceramic material. The efficiency of this process increases with temperature.
Porosity in ceramic materials may have a dramatic influence on thermal con-ductivity; increasing the pore volume will, under most circumstances, result in a reduction of the thermal conductivity. In fact, many ceramics that are used for ther-mal insulation are porous. Heat transfer across pores is ordinarily slow and ineffi-cient. Internal pores normally contain still air, which has an extremely low thermal conductivity—approximately 0.02 W/m-K. Furthermore, gaseous convection within the pores is also comparatively ineffective.
Figure 17.5 Dependence of thermal conductivity on temperature for several ceramic materials. (Adapted from W. D. Kingery, H. K. Bowen, and D. R. Uhlmann, Introduction to Ceramics,2nd edition. Copyright © 1976 by John Wiley & Sons, New York. Reprinted by per-mission of John Wiley & Sons, Inc.)
Concept Check 17.3
The thermal conductivity of a single-crystal ceramic specimen is slightly greater than a polycrystalline one of the same material. Why is this so?
(The answer is given on the CD-ROM.)
✓
Temperature (°C) Thermal conductivity (W/m-K) (Btu/ft-h-° F)Thermal conductivity (cal/cm-s-K)
0 400 800 1200 Dense stabilized ZrO2 Pure dense Al2O3
Pure dense MgO
Pure dense BeO Graphite 1600 2000 1.0 10 100 1.0 0.1 0.01 0.001 1.0 10 100 400 1200 2000 Temperature (°F) 2800 3600
17.5 Thermal Stresses • 723
Polymers
As noted in Table 17.1, thermal conductivities for most polymers are on the order of 0.3 W/m-K. For these materials, energy transfer is accomplished by the vibra-tion and rotavibra-tion of the chain molecules. The magnitude of the thermal conduc-tivity depends on the degree of crystallinity; a polymer with a highly crystalline and ordered structure will have a greater conductivity than the equivalent amor-phous material. This is due to the more effective coordinated vibration of the molecular chains for the crystalline state.
Polymers are often utilized as thermal insulators because of their low thermal conductivities. As with ceramics, their insulative properties may be further enhanced by the introduction of small pores, which are ordinarily introduced by foaming during polymerization (Section 13.15). Foamed polystyrene (Styrofoam) is commonly used for drinking cups and insulating chests.
17.5 THERMAL STRESSES
Thermal stressesare stresses induced in a body as a result of changes in temper-ature. An understanding of the origins and nature of thermal stresses is important because these stresses can lead to fracture or undesirable plastic deformation.
Stresses Resulting from Restrained Thermal
Expansion and Contraction
Let us first consider a homogeneous and isotropic solid rod that is heated or cooled uniformly; that is, no temperature gradients are imposed. For free expansion or contraction, the rod will be stress free. If, however, axial motion of the rod is restrained by rigid end supports, thermal stresses will be introduced. The magni-tude of the stress resulting from a temperature change from T0to Tfis
(17.8) where E is the modulus of elasticity and l is the linear coefficient of thermal expansion. Upon heating (Tf T0), the stress is compressive ( 0), since rod
expansion has been constrained. Of course, if the rod specimen is cooled (Tf
T0), a tensile stress will be imposed ( 0). Also, the stress in Equation 17.8 is
sEal 1T0Tf2Eal¢T Concept Check 17.4
Which of a linear polyethylene (Mn 450,000 g/mol) and a lightly branched poly-ethylene (Mn650,000 g/mol) has the higher thermal conductivity? Why? Hint:you may want to consult Section 4.11.
(The answer is given on the CD-ROM.)
✓
Concept Check 17.5
Explain why, on a cold day, the metal door handle of an automobile feels colder to the touch than a plastic steering wheel, even though both are at the same temperature.
(The answer is given on the CD-ROM.)
the same as that which would be required to elastically compress (or elongate) the rod specimen back to its original length after it had been allowed to freely expand (or contract) with the T0Tftemperature change.
EXAMPLE PROBLEM 17.1
Thermal Stress Created Upon Heating
A brass rod is to be used in an application requiring its ends to be held rigid. If the rod is stress free at room temperature [20C (68F)], what is the max-imum temperature to which the rod may be heated without exceeding a com-pressive stress of 172 MPa (25,000 psi)? Assume a modulus of elasticity of 100 GPa (14.6 106psi) for brass.
Solution
Use Equation 17.8 to solve this problem, where the stress of 172 MPa is taken to be negative. Also, the initial temperature T0is 20C, and the magnitude of the linear coefficient of thermal expansion from Table 17.1 is 20.0 106(C)1. Thus, solving for the final temperature Tfyields
Stresses Resulting from Temperature Gradients
When a solid body is heated or cooled, the internal temperature distribution will depend on its size and shape, the thermal conductivity of the material, and the rate of temperature change. Thermal stresses may be established as a result of tem-perature gradients across a body, which are frequently caused by rapid heating or cooling, in that the outside changes temperature more rapidly than the interior; differential dimensional changes serve to restrain the free expansion or contrac-tion of adjacent volume elements within the piece. For example, upon heating, the exterior of a specimen is hotter and, therefore, will have expanded more than the interior regions. Hence, compressive surface stresses are induced and are balanced by tensile interior stresses. The interior–exterior stress conditions are reversed for rapid cooling such that the surface is put into a state of tension.
20C86C106C 1223F2 20 172 MPa 1100103 MPa2320106 1C214 TfT0 s Eal Concept Check 17.6
For a ceramic material, is thermal shock more likely to occur on rapid heating or cooling? Why?
(The answer is given on the CD-ROM.)
✓
Thermal Shock of Brittle Materials
For ductile metals and polymers, alleviation of thermally induced stresses may be accomplished by plastic deformation. However, the nonductility of most ceramics
Summar y • 725 enhances the possibility of brittle fracture from these stresses. Rapid cooling of a brittle body is more likely to inflict such thermal shock than heating, since the induced surface stresses are tensile. Crack formation and propagation from sur-face flaws are more probable when an imposed stress is tensile (Section 9.6).
The capacity of a material to withstand this kind of failure is termed its thermal shock resistance.For a ceramic body that is rapidly cooled, the resistance to ther-mal shock depends not only on the magnitude of the temperature change, but also on the mechanical and thermal properties of the material. The thermal shock resistance is best for ceramics that have high fracture strengths fand high thermal conductivities, as well as low moduli of elasticity and low coefficients of thermal expansion. The resistance of many materials to this type of failure may be approx-imated by a thermal shock resistance parameter TSR:
(17.9) Thermal shock may be prevented by altering the external conditions to the degree that cooling or heating rates are reduced and temperature gradients across a body are minimized. Modification of the thermal and/or mechanical character-istics in Equation 17.9 may also enhance the thermal shock resistance of a mate-rial. Of these parameters, the coefficient of thermal expansion is probably most easily changed and controlled. For example, common soda–lime glasses, which have an lof approximately 9 106(C)1, are particularly susceptible to ther-mal shock, as anyone who has baked can probably attest. Reducing the CaO and Na2O contents while at the same time adding B2O3in sufficient quantities to form
borosilicate (or Pyrex) glass will reduce the coefficient of expansion to about 3 106(C)1; this material is entirely suitable for kitchen oven heating and cool-ing cycles. The introduction of some relatively large pores or a ductile second phase may also improve the thermal shock characteristics of a material; both serve to impede the propagation of thermally induced cracks.
It is often necessary to remove thermal stresses in ceramic materials as a means of improving their mechanical strengths and optical characteristics. This may be accomplished by an annealing heat treatment, as discussed for glasses in Section 14.7.
S U M M A RY
17.2 Heat Capacity
This chapter discussed heat absorption, thermal expansion, and thermal conduc-tion—three important thermal phenomena. Heat capacity represents the quantity of heat required to produce a unit rise in temperature for one mole of a sub-stance; on a per-unit mass basis, it is termed specific heat. Most of the energy assimilated by many solid materials is associated with increasing the vibrational energy of the atoms; contributions to the total heat capacity by other energy-absorptive mechanisms (i.e., increased free-electron kinetic energies) are nor-mally insignificant.
For many crystalline solids and at temperatures within the vicinity of 0 K, the heat capacity measured at constant volume varies as the cube of the absolute temperature; in excess of the Debye temperature, becomes temperature inde-pendent, assuming a value of approximately 3R.
Cy
TSRsf k Eal
17.3 Thermal Expansion
Solid materials expand when heated and contract when cooled. The fractional change in length is proportional to the temperature change, the constant of propor-tionality being the coefficient of thermal expansion. Thermal expansion is reflected by an increase in the average interatomic separation, which is a consequence of the asymmetric nature of the potential energy versus interatomic spacing curve trough. The larger the interatomic bonding energy, the lower the coefficient of thermal expansion.
17.4 Thermal Conductivity
The transport of thermal energy from high- to low-temperature regions of a material is termed thermal conduction. For steady-state heat transport, the flux is propor-tional to the temperature gradient along the direction of flow; the proporpropor-tionality constant is the thermal conductivity.
For solid materials, heat is transported by free electrons and by vibrational lat-tice waves, or phonons. The high thermal conductivities for relatively pure metals are due to the large numbers of free electrons, and also the efficiency with which these electrons transport thermal energy. By way of contrast, ceramics and poly-mers are poor thermal conductors because free-electron concentrations are low and phonon conduction predominates.
17.5 Thermal Stresses
Thermal stresses, which are introduced in a body as a consequence of temperature changes, may lead to fracture or undesirable plastic deformation. The two prime sources of thermal stresses are restrained thermal expansion (or contraction), and temperature gradients established during heating or cooling.
Thermal shock is the fracture of a body resulting from thermal stresses induced by rapid temperature changes. Because ceramic materials are brittle, they are especially susceptible to this type of failure. The thermal shock resistance of many materials is proportional to the fracture strength and thermal conductivity, and inversely proportional to both the modulus of elasticity and the coefficient of thermal expansion.
I M P O R TA N T T E R M S A N D CO N C E P T S
Heat capacityLinear coefficient of thermal expansion Phonon Specific heat Thermal conductivity Thermal shock Thermal stress
R E F E R E N C E S
Kingery,W. D., H. K. Bowen, and D. R. Uhlmann, Int-roduction to Ceramics,2nd edition, John Wiley & Sons, New York, 1976. Chapters 12 and 16.
Ziman, J., “The Thermal Properties of Materials,”
Scientific American,Vol. 217, No. 3, September 1967, pp. 180–188.
Questions and Problems • 727
Q U E S T I O N S A N D P RO B L E M S
Heat Capacity
17.1 Estimate the energy required to raise the temperature of 2 kg (4.42 lbm) of the
follow-ing materials from 20 to 100C (68 to 212F): aluminum, steel, soda–lime glass, and high-density polyethylene.
17.2 To what temperature would 10 lbmof a brass
specimen at 25C (77F) be raised if 65 Btu of heat is supplied?
17.3 (a) Determine the room temperature heat capacities at constant pressure for the fol-lowing materials: copper, iron, gold, and nickel. (b) How do these values compare with one another? How do you explain this? 17.4 For aluminum, the heat capacity at constant volume Cat 30 K is 0.81 J/mol-K, and the Debye temperature is 375 K. Estimate the specific heat (a)at 50 K and (b)at 425 K. 17.5 The constant A in Equation 17.2 is
124R/5D3, where Ris the gas constant and
D is the Debye temperature (K). Estimate
Dfor copper, given that the specific heat is
0.78 J/kg-K at 10 K.
17.6 (a) Briefly explain why rises with increas-ing temperature at temperatures near 0 K. (b)Briefly explain why becomes virtually independent of temperature at tempera-tures far removed from 0 K.
Thermal Expansion
17.7 A bimetallic strip is constructed from strips of two different metals that are bonded along their lengths. Explain how such a de-vice may be used in a thermostat to regulate temperature.
17.8 An aluminum wire 10 m (32.8 ft) long is cooled from 38 to –1C (100 to 30F). How much change in length will it experience? 17.9 A 0.1 m (3.9 in.) rod of a metal elongates
0.2 mm (0.0079 in.) on heating from 20 to 100C (68 to 212F). Determine the value of the linear coefficient of thermal expansion for this material.
17.10 Briefly explain thermal expansion using the potential energy-versus-interatomic spacing curve.
Cy
Cy
17.11 When a metal is heated its density decreases. There are two sources that give rise to this di-minishment of : (1) the thermal expansion of the solid, and (2) the formation of vacan-cies (Section 5.2). Consider a specimen of copper at room temperature (20C) that has a density of 8.940 g/cm3.(a) Determine its density upon heating to 1000C when only thermal expansion is considered.(b)Repeat the calculation when the introduction of vacancies is taken into account. Assume that the energy of vacancy formation is 0.90 eV/atom, and that the volume coefficient of thermal expansion, is equal to 3l.
17.12 The difference between the specific heats at constant pressure and volume is described by the expression
(17.10) where is the volume coefficient of thermal expansion, is the specific volume (i.e., vol-ume per unit mass, or the reciprocal of den-sity), is the compressibility, and T is the absolute temperature. Compute the values of at room temperature (293 K) for alu-minum and iron using the data in Table 17.1, assuming that 3l and given that the values of for Al and Fe are 1.77 1011 and 2.65 1012(Pa)1, respectively. 17.13 To what temperature must a cylindrical rod
of tungsten 15.025 mm in diameter and a plate of 1025 steel having a circular hole 15.000 mm in diameter have to be heated for the rod to just fit into the hole? Assume that the initial temperature is 25C.
Thermal Conductivity
17.14 (a) Calculate the heat flux through a sheet of steel 10 mm (0.39 in.) thick if the tem-peratures at the two faces are 300 and 100C (572 and 212F); assume steady-state heat flow.(b)What is the heat loss per hour if the area of the sheet is 0.25 m2(2.7 ft2)? (c)What will be the heat loss per hour if soda–lime glass instead of steel is used? (d)Calculate the heat loss per hour if steel
ay cy y0 ay cpcy a2yy0T b ay,
is used and the thickness is increased to 20 mm (0.79 in.).
17.15 (a) Would you expect Equation 17.7 to be valid for ceramic and polymeric materials? Why or why not? (b)Estimate the value for the Wiedemann–Franz constant L [in -W/(K)2] at room temperature (293 K) for the following nonmetals: zirconia (3 mol% Y2O3), diamond (synthetic), gallium
ar-senide (intrinsic), poly(ethylene terephtha-late) (PET), and silicone. Consult Tables B.7 and B.9 in Appendix B.
17.16 Briefly explain why the thermal conductivi-ties are higher for crystalline than noncrys-talline ceramics.
17.17 Briefly explain why metals are typically better thermal conductors than ceramic materials.
17.18 (a) Briefly explain why porosity decreases the thermal conductivity of ceramic and polymeric materials, rendering them more thermally insulative.(b)Briefly explain how the degree of crystallinity affects the thermal conductivity of polymeric materials and why. 17.19 For some ceramic materials, why does the thermal conductivity first decrease and then increase with rising temperature?
17.20 For each of the following pairs of materials, decide which has the larger thermal conduc-tivity. Justify your choices.
(a) Pure silver; sterling silver (92.5 wt% Ag–7.5 wt% Cu).
(b) Fused silica; polycrystalline silica. (c) Linear and syndiotactic poly(vinyl chlo-ride) (nn 1000); linear and syndiotactic polystyrene (nn1000). (d) Atactic polypropylene (Mw10 6 g/mol); isotactic polypropylene (Mw5 10 5 g/mol). 17.21 We might think of a porous material as being a composite wherein one of the phases is a pore phase. Estimate upper and lower limits for the room-temperature thermal conduc-tivity of an aluminum oxide material having a volume fraction of 0.25 of pores that are filled with still air.
17.22 Nonsteady-state heat flow may be de-scribed by the following partial differential
equation:
where DTis the thermal diffusivity; this ex-pression is the thermal equivalent of Fick’s second law of diffusion (Equation 6.4b). The thermal diffusivity is defined according to
In this expression,k,, and cprepresent the thermal conductivity, the mass density, and the specific heat at constant pressure, respectively.
(a) What are the SI units for DT?
(b) Determine values of DTfor aluminum, steel, aluminum oxide, soda–lime glass, poly-styrene, and nylon 6,6 using the data in Table 17.1. Density values are included in Table B.1, Appendix B.
Thermal Stresses
17.23 Beginning with Equation 17.3, show that Equation 17.8 is valid.
17.24 (a) Briefly explain why thermal stresses may be introduced into a structure by rapid heating or cooling.(b)For cooling, what is the nature of the surface stresses? (c) For heating, what is the nature of the surface stresses?
17.25 (a) If a rod of 1025 steel 0.5 m (19.7 in.) long is heated from 20 to 80C (68 to 176F) while its ends are maintained rigid, deter-mine the type and magnitude of stress that develops. Assume that at 20C the rod is stress free.(b)What will be the stress mag-nitude if a rod 1 m (39.4 in.) long is used? (c)If the rod in part (a) is cooled from 20 to –10C (68 to 14F), what type and magni-tude of stress will result?
17.26 A copper wire is stretched with a stress of 70 MPa (10,000 psi) at 20C (68F). If the length is held constant, to what temperature must the wire be heated to reduce the stress to 35 MPa (5000 psi)?
17.27 If a cylindrical rod of brass 150.00 mm long and 10.000 mm in diameter is heated from
DT k rcp 0T 0t DT 02T 0x2
Design Problems • 729 20C to 160C while its ends are maintained
rigid, determine its change in diameter. You may want to consult Table 7.1.
17.28 The two ends of a cylindrical rod of nickel 120.00 mm long and 12.000 mm in diameter are maintained rigid. If the rod is initially at
70C, to what temperature must it be cooled in order to have a 0.023-mm reduction in diameter?
17.29 What measures may be taken to reduce the likelihood of thermal shock of a ceramic piece?
D E S I G N P RO B L E M S
Thermal Expansion17.D1 Railroad tracks made of 1025 steel are to be laid during the time of year when the tem-perature averages 10C (50F). If a joint space of 4.6 mm (0.180 in.) is allowed be-tween the standard 11.9-m (39-ft) long rails, what is the hottest possible temperature that can be tolerated without the introduc-tion of thermal stresses?
Thermal Stresses
17.D2 The ends of a cylindrical rod 6.4 mm (0.25 in.) in diameter and 250 mm (10 in.) long are mounted between rigid supports. The rod is stress free at room temperature [20C (68F)]; and upon cooling to –60C (–76F), a maximum thermally induced tensile stress of 138 MPa (20,000 psi) is possible. Of which of the following metals or alloys may the rod be fabricated: aluminum, copper, brass, 1025 steel, and tungsten? Why? 17.D3 (a) What are the units for the thermal shock
resistance parameter (TSR)? (b) Rank the
following ceramic materials according to their thermal shock resistance: soda–lime glass, fused silica, and silicon [ 100 direc-tion and {100} orientadirec-tion, as-cut surface]. Appropriate data may be found in Tables B.2, B.4, B.6, and B.7 of Appendix B. 17.D4 Equation 17.9, for the thermal shock
resist-ance of a material, is valid for relatively low rates of heat transfer. When the rate is high, then, upon cooling of a body, the maximum temperature change allowable without thermal shock,Tf, is approximately
where f is the fracture strength. Using the data in Tables B.2, B.4, and B.6 (Appendix B), determine Tffor a soda–lime glass, borosili-cate (Pyrex) glass, aluminum oxide (96% pure), and gallium arsenide [ 100direction and {100} orientation, as-cut surface].
¢Tf
sf