Received January 25th, 2010, Revised February 24th, 2010, Accepted for publication April 7th, 2010.
Detecting Rice Phenology in Paddy Fields with Complex
Cropping
Pattern Using Time Series MODIS Data
A Case study of Northern Part of West Java – Indonesia
Dewi Kania Sari1,2, Ishak H. Ismullah1, Widyo N. Sulasdi1 & Agung B. Harto11
Study Program of Geodesy & Geomatics, Faculty of Earth Science & Technology, ITB Jl. Ganesha 10, Bandung 40132 Indonesia. E-mail: dewiks@yahoo.com
2 Department of Geodetic Engineering, Institute of Technology Nasional (Itenas)
Jl. P.H.H. Mustafa 23, Bandung 40124 Indonesia
Abstract. Monitoring paddy rice phenology and cropping schedules over wide areas is essential for many applications. Remote sensing provides a viable means to meet the requirement of improved regional-scale data set of paddy rice fields, such as phenological stages. A number of methods have been developed for detecting seasonal vegetation changes by using satellite images. Development of such methods to paddy fields with complex cropping pattern is still challenging. In this study, we developed a method for remotely determining phenological stages of paddy rice that uses time series of two vegetation indices (EVI and LSWI) obtained from MODIS data. We ran the algorithm to determine the planting date, heading date, and harvesting date of paddy rice in 5 districts of West Java Province, using the 8-day composite MODIS Surface Reflectance products (500-m spatial resolution) in 2004. Estimated harvesting dates were then used to calculate paddy rice harvested area. We validated the performance of the method against statistical data in 13 subdistricts. The root mean square errors of the estimated paddy rice harvested area against the statistical data were: 851 Ha for monthly data, 1227 Ha for quarterly data, and 2433 Ha for yearly data. Subdistrict-level comparisons of paddy rice harvested area between the MODIS estimation and statistical data showed moderate correlation, with coefficient of determination (r2) 0.6, 0.7, and 0.6 for monthly, quarterly and yearly data, respectively. The results of this study indicated that the MODIS-based paddy rice phenological detection algorithm could potentially be applied at large spatial scales to monitor paddy rice agriculture on a timely and frequent basis.
Keywords: cropping pattern; MODIS; paddy rice phenology; remote sensing.
1
Introduction
Rice is one of the world’s major staple foods. Paddy rice is widely cultivated in Asian region including Indonesia. Monitoring paddy rice phenology and cropping schedules over wide areas is essential for many applications, such as estimation of net primary production [1], deciding time boundary conditions for
crop yield modeling [2] and supporting decisions about water supply [3]. Remote sensing provides a viable means to meet the requirement of improved regional-scale datasets of paddy rice fields.
Cultivation of paddy rice is constrained by some physical factors such as solar radiation, temperature, and water. In most part of Indonesia, temperature could not be a limiting factor for cultivation so that the cropping season of rice would be planned by a schedule of irrigation or even arbitrary decision by the farmer. Such condition caused complex cropping pattern. The cropping pattern is defined as the spatial representation of crop rotations [18]. Since paddy rice cultivation in Indonesia is not constrained by the physical factors mentioned above, the crop rotations are different among locations mixed with different cropping calendar. This complexity would be an obstacle to obtain information to be analyzed quantitatively regarding the actual distribution of paddy rice cultivation both in time and space [4].
A paddy field is a flooded parcel of arable land used for growing rice and other semiaquatic crops. According to its water source, paddy field can be categorized to irrigated and rainfed paddy field. During the rice transplanting period and the early part of the rice growing season, paddy fields are a mixture of green rice plants and open water [4-6]. A new generation of advanced optical sensors, including the Moderate Resolution Imaging Spectroradiometer (MODIS) onboard the Terra and Aqua satellites, provides an opportunity for developing and generating improved vegetation indices that are sensitive to vegetation moisture and soil water, such as Land Surface Water Index (LSWI) and Normalized Difference Water Index (NDWI) [5,7,8].
A number of studies have explored the potential of satellite images for detecting seasonal vegetation changes. Optical remote sensing is often used to identify paddy rice phenology and cropping schedule. Identifying crop phenological stages from MODIS data may enable us to estimate crop growth under various regional weather conditions. A number of researches has been attempted to detect paddy rice phenological stages in wide extent of Asian region using MODIS data, e.g. Xiao et al. [5,6], Sakamoto et al. [9,10], and Uchida [4]. They employed a kind of indices derived from MODIS data (e.g. Enhanced Vegetation Index (EVI), Normalized Difference Vegetation Index (NDVI), LSWI, and NDWI). Each researcher applied different approaches and algorithms to identify paddy rice phenology.
Sakamoto et al. [9,10] used time-series EVI data. They smoothed EVI data by time-frequency analysis to specify the paddy rice phenological stages by detecting the maximum point, minimal point, and inflection point from the smoothed EVI time profile. By applying the method to MODIS data, they
determined the planting date, heading date, harvesting date, and growing period of paddy rice. Xiao et al. [5, 6] used time series of two vegetation indices (LSWI & EVI or LSWI & NDVI) derived from MODIS images to identify initial period of flooding and transplanting in paddy rice fields for the purpose of paddy rice fields mapping. Application of such methods to paddy fields with complex cropping pattern has not been much examined. Uchida [4] has performed such attempt by applying Landsat and MODIS data in West Java region by using EVI, NDVI, and NDWI indices. He focused on the determination of paddy rice planting time.
This study has two major objectives; one is to develop a method to detect paddy rice phenology using MODIS data adaptable to the study site, and the other is to characterize the pattern of rice phenology on a regional scale appeared in the study site. Northern West-Java was selected as the case study area because it has a large amount of paddy rice fields with complex cropping pattern. The first objective would be beneficial to predict seasonal rice production by determining the planting date, heading date, harvesting date, and growing period of paddy rice. The second objective aims at understanding the level of homogenity and heterogenity of paddy rice phenology over wide areas.
2
Methodology
2.1
Study Area
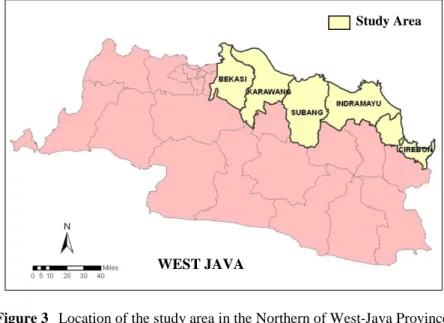
The northern part of West Java Province, Indonesia has been selected as the study area. Figure 1 presents the location of the study area which comprises 5 districts of West Java Province, i.e. Bekasi, Karawang, Subang, Indramayu, and Cirebon. The province is known as the major contributor to the national rice production with 17.10% market share average (2006-2008). The common rice cropping pattern in this area consists of three periods: first rice or wet season (WS) rice (October/November – January/February), second rice or dry season I (DS I) rice (March/April – June/July), and secondary crop/fallow or dry season II (DS II) rice (July/August – November/December) [11; 17]. As described earlier, in fact the cropping pattern of paddy rice in the study area varies both spatially and temporally. Individual farmers have different flooding and rice transplanting schedules for their paddy rice fields, which poses a great challenge for remote sensing analyses at large spatial scales.
Figure 3 Location of the study area in the Northern of West-Java Province.
2.2
MODIS Data
The MODIS sensor has 36 spectral bands, seven of which are designed for the study of vegetation and land surfaces: blue (459–479 nm), green (545–565 nm), red (620–670 nm), near infrared (NIR1: 841–875 nm; NIR2: 1230–1250 nm),
and shortwave infrared (SWIR1: 1628–1652 nm, SWIR2: 2105–2155 nm). Daily
global imagery is provided at spatial resolutions of 250-m (red and NIR1) and
500-m (blue, green, NIR2, SWIR1, SWIR2).We used a complete one year data
set (1–366 DOY/Day Of Year) of 8-day composite MODIS Surface Reflectance Product (MOD09A1) data for 2004 (forty-six 8-day composites), downloaded from the USGS EROS Data Center website (http://lpdaac.usgs.gov). Each 8-day composite includes estimates of surface spectral reflectance of the seven spectral bands at 500-m spatial resolution.
The 8-day composite product is generated through a multi-step process that first eliminates observations with a low quality score or low observational coverage, and then selects the observation with the minimum value of blue band (band 3) during the 8-day composite period [20]. In the production of MOD09A1, atmospheric corrections for gases, thin cirrus clouds and aerosols are implemented [12]. The composites still have reflectance variations associated with variation in the bidirectional reflectance distribution function (BRDF). MOD09A1 also includes quality control flags to account for various image artifacts (e.g., clouds, cloud shadow). MODIS products are organized in a tile system with the Sinusoidal (SIN) projection grid, and each tile covers an area of
Study Area
1200 km by 1200 km (approximately 108 latitude by 108 longitude at equator). The study area is covered in MOD09A1 data tiles H28V09. For the purpose of our study, the data was reprojected to geographic projection in WGS-84 datum using the software provided by USGS EROS Data Center, i.e. MRT (MODIS Reprojection Tool). Paddy fields area considered for the analysis were extracted from land use map. Land use information and administrative boundaries of West Java Province was provided by Remote Sensing and Geographic Information Science Research Group, ITB and the National Coordinating Agency for Surveys and Mapping, Indonesia (Bakosurtanal), respectively.
2.3
Calculation of Vegetation Indices
With the intention of characterizing the phenological phases of paddy rice, 2 indices EVI and LSWI were calculated from MOD09A1 data. For each 8-day composite, we calculated EVI (Eq. 1) [13] and LSWI (Eq. 2) [7] using surface reflectance values from the blue, red, NIR (841–875 nm) and SWIR (1628– 1652 nm) bands:
1
5
.
7
5
.
2
EVI
blue red nir red nir
(1) swir nir swir nirLSWI
(2)where nir is surface reflectance of NIR band; red is surface reflectance of red band; blue is surface reflectance of blue band; swir is surface reflectance of
SWIR band. EVI and LSWI was calculated in 500-mresolution. We used EVI
in our method for some reasons. EVI has higher sensitivity than that of NDVI in high biomass areas [14]. Since the biomass of paddy fields is low compared with forests, EVI retains linearity in paddy fields. Therefore it can be used to evaluate the process of paddy growth adequately with a wide dynamic range [9]. Furthermore, EVI directly adjusts the reflectance in the red band as a function of the reflectance in the blue band, and it accounts for residual atmospheric contamination (e.g., aerosols) and variable soil and canopy background reflectance [14]. Meanwhile, LSWI was selected in our method since it is sensitive to vegetation moisture and soil water [5, 7] and therefore would be useful to predict the phenological stages of paddy rice. Time series EVI and LSWI data (forty-six 8-day composites) was used to identify paddy rice phenological stages and determine the planting date, heading date, harvesting date, and growing period in 2004. We only processed pixels with complete dataset of EVI and LSWI.
2.4
Algoritms for Detecting Paddy Rice Phenological Stages
The phenological stages of paddy rice can be characterized by three main periods: (1) the flooding and rice transplanting period; (2) the growing period (vegetative growth, reproductive and ripening stages); and (3) the fallow period after harvest [5, 15]. Research conducted by Domiri et al. [16] using MODIS data showed the usefulness of EVI curve to detect growing stages of paddy rice crop cycle. According to their findings, during flooding and rice transplanting period, about 0-20 days after transplanting (DAT), EVI values < 0.2. About 60 DAT, rice plant canopies cover most of the surface area with EVI values. In this period rice arrives at its peak of EVI values ranges around 0.6 to 0.7. At the end of the growth period prior to harvesting (the ripening stage), there is a decrease of EVI values (80 – 105 DAT) around 0.3. In the fallow period after harvest EVI values is about 0.17 – 0.2. Sakamoto et al. [9] have used smoothed time profile of EVI to determine the heading date, planting date, and harvesting date of paddy rice.
As mentioned above, paddy rice fields has a physical unique feature that rice plants are grown on flooded soils. During the flooding and rice transplanting period, the land surface is a mixture of surface water and green rice plants. Water depth generally varies from 2 to 15 cm. There is a decrease of leaf and stem moisture content and a decrease of the number of green leaves at the end of the growth period prior to harvesting [7]. For optical sensors, detection of changes in the mixture of surface water and green vegetation in paddy rice fields requires spectral bands or vegetation indices that are sensitive to both water and vegetation. LSWI temporal dynamics were variable enough to capture substantial increases of surface water due to flooding (inundation) and rice transplanting at paddy rice fields [5, 7].
Considering the success of previous studies conducted by other researchers [4, 5, 7, 9], we have used LSWI and EVI in our study to detect the phenological stages of paddy rice. In order to determine the planting date, heading date, and harvesting date of paddy rice, we have developed a simple algorithm that combines EVI and LSWI. The algorithm and threshold for detecting the phenological stages are as follows. Figure 2 shows the flowchart of the algorithm.
(i) Heading date
We started to identify the phenological stages of paddy rice by detecting the heading date. According to time-series data of the spectral reflectance of paddy fields [16], the maximum EVI appears around the heading date, 60 DAT. The rice changes its growth phase from vegetative growth to reproductive growth on reaching the heading date, and leaves begin to wither and die. Therefore, we
defined the date of the maximum EVI in the time profile as the estimated heading date and EVI 0.5 as the treshold. We devide one-year time profile of EVI into 3 periods to find the maximum EVI value of each period (4 months for each period).
Input: EVI & LSWI
Heading Date (HD) Detection
Identification of the time of max of EVI as HD: EVI(t) = max(EVI(ti))
AND EVI(t) >= 0,5
Planting Date (PL) Detection
Checking PL after the time of HD: LSWI(t-8)+0,05 >= EVI(t-8)
OR
LSWI(t-9)+0,05 >= EVI(t-9) OR
LSWI(t-7)+0,05 >= EVI(t-7)
Harvesting Date (HV) Detection
Checking HV after the time of PL:
EVI(t+14)+0.05 >= LSWI(t+14) AND EVI(t+14) <= 0.3 OR
EVI(t+15)+0.05 >= LSWI(t+15) AND EVI(t+15) <= 0.3 OR
EVI(t+13)+0.05 >= LSWI(t+13) AND EVI(t+14) <=0.3
Output: HD, PL, HV
Figure 2 Flowchart of the Paddy Rice Phenological Detection Method. (ii) Planting date
In general, paddy fields are plowed and flooded before rice planting. The EVI of paddy fields decreases during this period and then increases again after rice planting. Meanwhile, value of LSWI increases during the flooding period. Therefore, following Xiao et al. [5], we hypothesized that a temporary inversion
of the vegetation indices, where LSWI either approaches or overtakes EVI values, may signal flooding and rice transplanting in paddy rice fields. Because the heading date is reached around 60 DAT, thus after a heading date of a pixel was identified, we used the following threshold to detect the planting date: (LSWI+0.05) EVI within eight or nine or seven 8-day composites (64 or 72 or 56-days) preceding the heading date.
(iii) Harvesting date
After the heading season, values of EVI and LSWI in paddy fields begin to decrease as leaves wither and die and the water in paddy field is dried off before harvesting. EVI then decreases abruptly because of harvesting [9] and so does LSWI. Domiri et al. [16] found that EVI value at the harvesting phase is around 0.24 – 0.28. Paddy fields in the Northern of West Java Province in 2004 growing season was dominated by IR64 and Ciherang rice varieties [19]. Based on the information, we assumed that paddy rice generally harvested 105 – 120 DAT in this area. For that reason, to detect the harvesting date we used the following threshold: EVI 0.3 and (EVI+0.05) LSWI within 14 or 15 or 13 8-day composites (112 or 120 or 104-days) following the date of flooding and transplanting.
3
Results & Discussion
3.1
Implementation of Algorithm
Figure 3 shows time profile of 8-day composite of EVI and LSWI of Year 2004 for four specific pixels in the study area. We selected those four pixels from District Indramayu so as to compare the results of our detection method with the cropping calendar of District Indramayu published by the Indonesian Agency for Agricultural Research and Development (IAARD) [11]. The figure illustrates the variability of paddy rice phenological stages in the study area, detected by our method. Two heading dates are apparent in the EVI-LSWI profiles for the four pixels, reflecting the double cropping system of paddy rice. At pixel A, located in Subdistrict Balongan, paddy rice of the first growing season (GS) was harvested at the middle of April (105-112 DOY). We can estimate that it was planted at the end of December of the previous year (358-365 DOY). It was a WS rice. The second GS at pixel A was a DS I rice since it was planted at the beginning of May (129-136 DOY) and harvested at the end of August (241-248 DOY).
Pixel B (located in Subdistrict Gabuswetan) and pixel C (located in Subdistrict Karangampel) had similar cropping calendar. There were two GS of paddy rice,
i.e. WS rice and DS I rice. Planting date of WS rice was at the beginning of December of the previous year (334-341 DOY) and harvesting date was at the end of March (81-88 DOY). Planting date of DS I rice was at the beginning of April (97-104 DOY) and harvesting date was at the end of July (209-216 DOY). However, at pixel C there was a secondary crop planted in August-October, indicated by the raise of EVI value up to 0.4 while the value of LSWI relatively low (<0.2).
Figure 3 Time profile of EVI and LSWI and identification of paddy rice planting (PL), heading (HD), and harvesting (HV) dates at several pixels in Northern West Java Province year 2004.
Pixel A HD1 HV1 HD2 HV2 PL2 Pixel B HD1 HD2 HV1 PL2 HV2 HD1 HD2 Pixel C HV2 HV1 PL2 Pixel D HD1 HD2 HV2 HV1 PL2 Secondary crop
Pixel D (located in Subdistrict Juntinyuat) had similar cropping pattern to pixel A. It had double GS of paddy rice. Its planting date of WS rice was at the end of December of the previous year (358-365 DOY), and harvesting date was at the middle of April (105-112 DOY), the same as pixel A. But, there was a slight different in the second GS. The planting date of DS I rice at pixel D was at he middle of May (137-144 DOY) and the harvesting date was at the beginning of September (249-256 DOY).
In this study, we used one-year EVI and LSWI data set, from January to December (1 – 366 DOY 2004). Since our paddy rice phenological detection algorithm starts from the detection of heading date then our method could not detect planting date of paddy rice planted around November – December as its heading season will appear in January – February of the following year. However, the indication of paddy rice planting still could be noticed from the increase of LSWI value which overtaken EVI value, as seen clearly at pixel A, C, and D in Figure 2. Generally, in the planting season LSWI 0.2, in the heading season LSWI around 0.3 – 0.4, and in the harvesting season LSWI < 0.2.
Since there was no data available regarding planting and harvesting dates of paddy rice in the study area, we couldn’t evaluate the results of our detection method accurately. However, we have made a plausibility analysis by comparing our results with the cropping calendar published by IAARD [11]. Only cropping calendar of Indramayu District which is available. The results seemed reasonable. Table 1 presents the comparison between planting dates detected by our method and those provided by IAARD at pixels A, B, C, and D.
Table 1 Comparison Between the Planting Dates of Paddy Rice Estimated by MODIS and Cropping Calendar of IAARD.
Pixel Subdistrict
Planting Date of WS Rice
Planting Date of DS I Rice
MODIS IAARD MODIS IAARD
A Balongan 24-31 Dec Dec II/III* 8-15 May May I/II
B Gabuswetan 30 Nov-7 Dec Nov III/Dec I 21-28 March Apr II/III
C D Karangampel Juntinyuat 30 Nov-7 Dec 24-31 Dec Nov III/Dec I Dec II/III 21-28 March 16-23 May Apr II/III May I/II
Note: * Roman I, II, II indicate date: 1-10, 11-20, 21-30 of each month
Figure 4 shows the spatial distibution of planting and harvesting schedules of paddy rice. The figure shows that in general paddy rice planting started from
the middle area (April, yellow color) then moved to northern part (May, red color; June, green color; July, blue color). This could be the indication of water availability and irrigation scheme in the northern part of West Java. The spatial distribution of harvesting schedules shows similar pattern to planting schedules, that is started from middle area and moved to northern part.
3.2
Quantitative Evaluation of MODIS-derived Harvested Area
of Paddy Rice
Due to scarcity of statistics data in the study area, we found some difficulties to validate the planting, heading, and harvesting dates resulted from our method. Therefore, to make a quantitave evaluation, we compared the harvested area of paddy rice derived from our method with statistics data obtained from District Office of Agriculture (Dinas Pertanian Kabupaten). We made a monthly, quarterly, and yearly subdistrict-level comparisons of area estimates of harvested paddy rice (in hectare) from MODIS 8-day surface reflectance data and paddy rice harvested area of district agricultural statistics data from the Office of Agriculture.
A MODIS pixel in the MOD09A1 product has a spatial resolution of 500-m
500-m and an area of 250,000 m2 or 25 Ha. We assumed all MODIS-based paddy rice pixels have 100% fractional cover of paddy rice within individual pixels. Monthly harvested area was obtained by classifying the harvesting dates derived from MODIS data to 12 class ranges representing 12 months of a year. We calculated the number of pixels in each class. From monthly harvested area data, we calculated quarterly and yearlydata. The difference between estimated data and statistics data was defined as the error. Thirteen subdistricts in the study area were selected as test sites. Each subdistricts has statistics data of monthly harvested area of paddy rice. Table 2 shows the summary of mean deviation (MD) and root mean square error (RMSE) of the estimated paddy rice harvested area against the statistical data.
Table 2 Mean Deviation (MD) and Root Mean Square Error (RMSE) of the estimated harvested area against the statistical data.
Period Sampel MD (Ha) RMSE (Ha) r2
Monthly 156 500 851 0.6
Quarterly 52 916 1227 0.7
Figure 4 Spatial distribution of paddy rice planting season (top) and harvesting season (bottom) in the Northern West Java Province.
In the subdistrict-level comparisons, the correlations in the harvested area estimates between MODIS and statistical data were moderate, with r2=0.6 for monthly area (significant at p<0.0001), r2=0.7 for quarterly area (significant at p<0.0001), and r2=0.6 for yearly data (significant at p <0.001) (Figure 4). We used the mean deviation (MD) and the root mean square error (RMSE) as alternatives statistical measures to compare the datasets. The MD were 500 Ha
Figure 5 Subdistrict-level comparisons of monthly (top), quarterly (center), and yearly (bottom) paddy rice harvested area in the Northern of West Java Province between the MODIS estimation and statistical data.
for monthly area, 916 Ha for quarterly area, and 1820 Ha for yearly area, respectively (Table 1). The RMSE were 851 Ha, 1227 Ha, and 2433 Ha for monthly, quarterly, and yearly harvested area respectively. The monthly
harvested area estimates were less accurate than quarterly and yearly area. This was possibly caused by the class ranges used in classifying harvesting dates. Forty six 8-day composites MODIS data had to be classified into 12 classes, to represent 12 months of a year. This caused the class ranges could not represent the number of day in a month exactly. Totaling monthly data into quarterly and yearly data has reduced the effect of the uncertainty in determining the limit of the monthly class ranges. Besides, MODIS 8-day composites are generated by selecting the date with the minimum value of blue band (the clearest atmospheric condition) within an 8-day period for each individual pixel. This compositing method could potentially omit some observations associated with the heading, planting, and harvesting periods.
Generally, area of a parcel of paddy fields in Indonesia is less than about 0.5 Ha. The 500-m resolution of MODIS data is definitely not only consist of paddy fields but mixed with other objects such as fishpond, road, house, etc. We still face problems in detecting paddy rice phenological stages in mix-pixels. Although the 500-m resolution of MODIS data is too coarse to represent individual paddy field parcels, but it is appropriate to use the data for monitoring paddy fields on a regional scale. The phenological stages of paddy rice detected from MODIS data could be utilized for estimating planted and harvested area and to predict the production of paddy rice.
4
Conclusions
In this study, we have developed a systematic method for detecting the phenological stages of paddy rice from timeseries MODIS data. We used a temporal profile analysis of MODIS-derived vegetation indices, EVI and LSWI, to identify paddy rice phenological stages. Our simple algorithm can determine the heading, planting, and harvesting dates in paddy fields. The algorithm has been applied in the northern of West Java Province, comprises 5 districts. The estimation was validated against statistical data from the Office of Agriculture of the regencies. The root mean square errors of the estimated paddy rice harvested area against the statistical data were: 851 Ha for monthly data, 1227 Ha for quarterly data, and 2433 Ha for yearly data. The estimated paddy rice harvested area of quarterly and yearly data had better accurary than monthly data. This was possibly caused by the temporal resolution of the MOD09A1 dataset. MODIS 8-day composites are generated by selecting the date with the minimum value of blue band (the clearest atmospheric condition) within an 8-day period for each individual pixel. This compositing method could potentially omit some observations associated with the heading, planting, and harvesting periods. A complete one-year dataset of MOD09A1 data consists of forty-six 8-day composites data, hence it is rather difficult to determine the monthly class ranges exactly. The results from this MODIS data analysis in the northern part
of West Java have demonstrated its potential for detecting paddy rice phenological stages at regional scale. The planting and harvesting dates estimated from the analysis could be utilized to estimate planted and harvested area and to assess paddy rice production accordingly. At the present time, various problems including the mix-pixel effect remain.
References
[1] Kimball, J., McDonald, K., Running, S., & Frolking, S. Satellite Radar Remote Sensing of Seasonal Growing Seasons for Boreal and Subalpine Evergreen Forests, Remote Sensing of Environment, 90, 243-258, 2004. [2] Bauman, B., Kropff, M., Tuong, T., Wopereis, M., Berge, H., & Laar, H.,
ORYZA2000: Modeling lowland rice. Manila, Philippines’ IRRI, 2001.
[3] Digkuhn, M. & Gal, P., Effect of Drainage Date on Yield and Dry Matter Partitioning in Irrigated Rice, Field Crops Research, 46, 117-126, 1996. [4] Uchida, S., Monitoring of Paddy Rice Planting with Complex Cropping
Pattern Using Satellite Remote Sensing Data – A Case of West Java, Indonesia, in Proceedings of the 28th Asian Conference on Remote Sensing (ACRS), 12-16 November 2007, Kuala Lumpur, Malaysia, 2007,
http://www.a-a-r-s.org/acrs/ proceeding/ACRS2007/Papers/TS1.1.pdf,
(15 September 2009).
[5] Xiao, X., Boles, S., Liu, J., Zhuang, D., Frolking, S., Li, C., Sales, W., & Moore III, B., Mapping Paddy Rice Agriculture in Southern China Using Multi-Temporal MODIS Images, Remote Sensing of Environment, 95, 480-492, 2005.
[6] Xiao, X., Boles, S., Frolking, S., Li, C., Babu, J.Y., Sales, W. & Moore III, B., Mapping Paddy Rice Agriculture in South and Southeast Asia Using Multi-Temporal MODIS images, Remote Sensing of Environment,
100, 95-113, 2006.
[7] Xiao, X., Boles, S., Frolking, S., Salas,W., Moore III, B., Li, C., et al.,
Observation of Flooding and Rice Transplanting of Paddy Rice Fields at The Site to Landscape Scales in China using VEGETATION Sensor Data,
International Journal of Remote Sensing, 23, 3009-3022, 2002.
[8] Maki, M., Ishiahra, M., & Tamura, M., Estimation of Leaf Water Status to Monitor The Risk of Forest Fires by Using Remotely Sensed Data,
Remote Sensing of Environment, 90, 441-450, 2004.
[9] Sakamoto, T., Yokozawa, M., Toritani, H., Shibayama, M., Ishitsuka, N. & Ohno, H., A Crop Phenology Detection Method Using Time-Series MODIS data, Remote Sensing of Environment, 96, 366-374, 2005. [10] Sakamoto, T., Nguyen, N.V., Ohno, H., Ishitsuka, N. & Yokozawa, M.,
Spatio-Temporal Distribution of Rice Phenology and Cropping Systems in The Mekong Delta With Special Reference to The Seasonal Water Flow
of The Mekong and Bassac Rivers, Remote Sensing of Environment, 100, 1-16, 2006.
[11] Indonesian Agency for Agricultural Research and Development (IAARD), Cropping Calendar for Food Crop, Ministry of Agriculture – Indonesia, 2008.
[12] Vermote, E.F., Kotchenova, S.Y. & Ray, J.P., MODIS Surface Reflectance User’s GuideVersion 1.2., MODIS Land Surface Reflectance Science Computing Facility, http://modis-sr.ltdri.org, (5 July 2008). [13] Huete, A. R., Liu, H. Q., Batchily, K., & van Leeuwen, W., A
Comparison of Vegetation Indices Global Set of TM Images for EOSMODIS, Remote Sensing of Environment, 59, 440-451, 1997.
[14] Huete, A., Didan, K., Miura, T., Rodriguez, E. P., Gao, X., & Ferreira, L. G., Overview of The Radiometric and Biophysical Performance of The MODIS Vegetation Indices, Remote Sensing of Environment, 83, 195-213, 2002.
[15] Le Toan, T., Ribbes, F., Wang, L., Floury, N., Ding, K., Kong, J., et al.,
Rice Crop Mapping and Monitoring Using ERS-1 Data Based on Experiment and Modeling Results, IEEE Transactions on Geoscience and Remote Sensing, 1, 41-56, 1997.
[16] Domiri, D.D., Adhyani, N.L. & Nugraheni, S., Paddy Rice Growth Model Using MODIS Data for Estimating Paddy Rice Age, in Proceedings of the 14th PIT MAPIN, 14-15 September 2005, Surabaya, Indonesia, 2005. (in Bahasa Indonesia)
[17] Wahyunto, Ritung, S., & Widagdo, Remote Sensing Technology for Land Resource Inventory and Monitoring Efficiency, Final Report, Indonesian Center for Agricultural Research and Development, Ministry of Agriculture of the Republic of Indonesia, 2003. (in Bahasa Indonesia) [18] FAO, Agro-ecological Zoning Guidelines. FAO Soils Bulletin 73, FAO,
Rome, 1996.
[19] Hermanto, Ciherang Paddy Variety is Becoming More Popular, Warta Penelitian dan Pengembangan Pertanian, 28(2), 2006. (in Bahasa Indonesia)
[20] Vermote, E.F., & Vermeulen, A., MODIS Algorithm Technical
Background Document, Atmospheric Correction Algorithm: Spectral Reflectances (MOD09). NASA contract NAS5-96062, 1999.