Open Access
Research article
Transcriptional response of rat frontal cortex following acute In Vivo
exposure to the pyrethroid insecticides permethrin and
deltamethrin
Joshua A Harrill
1, Zhen Li
2, Fred A Wright
2, Nicholas M Radio
3,
William R Mundy
3, Rogelio Tornero-Velez
4and Kevin M Crofton*
3Address: 1Curriculum in Toxicology, University of North Carolina at Chapel Hill, Chapel Hill, North Carolina, USA, 2Department of Biostatistics and the Carolina Environmental Bioinformatics Research Center, University of North Carolina at Chapel Hill, Chapel Hill, North Carolina, USA, 3Neurotoxicology Division, National Health and Environmental Effects Research Laboratory, Office of Research and Development, United State Environmental Protection Agency, Research Triangle Park, North Carolina, USA and 4Human Exposure and Atmospheric Sciences Division, National Exposure Research Laboratory, Office of Research and Development, United States Environmental Protection Agency, Research Triangle Park, North Carolina, USA
Email: Joshua A Harrill - [email protected]; Zhen Li - [email protected]; Fred A Wright - [email protected];
Nicholas M Radio - [email protected]; William R Mundy - [email protected]; Rogelio Tornero-Velez - [email protected]; Kevin M Crofton* - [email protected]
* Corresponding author
Abstract
Background: Pyrethroids are neurotoxic pesticides that interact with membrane bound ion channels in neurons and
disrupt nerve function. The purpose of this study was to characterize and explore changes in gene expression that occur in the rat frontal cortex, an area of CNS affected by pyrethroids, following an acute low-dose exposure.
Results: Rats were acutely exposed to either deltamethrin (0.3 – 3 mg/kg) or permethrin (1 – 100 mg/kg) followed by
collection of cortical tissue at 6 hours. The doses used range from those that cause minimal signs of intoxication at the behavioral level to doses well below apparent no effect levels in the whole animal. A statistical framework based on parallel linear (SAM) and isotonic regression (PIR) methods identified 95 and 53 probe sets as dose-responsive. The PIR analysis was most sensitive for detecting transcripts with changes in expression at the NOAEL dose. A sub-set of genes (Camk1g, Ddc, Gpd3, c-fos and Egr1) was then confirmed by qRT-PCR and examined in a time course study. Changes in mRNA levels were typically less than 3-fold in magnitude across all components of the study. The responses observed are consistent with pyrethroids producing increased neuronal excitation in the cortex following a low-dose in vivo exposure. In addition, Significance Analysis of Function and Expression (SAFE) identified significantly enriched gene categories common for both pyrethroids, including some relating to branching morphogenesis. Exposure of primary cortical cell cultures to both compounds resulted in an increase (~25%) in the number of neurite branch points, supporting the results of the SAFE analysis.
Conclusion: In the present study, pyrethroids induced changes in gene expression in the frontal cortex near the
threshold for decreases in ambulatory motor activity in vivo. The penalized regression methods performed similarly in detecting dose-dependent changes in gene transcription. Finally, SAFE analysis of gene expression data identified branching morphogenesis as a biological process sensitive to pyrethroids and subsequent in vitro experiments confirmed this predicted effect. The novel findings regarding pyrethroid effects on branching morphogenesis indicate these compounds may act as developmental neurotoxicants that affect normal neuronal morphology.
Published: 18 November 2008
BMC Genomics 2008, 9:546 doi:10.1186/1471-2164-9-546
Received: 7 May 2008 Accepted: 18 November 2008 This article is available from: http://www.biomedcentral.com/1471-2164/9/546
© 2008 Harrill et al; licensee BioMed Central Ltd.
This is an Open Access article distributed under the terms of the Creative Commons Attribution License (http://creativecommons.org/licenses/by/2.0), which permits unrestricted use, distribution, and reproduction in any medium, provided the original work is properly cited.
Background
Pyrethroid insecticides represent a significant percentage of the world insecticide market [1]. This usage results in an increased potential for human exposure. Pyrethroid residues have been detected in sediments from agricul-tural run-off [2], residential dust samples [3] and child-care centers [4]. Pyrethroid metabolites have also been detected in human urine [5]. A major research focus for pyrethroids is determining if compounds belonging to this chemical class act through the same or similar mech-anisms-of-action to produce similar adverse health out-comes [6].
Pyrethroids disrupt nervous system function by interact-ing with membrane bound ion channels and alterinteract-ing their normal gating kinetics [7]. The primary molecular targets of pyrethroids are neuronal voltage-sensitive sodium channels (VSSCs) [6]. Prolongation of whole-cell Na+
cur-rents has been observed in a variety of cultured nervous system tissues exposed to pyrethroids [8-10]. Further-more, in vitro studies utilizing heterologous expression systems have demonstrated that pyrethroids increase sodium current through VSSC isoforms (Nav1.2, Nav1.4 &
Nav1.8), although the complete complement of mamma-lian VSSCs have not been examined for pyrethroid sensi-tivity [11-13]. Pyrethroids may also alter the gating kinetics of both neuronal voltage-sensitive Ca+2 (VGCCs)
and voltage-sensitive Cl- channels [14-17]. Isoforms of all
of the aforementioned molecular targets are expressed in the plasma membrane of mammalian neuronal cells. Pyrethroids affect nervous system function by producing hyperexcitability in neurons and changing neuronal firing rates [18-21]. Acute manifestations of neurotoxicity on mammalian and insect species result from increased neu-ronal hyperexcitability driven by the actions of pyre-throids at their molecular target sites, primarily VSSCs [21]. Under normal conditions, neuronal excitation at the membrane results in the activation of intracellular signal-ing pathways that control the induction of gene expres-sion [22]. In some cases, these transcriptional responses led to persistent adaptive changes in cellular functions (i.e. neuronal plasticity) [23,24]. Neuroactive chemicals that alter firing patterns or disrupt neurotransmission trig-ger the induction of unique groups of gene transcripts which may in turn impact neuronal function [25-27]. While alterations in neuronal excitability are critical events in the toxiciological mechanism-of-action for pyre-throids, the impact of pyrethroid-induced neuronal hyperexcitability on intracellular signaling pathways and inducible gene-regulatory networks is unknown.
The neuronal substrates that mediate acute pyrethroid neurotoxicity in vivo are unknown and it is likely that mul-tiple brain regions are involved. However, previous
stud-ies have demonstrated rapid accumulation of pyrethroids in the cortex following an acute oral dose, disruption of cortical neuronal firing patterns both in vivo and in vitro, and induction of gene products known to be upregulated following neuronal excitation [18,28-32]. Presently, the cortex is one of the few brain regions where pharmacoki-netic, electrophysiological and biochemical data are avail-able for pyrethroids. These data provide a significant weight of evidence that this brain region may be sensitive to acute pyrethroid exposures. The present study aims to characterize the effects of acute pyrethroid exposure on gene expression in the cortex.
In the present study Affymetrix GeneChip® microarrays
were used to characterize the global transcriptional response of rat frontal cortex following an acute oral expo-sure to two model pyrethroids: permethrin and deltame-thrin. The dose ranges used included doses that cause minimal neurotoxic signs, as well as doses below apparent 'no adverse effect levels' (NOAEL) in in vivo behavioral studies of motor function [33]. Differences in potency between the two compounds are due to differing pharma-cokinetic profiles and likely varying pharmacodynamic activities [12,28,30,32]. In the present study, low doses were used to minimize any potential transcriptional changes which may be due solely to excessive systemic toxicity at high pyrethroid doses. Primary goals of this study were to: 1) to use a previously established linear regression (SAM) and a novel isotonic (PIR) regression method [34,35] as discovery and prioritization tools for identification of dose-dependent changes in gene tran-scription, and 2) to compare the performance of these methods, 3) to confirm pyrethroid-sensitive transcrip-tional changes in a selected sub-set of genes using qRT-PCR, 4) to examine the time course of these changes and 5) to utilize functional category level analysis (SAFE) [36] to identify pyrethroid sensitive cellular processes.
Dose-dependent changes in the transcription of several genes (Camk1g, Ddc, Gpd3, c-fos and Egr1) were discov-ered and successfully confirmed. Data from qRT-PCR experiments demonstrated clear qualitative similarities in the transcriptional response produced by both com-pounds. In addition, based on the SAFE analysis results, the hypothesis that pyrethroids can affect neuronal branching morphology was tested in an in vitro model of cortical neuron development. An increase (~25%) in the number of neuronal branch points was observed. This may represent a novel aspect of pyrethroid neurotoxicity that to date has not been examined.
Methods
Chemicals
Permethrin (92.0% purity, isomer composition: 40% cis, 60% trans, 1:1 ratio of 1R & 1S) and deltamethrin (98.9%
purity, isomer composition: 100% 1R, 3R, αS) were gen-erously donated by FMC Corporation (Philadelphia, PA) and Bayer Cropscience (Research Triangle Park, NC), respectively. Pyrethroids were dissolved in corn oil (Sigma-Aldrich, St. Louis, MO) at 1, 10, 40 & 100 mg/mL permethrin and 0.3, 1 & 3 mg/mL deltamethrin. Dosing volume was 1 mL/kg.
Animal Care and Treatment
Male Long-Evans rats (49–62 days of age) were obtained from Charles River Laboratories (Wilmington, MA) Hous-ing conditions were identical to those used in Wolansky et al. (2006) [33]. The facility was approved by the American Association for Accreditation of Laboratory Animal Care (AAALAC) and all experimental procedures were approved in advance by the US EPA, NHEERL Animal Care and Use Committee.
Four cohorts of animals were used in this study (Table 1). Cohort 1 was used for preliminary data collection to dem-onstrate that the selected doses of the two compounds would alter gene transcription. Cohort 2 replicated these findings and expanded group sizes. Cohorts 1 & 2 were combined for microarray data analyses. Cohort 3 was examined exclusively by quantitative real-time RT-PCR (qRT-PCR). These dose-response cohorts (#1,2,3) were exposed on separate days. All dosing occurred between 06:30 and 07:00 hours, counterbalanced across time of day, and the last test subject euthanized before 18:00 hours. Cohort 4 was used in qRT-PCR time course studies and dosed with 3 mg/kg deltamethrin, 100 mg/kg per-methrin or vehicle. Each time point contained pyrethroid-treated and time-matched vehicle controls and all test subjects were dosed and euthanized between 07:30 & 17:30 hours. In all cohorts, test subjects were removed from the colony suite 1 h prior to dosing and allowed to
acclimate in a quiet holding room maintained under sim-ilar environmental conditions. Subjects were adminis-tered a single oral dose of test compound by gavage and allowed to recover in their home cage prior to euthanasia at 6 h (dose-response studies) or 1, 3, 6 or 9 h (time course studies). Subjects were removed to an adjoining suite with a separate HVAC system for euthanasia by decapitation. Whole brains were rapidly removed onto a cold plate (4°C). Frontal cortex was dissected and frozen on a bed of dry ice in less than 3 minutes and then stored at -80°C until use.
RNA Extraction
Cortical samples were homogenized in 1 mL of TRI Rea-gent (Molecular Research Center, Inc., Cincinnati, OH) per 50–100 mg of tissue using a Polytron® PT-K
homoge-nizer (Kinematica, Lucerne, Switzerland) and total RNA was isolated per manufacturer's instructions. Total RNA pellets suspended in DEPC-treated H2O were then subject to DNase I treatment and re-extracted with acid:phenol chloroform, pH = 4.7 (Ambion Inc., Austin, TX) and chlo-roform according to manufacturer's protocol and re-sus-pended in DEPC-treated H2O until use. The total RNA
concentration of each sample was determined (absorb-ance @ 260 nm) on a Beckman-Coulter DU® 800
spectro-photometer (Fullerton, CA) and adjusted to 1.0 μg/μL prior to sample storage at -80°C. The ratio of absorbance values at 260 nm and 280 nm (Ab 260/280) was used to assess purity of total RNA samples and a cut-off of > 1.6 was used (greater than 85% of the samples were > 1.7). Preliminary PCR experiments using primers for rat β-actin genomic DNA (outlined in [37]) demonstrated that the above protocol adequately prevents genomic DNA con-tamination of total RNA samples (data not shown). RNA integrity of each sample was determined using an Agilent 2100 Bioanalyzer and RNA 6000 Nano LabChip Kit
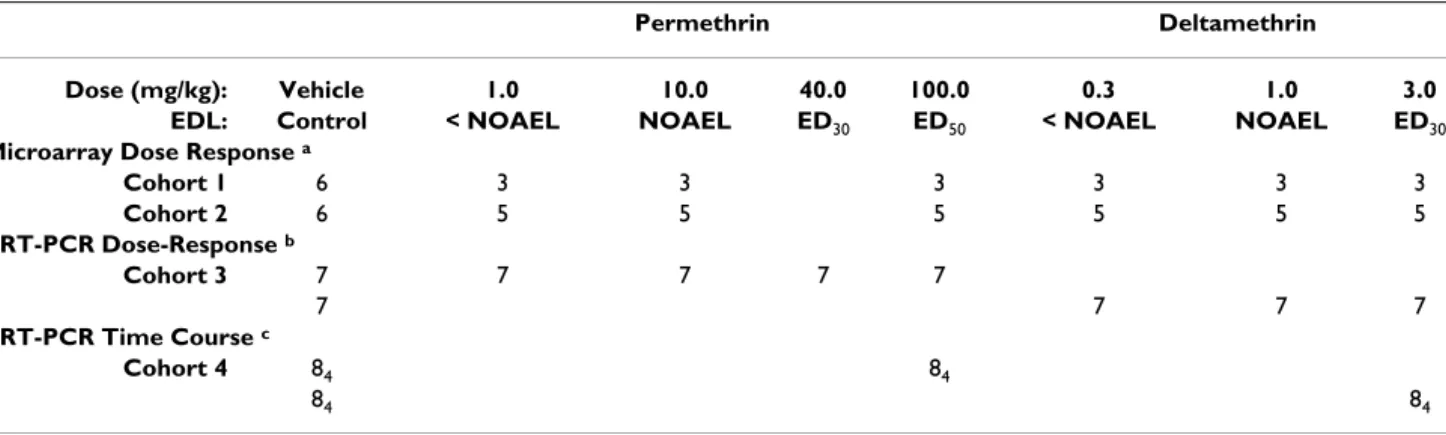
Table 1: Group sizes of cohorts used in this study.
Permethrin Deltamethrin
Dose (mg/kg): Vehicle 1.0 10.0 40.0 100.0 0.3 1.0 3.0 EDL: Control < NOAEL NOAEL ED30 ED50 < NOAEL NOAEL ED30 Microarray Dose Response a
Cohort 1 6 3 3 3 3 3 3 Cohort 2 6 5 5 5 5 5 5 qRT-PCR Dose-Response b Cohort 3 7 7 7 7 7 7 7 7 7 qRT-PCR Time Course c Cohort 4 84 84 84 84
a Microarray data from Cohorts 1 & 2 were combined (n = 8/treatment group) with control values from cohorts 1 & 2 (n = 12) for dose-response analysis of permethrin and deltamethrin mediated effects, respectively. b Test animals in Cohort 3 were split into two dose-response studies for permethrin and deltamethrin, respectively, for qRT-PCR confirmation of gene expression changes observed during the microarray study. c Test animals in Cohort 4 were used for qRT-PCR time course studies. Four time points (1,3,6,9 hours: n = 8/treatment group) per compound with time matched controls (n = 8/control group). NOAEL = no observable adverse effect level; < NOAEL = less than no observable adverse effect level.
(Waldbron, Germany) according to manufacturer's instructions. All samples used in microarray and qRT-PCR experiments had a RNA Integrity Number (RIN) > 8.0 (data not shown). Aliquots of each RNA sample (1 μg/μL for microarray hybridization or 25 ng/μL for qRT-PCR assays) were stored at -80°C until use.
Microarray sample preparation and data collection
All protocols for microarray sample preparation (except total RNA extraction, as above), Affymetrix Rat Genome 230 2.0 GeneChip® hybridization, array scanning and data
collection were performed by Expression Analysis, Inc., (Durham, NC) according to standard Affymetrix proto-cols. Synthesis and clean-up of biotin-labeled cRNA was performed using a BioArray™ High Yield™ RNA transcript labeling kit (Enzo Life Sciences, Farmingdale, NY) and Qiagen RNeasy spin columns (Spoorstraat, Netherlands), respectively, according to manufacturer's instructions. Hybridizations were performed in an Affymetrix Hybridi-zation Oven 640. Washes were performed on an Affyme-trix Fluidics Station 450 using the EukGE-WS2v4-450 fluidics script. GeneChips® were scanned using an
Affyme-trix GeneChip® 3000 Scanner with the GCOS v1.2
soft-ware package. Target intensity was set to a value of 500 with all other scanning parameters set at the factory defaults. The 3'/5' ratios for GAPDH and β-actin internal controls genes ranged between 0.93 – 1.11 and 1.2 – 2.01, respectively for all samples, indicating that degradation of RNA did not occur. The intensity of hybridization controls (BioB, BioC, BioD and Cre) increased linearly on all arrays. Gene expression profiles for this experiment have been archived in the NCBI Gene Expression Omnibus (GEO) repository with the series accession number GSE7955.
Microarray Data Analysis
Expression summaries were calculated using RMAExpress©
v4.7 (University of California at Berkeley). Consistent with previous reports, Robust Multiarray Average (RMA) [38] provided less within group variation in expression summary values as compared to GeneChip® Operating
Software v1.2 (GCOS) [39] (see Additional file 1). Analysis of dose-response relationships were performed using Significance Analysis of Microarrays (SAM, version 2.21) [34], with the quantitative/linear regression mode-ling component [40]. In addition to identifying dose-responsive genes, SAM provides permutation-based esti-mates of the false-discovery rate (FDR) associated with lists of genes for which the null hypothesis is rejected. The SAM statistic (di) penalizes lowly expressed genes, and is most powerful when the dose-response function is nearly linear in the range examined. To potentially increase power and account for non-linearity in dose-response relationships, the SAM analyses were supplemented by penalized isotonic regression (PIR) according to the
method of Hu et al. (2005) [35] which was specifically designed for microarray analysis. Similar to SAM, PIR penalizes lowly expressed genes and provides a permuta-tion-based estimate of the false discovery rate. In contrast to SAM, PIR allows for the dose-response relationship to be nonlinear, but assumes the relationship is increasing or decreasing as a function of increasing dose, and not the reverse direction. This method results in a score (the Mi -statistic) for each probe set that quantifies the evidence for an increasing or decreasing dose-response relationship. To insure that the rigorously conservative, permutation-based approaches for controlling Type I error did not exclude true positive probe sets with dose-dependent increases or decreases in expression, an additional analy-sis was conducted with each regression model. Empirical
p-values from the PIR analysis or SAM analysis were used
to filter out probe sets with no apparent dose-related changes in expression (threshold p-value < 0.01). The reduced group of probe sets were then analyzed using a one-way analysis of variance (ANOVA) followed by a Ben-jamini-Hochberg correction for control of multiple com-parisons. Dose was used as the independent factor. Probe sets meeting the Benjamini-Hochberg correction at FDR < 0.05 were included in the gene lists of interest for each compound, analysis of dose thresholds for transcriptional changes and the comparison of effects between com-pounds. For probe sets that passed the one-way ANOVA significance threshold, a post-hoc Dunnett's multiple-comparison mean contrast test was performed comparing the means of the respective dose groups to the mean of the control group [41]. Regression analyses were performed using R© version 2.3.0 statistical computing analysis
soft-ware. Dunnett's tests were performed using SAS v8.1 (SAS Institute, Inc., Cary, NC).
Quantitative real-time RT-PCR
In selecting candidates for qRT-PCR confirmation, prefer-ence was given to probe sets highly ranked by the penal-ized regression methods and corresponding to transcripts with known protein-coding RefSeq accession numbers (Tables 2 &3). qRT-PCR for each transcript of interest was performed using TaqMan® One-Step RT-PCR Master Mix
Reagent Kits and TaqMan® Gene Expression Assays on an
ABI 7900HT Sequence Detection System (Applied Biosys-tems, Foster City, CA) according to manufacturer's instructions and using a 384 well plate format. Each sam-ple was measured in triplicate for each transcript of inter-est and an internal reference gene. Reaction plates were maintained at 5°C during the loading procedure. Reac-tions were incubated at 48°C for 45 min followed by incubation at 95°C for 10 min and 40 cycles of 94°C for 25 sec followed by 60°C for 1 min. qRT-PCR assays were designed via the Applied Biosystems (ABI) primer/probe selection algorithm and bioinformatics pipeline [42].
Amplification efficiencies for each assay was calculated as previously described using a serial dilution of pooled total RNA from rat frontal cortex [43]. Assay identification numbers, context sequences, amplicon lengths and calcu-lated amplification efficiencies are listed in Additional file 2.
qRT-PCR data from deltamethrin and permethrin dose-response and time course studies were analyzed according to the 2-ΔΔC
T method as described by Livak and Schmittgen
(2001) [44]. β-actin expression did not change as a func-tion of time or dose for either compound (data not shown) and was used at the internal reference for all 2-ΔΔC
T
calculations. Data are expressed as 2-ΔΔC
T ± standard error
(SE) which is an approximation of fold-change from the calibrator group (i.e. vehicle control). For dose-response studies (Table 4), the mean ΔΔC
T of vehicle treated
con-trols were used as the 2-ΔΔC
T calibrator [44]. For time
course studies, the mean ΔΔC
T of vehicle treated controls
were used as the 2-ΔΔC
T calibrator within each
time-matched treatment group.
Data from Wolansky et al. (2006) [33] were used to assign equipotent dose-levels (EDL) to the administered doses used in the present study to provide a comparative dose-metric between the two test compounds (see Table 1). Sta-tistical analysis of qRT-PCR dose response data was per-formed using a two-way ANOVA with compound and
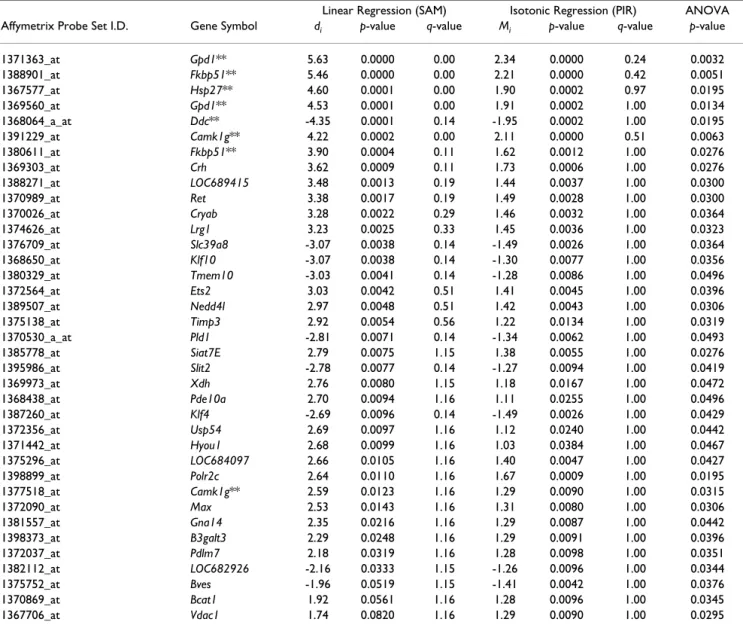
Table 2: Probe sets identified as dose-responsive for deltamethrin.
Linear Regression (SAM) Isotonic Regression (PIR) ANOVA Affymetrix Probe Set I.D. Gene Symbol di p-value q-value Mi p-value q-value p-value
1371363_at Gpd1** 5.63 0.0000 0.00 2.34 0.0000 0.24 0.0032 1388901_at Fkbp51** 5.46 0.0000 0.00 2.21 0.0000 0.42 0.0051 1367577_at Hsp27** 4.60 0.0001 0.00 1.90 0.0002 0.97 0.0195 1369560_at Gpd1** 4.53 0.0001 0.00 1.91 0.0002 1.00 0.0134 1368064_a_at Ddc** -4.35 0.0001 0.14 -1.95 0.0002 1.00 0.0195 1391229_at Camk1g** 4.22 0.0002 0.00 2.11 0.0000 0.51 0.0063 1380611_at Fkbp51** 3.90 0.0004 0.11 1.62 0.0012 1.00 0.0276 1369303_at Crh 3.62 0.0009 0.11 1.73 0.0006 1.00 0.0276 1388271_at LOC689415 3.48 0.0013 0.19 1.44 0.0037 1.00 0.0300 1370989_at Ret 3.38 0.0017 0.19 1.49 0.0028 1.00 0.0300 1370026_at Cryab 3.28 0.0022 0.29 1.46 0.0032 1.00 0.0364 1374626_at Lrg1 3.23 0.0025 0.33 1.45 0.0036 1.00 0.0323 1376709_at Slc39a8 -3.07 0.0038 0.14 -1.49 0.0026 1.00 0.0364 1368650_at Klf10 -3.07 0.0038 0.14 -1.30 0.0077 1.00 0.0356 1380329_at Tmem10 -3.03 0.0041 0.14 -1.28 0.0086 1.00 0.0496 1372564_at Ets2 3.03 0.0042 0.51 1.41 0.0045 1.00 0.0396 1389507_at Nedd4l 2.97 0.0048 0.51 1.42 0.0043 1.00 0.0306 1375138_at Timp3 2.92 0.0054 0.56 1.22 0.0134 1.00 0.0319 1370530_a_at Pld1 -2.81 0.0071 0.14 -1.34 0.0062 1.00 0.0493 1385778_at Siat7E 2.79 0.0075 1.15 1.38 0.0055 1.00 0.0276 1395986_at Slit2 -2.78 0.0077 0.14 -1.27 0.0094 1.00 0.0419 1369973_at Xdh 2.76 0.0080 1.15 1.18 0.0167 1.00 0.0472 1368438_at Pde10a 2.70 0.0094 1.16 1.11 0.0255 1.00 0.0496 1387260_at Klf4 -2.69 0.0096 0.14 -1.49 0.0026 1.00 0.0429 1372356_at Usp54 2.69 0.0097 1.16 1.12 0.0240 1.00 0.0442 1371442_at Hyou1 2.68 0.0099 1.16 1.03 0.0384 1.00 0.0467 1375296_at LOC684097 2.66 0.0105 1.16 1.40 0.0047 1.00 0.0427 1398899_at Polr2c 2.64 0.0110 1.16 1.67 0.0009 1.00 0.0195 1377518_at Camk1g** 2.59 0.0123 1.16 1.29 0.0090 1.00 0.0315 1372090_at Max 2.53 0.0143 1.16 1.31 0.0080 1.00 0.0306 1381557_at Gna14 2.35 0.0216 1.16 1.29 0.0087 1.00 0.0442 1398373_at B3galt3 2.29 0.0248 1.16 1.29 0.0091 1.00 0.0396 1372037_at Pdlm7 2.18 0.0319 1.16 1.28 0.0098 1.00 0.0351 1382112_at LOC682926 -2.16 0.0333 1.15 -1.26 0.0096 1.00 0.0344 1375752_at Bves -1.96 0.0519 1.15 -1.41 0.0042 1.00 0.0376 1370869_at Bcat1 1.92 0.0561 1.16 1.28 0.0096 1.00 0.0345 1367706_at Vdac1 1.74 0.0820 1.16 1.29 0.0090 1.00 0.0295
** = genes examined by qRT-PCR. Positive SAM di or PIR Mi scores denote upregulated probe sets. Negative SAM di or PIR Mi scores denote downregulated probe sets. A full list of probe sets altered by deltamethrin exposure, including predicted protein coding sequences and expressed sequence tags is given in Additional file 3.
equipotent dose level (EDL) as independent variables and 2-ΔΔC
T as the dependent variable followed by Dunnett's
mean contrast test. Transcripts with a significant com-pound by EDL interaction were further analyzed using a one-way ANOVA with dose as the independent variable followed by Dunnett's mean contrast test. Statistical anal-ysis of time course data was performed using a two-way ANOVA with time and treatment as independent variables and 2-ΔΔC
T as the dependent variable. Transcripts with a
significant time*treatment interaction (p < 0.05) were additionally analyzed with a one-way ANOVA at each time point with treatment as the independent variable (p < 0.05).
Significance Analysis of Function and Expression (SAFE)
The SAFE method was used to identify pathways/func-tional categories whose genes are coordinately regulated in a dose-dependent manner [36]. SAFE is similar to other pathway enrichment procedures (e.g. DAVID) [45], but accounts for correlation in gene expression within path-ways using array permutation to rigorously control error rates. SAFE and accompanying array annotation were loaded from Bioconductor v.1.8 [46]. SAFE tests for enrichment of significant dose-response relationships for genes within each pathway. Following calculation of lin-ear regression dose-response p-values for each gene, only genes with a nominal p-value < 0.05 were used to form the gene list to which the enrichment analysis was performed. SAFE [47] enables the user to define a pathway enrich-ment statistic and a Pearson test of binomial proportions
was then implemented [48]. The Pearson statistics is sim-ilar to Fisher's exact test commonly employed in pathway enrichment testing (GSEA) [49], but does not consider the number of significant genes to have been fixed a priori [50]. 10,000 permutations of dose levels were used by SAFE to assess the significance of the entire procedure, using the Yekutieli and Benjamini (1999) procedure to control the FDR while accounting for the multiple path-ways/categories [51]. All categories with an estimated FDR < 0.1 are reported in Table 5.
Combining pathway evidence for the two pyrethroids
One aim of using the SAFE statistical methods in this study was to identify gene categories showing enrichment for dose-responsiveness for both permethrin and deltam-ethrin. The Fisher combined p-value method allows accrual of evidence across multiple hypotheses, and thus is ideal for testing combined evidence for enrichment of each pathway for both chemicals [52]. Under the null hypothesis that neither chemical shows enrichment for the pathway, each of the two p-values is uniform [0,1], and the Fisher statistic
S = -2(ln(pdelta)+ln(pnorm))
is distributed as . The Fisher approach has favorable optimality properties [53] and results in a new (com-bined) p-value for each pathway. For the multiple path-ways tested, the Benjamini-Hochberg (1995) method was
χ22
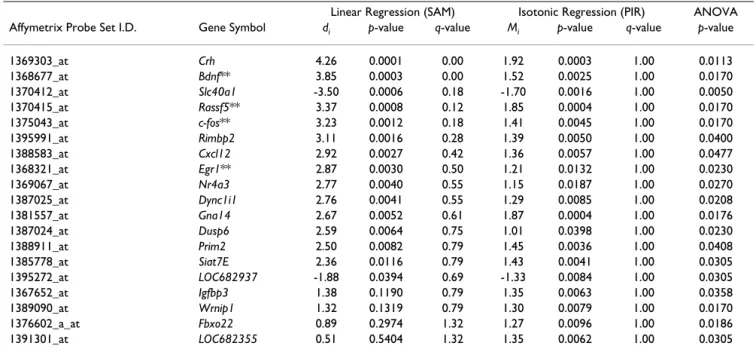
Table 3: Probe sets identified as dose-responsive for permethrin.
Linear Regression (SAM) Isotonic Regression (PIR) ANOVA Affymetrix Probe Set I.D. Gene Symbol di p-value q-value Mi p-value q-value p-value
1369303_at Crh 4.26 0.0001 0.00 1.92 0.0003 1.00 0.0113 1368677_at Bdnf** 3.85 0.0003 0.00 1.52 0.0025 1.00 0.0170 1370412_at Slc40a1 -3.50 0.0006 0.18 -1.70 0.0016 1.00 0.0050 1370415_at Rassf5** 3.37 0.0008 0.12 1.85 0.0004 1.00 0.0170 1375043_at c-fos** 3.23 0.0012 0.18 1.41 0.0045 1.00 0.0170 1395991_at Rimbp2 3.11 0.0016 0.28 1.39 0.0050 1.00 0.0400 1388583_at Cxcl12 2.92 0.0027 0.42 1.36 0.0057 1.00 0.0477 1368321_at Egr1** 2.87 0.0030 0.50 1.21 0.0132 1.00 0.0230 1369067_at Nr4a3 2.77 0.0040 0.55 1.15 0.0187 1.00 0.0270 1387025_at Dync1i1 2.76 0.0041 0.55 1.29 0.0085 1.00 0.0208 1381557_at Gna14 2.67 0.0052 0.61 1.87 0.0004 1.00 0.0176 1387024_at Dusp6 2.59 0.0064 0.75 1.01 0.0398 1.00 0.0230 1388911_at Prim2 2.50 0.0082 0.79 1.45 0.0036 1.00 0.0408 1385778_at Siat7E 2.36 0.0116 0.79 1.43 0.0041 1.00 0.0305 1395272_at LOC682937 -1.88 0.0394 0.69 -1.33 0.0084 1.00 0.0305 1367652_at Igfbp3 1.38 0.1190 0.79 1.35 0.0063 1.00 0.0358 1389090_at Wrnip1 1.32 0.1319 0.79 1.30 0.0079 1.00 0.0170 1376602_a_at Fbxo22 0.89 0.2974 1.32 1.27 0.0096 1.00 0.0186 1391301_at LOC682355 0.51 0.5404 1.32 1.35 0.0062 1.00 0.0305
** = genes examined by qRT-PCR. Positive SAM di or PIR Mi scores denote upregulated probe sets. Negative SAM di or PIR Mi scores denote downregulated probe sets. A full list of probe sets altered by deltamethrin exposure, including predicted protein coding sequences and expressed sequence tags is given in Additional file 4.
applied to control the false discovery rate (FDR < 0.1) [54].
Fisher's statistic can be asymmetrically sensitive to very small p-values for a single chemical, even if the results for the other chemical are not significant. Thus, among path-ways with a significant Fisher statistic, the focus was placed on those which showed SAFE p-values < 0.05 for both chemicals.
Cell culture and treatment
Cortical cultures containing neurons and glia were pre-pared from neocortices of newborn rat pups according to the protocol used by Chandler et al. (1993) with modifi-cations [55]. Neocortices were harvested under sterile con-ditions in a buffer solution containing 137 mM NaCl, 5 mM KCl, 170 μM Na2HPO4, 205 μM KH2PO4, 5 mM glu-cose, 59 mM sucrose, 100 U/ml penicillin and 0.1 mg/ml streptomycin, pH 7.4. The cortices were minced with scis-sors and digested using 0.25% trypsin for 5 minutes, then with addition of 0.016% DNase for a further 5 minutes at
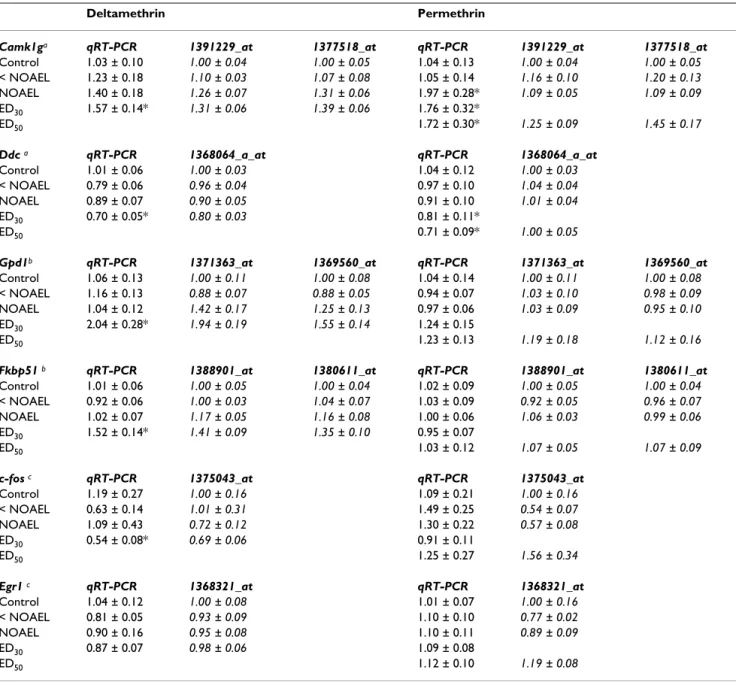
Table 4: qRT-PCR confirmation of transcripts identified as dose-responsive.
Deltamethrin Permethrin
Camk1ga qRT-PCR 1391229_at 1377518_at qRT-PCR 1391229_at 1377518_at Control 1.03 ± 0.10 1.00 ± 0.04 1.00 ± 0.05 1.04 ± 0.13 1.00 ± 0.04 1.00 ± 0.05 < NOAEL 1.23 ± 0.18 1.10 ± 0.03 1.07 ± 0.08 1.05 ± 0.14 1.16 ± 0.10 1.20 ± 0.13 NOAEL 1.40 ± 0.18 1.26 ± 0.07 1.31 ± 0.06 1.97 ± 0.28* 1.09 ± 0.05 1.09 ± 0.09 ED30 1.57 ± 0.14* 1.31 ± 0.06 1.39 ± 0.06 1.76 ± 0.32* ED50 1.72 ± 0.30* 1.25 ± 0.09 1.45 ± 0.17 Ddc a qRT-PCR 1368064_a_at qRT-PCR 1368064_a_at Control 1.01 ± 0.06 1.00 ± 0.03 1.04 ± 0.12 1.00 ± 0.03 < NOAEL 0.79 ± 0.06 0.96 ± 0.04 0.97 ± 0.10 1.04 ± 0.04 NOAEL 0.89 ± 0.07 0.90 ± 0.05 0.91 ± 0.10 1.01 ± 0.04 ED30 0.70 ± 0.05* 0.80 ± 0.03 0.81 ± 0.11* ED50 0.71 ± 0.09* 1.00 ± 0.05
Gpd1b qRT-PCR 1371363_at 1369560_at qRT-PCR 1371363_at 1369560_at Control 1.06 ± 0.13 1.00 ± 0.11 1.00 ± 0.08 1.04 ± 0.14 1.00 ± 0.11 1.00 ± 0.08
< NOAEL 1.16 ± 0.13 0.88 ± 0.07 0.88 ± 0.05 0.94 ± 0.07 1.03 ± 0.10 0.98 ± 0.09
NOAEL 1.04 ± 0.12 1.42 ± 0.17 1.25 ± 0.13 0.97 ± 0.06 1.03 ± 0.09 0.95 ± 0.10
ED30 2.04 ± 0.28* 1.94 ± 0.19 1.55 ± 0.14 1.24 ± 0.15
ED50 1.23 ± 0.13 1.19 ± 0.18 1.12 ± 0.16
Fkbp51 b qRT-PCR 1388901_at 1380611_at qRT-PCR 1388901_at 1380611_at Control 1.01 ± 0.06 1.00 ± 0.05 1.00 ± 0.04 1.02 ± 0.09 1.00 ± 0.05 1.00 ± 0.04
< NOAEL 0.92 ± 0.06 1.00 ± 0.03 1.04 ± 0.07 1.03 ± 0.09 0.92 ± 0.05 0.96 ± 0.07
NOAEL 1.02 ± 0.07 1.17 ± 0.05 1.16 ± 0.08 1.00 ± 0.06 1.06 ± 0.03 0.99 ± 0.06
ED30 1.52 ± 0.14* 1.41 ± 0.09 1.35 ± 0.10 0.95 ± 0.07
ED50 1.03 ± 0.12 1.07 ± 0.05 1.07 ± 0.09
c-fos c qRT-PCR 1375043_at qRT-PCR 1375043_at Control 1.19 ± 0.27 1.00 ± 0.16 1.09 ± 0.21 1.00 ± 0.16
< NOAEL 0.63 ± 0.14 1.01 ± 0.31 1.49 ± 0.25 0.54 ± 0.07
NOAEL 1.09 ± 0.43 0.72 ± 0.12 1.30 ± 0.22 0.57 ± 0.08
ED30 0.54 ± 0.08* 0.69 ± 0.06 0.91 ± 0.11
ED50 1.25 ± 0.27 1.56 ± 0.34
Egr1 c qRT-PCR 1368321_at qRT-PCR 1368321_at Control 1.04 ± 0.12 1.00 ± 0.08 1.01 ± 0.07 1.00 ± 0.16
< NOAEL 0.81 ± 0.05 0.93 ± 0.09 1.10 ± 0.10 0.77 ± 0.02
NOAEL 0.90 ± 0.16 0.95 ± 0.08 1.10 ± 0.11 0.89 ± 0.09
ED30 0.87 ± 0.07 0.98 ± 0.06 1.09 ± 0.08
ED50 1.12 ± 0.10 1.19 ± 0.08
Values in normal type-set are 2-ΔΔCT (± SE) from qRT-PCR Cohort 3. For comparison, values in italics are fold-change from control (± SE) for microarray probe sets (Cohorts 1 & 2). Groups for statistical analysis are given in Table 1. Equipotent dose groups are based on Wolansky et al (2006). Main effects in two-way ANOVA: a = EDL (p < 0.05), b = COMPOUND*EDL (p < 0.05) and DOSE (p < 0.05) for deltamethrin only in one-way ANOVA, c = COMPOUND (p < 0.05). * = Significance difference from control in a Dunnett's mean contrast test (p < 0.05).
37°C and mixed at 30 rpm. The cortices were centrifuged (400 × g, 1600 rpm) for 5 minutes at room temperature, the supernatant was aspirated and the tissue pellet was re-suspended in Gibco® DMEM/GlutaMAX-1 (Invitrogen
Corp, Carlsbad, CA) containing 10 mM HEPES, 100 U/ml penicillin, 0.1 mg/ml streptomycin and 10% horse serum, pH = 7.4. The tissue was dissociated by trituration and fil-tered through a 100-μm Nitex screen. Cells were plated at a density of 50,000 cells/well in 96-well polystyrene plates (Corning, Inc., Corning, NY) that had been pre-coated with poly-L-lysine. Cells were incubated at 37°C in a humidified atmosphere of 5% CO2 and 95% air.
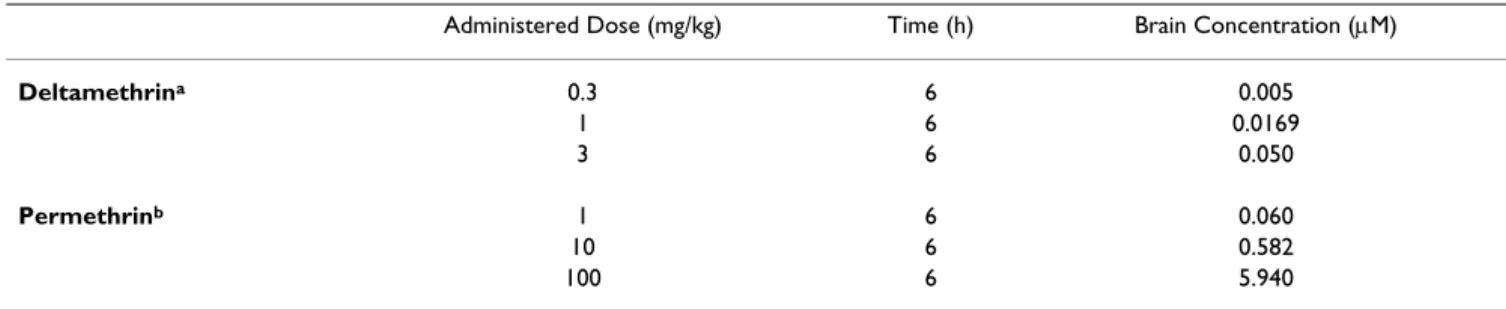
Multi-compartment pharmacokinetic models for the dis-position of deltamethrin and permethrin were used to predict tissue concentrations of deltamethrin and per-methrin in the brain at 6 h following the acute adminis-tered doses used in this study [56,57]. Predictions are listed in Table 6. These estimated brain concentrations were then used to select nominal media concentrations of
pyrethroids for use in the functional neurite morphogen-esis cell model.
For in vitro exposure of cells, pyrethroids were prepared in DMSO using semi-logarithmic serial dilutions of concen-trated stock solutions to yield final chemical concentra-tion ranges of 0.001 – 0.03 μM and 0.01 – 3 μM for deltamethrin and permethrin, respectively. The final DMSO concentration in the cortical media was 0.1%. Chemicals were added to the cells 2 hours after plating to ensure the cells adhered to the poly-L-lysine and incu-bated for a 96-hour exposure period.
Evaluation of neurite outgrowth and cell viability
Immunocytochemical staining with a Neurite Outgrowth Hitkit (Thermo-Fisher Scientific, Waltham, MA) and sub-sequent analysis using a Cellomics ArrayScan VTI high
content imaging platform was used to evaluate cortical cell neurite outgrowth and branching as described in Radio et al. (2008) for differentiated PC-12 cells [58]. The Cellomics ArrayScan VTI Neuronal Profiling
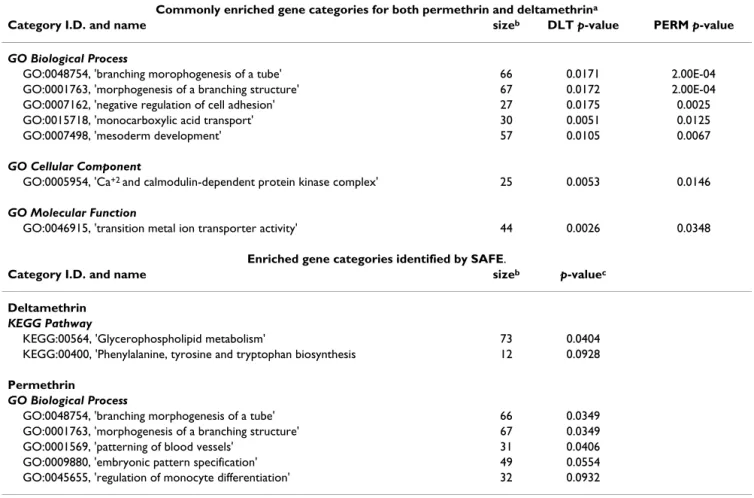
Bioapplica-Table 5: Significant Analysis of Function and Expression (SAFE) results.
Commonly enriched gene categories for both permethrin and deltamethrina
Category I.D. and name sizeb DLT p-value PERM p-value GO Biological Process
GO:0048754, 'branching morophogenesis of a tube' 66 0.0171 2.00E-04 GO:0001763, 'morphogenesis of a branching structure' 67 0.0172 2.00E-04 GO:0007162, 'negative regulation of cell adhesion' 27 0.0175 0.0025
GO:0015718, 'monocarboxylic acid transport' 30 0.0051 0.0125
GO:0007498, 'mesoderm development' 57 0.0105 0.0067
GO Cellular Component
GO:0005954, 'Ca+2 and calmodulin-dependent protein kinase complex' 25 0.0053 0.0146 GO Molecular Function
GO:0046915, 'transition metal ion transporter activity' 44 0.0026 0.0348
Enriched gene categories identified by SAFE.
Category I.D. and name sizeb p-valuec
Deltamethrin
KEGG Pathway
KEGG:00564, 'Glycerophospholipid metabolism' 73 0.0404 KEGG:00400, 'Phenylalanine, tyrosine and tryptophan biosynthesis 12 0.0928
Permethrin
GO Biological Process
GO:0048754, 'branching morphogenesis of a tube' 66 0.0349 GO:0001763, 'morphogenesis of a branching structure' 67 0.0349
GO:0001569, 'patterning of blood vessels' 31 0.0406
GO:0009880, 'embryonic pattern specification' 49 0.0554 GO:0045655, 'regulation of monocyte differentiation' 32 0.0932
a GO catergories or KEGG pathways with p < 0.05 for both test compounds using Fisher's combined p-value method to test for joint enrichment in the SAFE procedure. b number of Affymetrix probe sets included in GO category or KEGG pathway groupings. c GO categories or KEGG pathways with an adjusted p < 0.1 for SAFE method. 700 GO-BP (biological processes), 142 GO-CC (cellular component), 307 GO-MF (molecular function) and 126 KEGG pathways were examined.
tion used a 10X objective and sampled a sufficient number of fields for the analysis of at least 200 cells per well. Data represent the mean ± standard error across 3 replicate experiments. Cellular viability was determined in cortical cell cultures grown as described above in opaque 96-well plates using the CellTiter-Glo Viability Assay (Promega Corp., Madison, WI) as described in Radio et al. (2008) [58]. Luminescence was measured thirty minutes after adding the reagent using a FLUOstar Optima plate reader (BMG LABTECH, Durham, NC).
Results
Microarray dose-response analyses
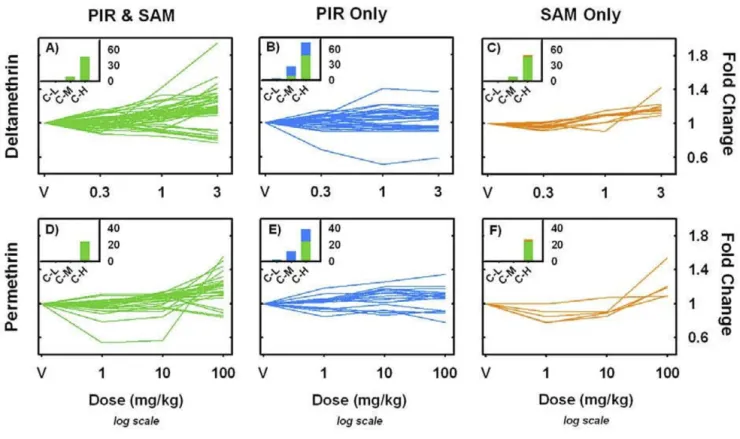
Both the PIR (isotonic) and SAM (linear) penalized regression methods identified dose-dependent increases and decreases in mRNA expression in the frontal cortex 6 h after an acute, oral exposure to both deltamethrin and permethrin. A comparison of the PIR and SAM regression models demonstrate that the two methods yield similar results in terms of identifying dose-responsive probe sets for both deltamethrin and permethrin (Figure 1A &1B). SAM analyses identified a small number of probe sets with dose-dependent increases in expression following either deltamethrin (n = 7) or permethrin (n = 10) exposure using the permutation-based FDR values as the signifi-cance criteria (q < 0.10, see Figure 1A &1B). The PIR anal-yses did not identify any probe sets for either pyrethroid with dose-dependent changes in expression at q < 0.10. A less statistically conservative method of identifying dose-related changes in probe set expression identified a larger number of significantly altered probe sets than that observed using the FDR criteria. Using a screening thresh-old of p < 0.01 the SAM analysis identified 70 and 61 probe sets with dose-dependent changes in expression for deltamethrin and permethrin, respectively, while the PIR analysis identified 93 and 85, respectively (Figure 1A–B). The overlap between probe sets identified as dose-respon-sive using the empirical p-value thresholds is considerable but incomplete. Overall, these parallel methods yield comparable results in that a rank-ordered list of dose-dependent changes in expression constructed using either the PIR or SAM test-statistics identifies the same groups of
probe sets as being the most significantly changed within both the deltamethrin and permethrin test cohorts To minimize the inclusion of false positives in qRT-PCR prioritization lists, all the probe sets for each compound that had empirical p-values < 0.01 in either the SAM or PIR regression methods were additionally analyzed with a one-way ANOVA with dose as the independent factor, fol-lowed by a Benjamini-Hochberg multiple testing correc-tion (significance threshold, p < 0.05). For deltamethrin and permethrin, 95 of 109 (87.1%) and 53 of 89 (59.5%) probe sets passed the ANOVA significance threshold. The full list of probe sets considered significantly dose-respon-sive for deltamethrin (n = 95) and permethrin (n = 53) are listed in Additional files 3 and 4. Probe sets included in Additional files 3 and 4 that correspond to known pro-tein-coding RefSeq database entries were considered can-didates for qRT-PCR confirmation in dose-response Cohorts 3 and 4 and are listed in Tables 2 and 3.
The dose-dependent changes in mRNA expression identi-fied with the above analyses are relatively small in magni-tude, < 2-fold change from control, and have varying patterns of expression across dose (Figure 2). Post-hoc analysis (Dunnett's mean contrast test) of these dose-response functions indicate that significant alterations in mRNA expression occur at doses below those needed to produce acute behavioral effects (Figure 2, insets). A majority of the probe sets identified as dose-responsive had mean expression values in the 3 mg/kg deltamethrin and 100 mg/kg permethrin dose groups different from those in the vehicle treated control group (78.9% and 77.3%, respectively). Of those probe sets, 25.3% and 19.5% also had mean expression values in the 1 mg/kg deltamethrin and 10 mg/kg permethrin dose groups dif-ferent from controls. These latter doses are below those needed to produce acute neurotoxic effects on behavior. In addition, these data demonstrate that the PIR analyses detected a greater number of probe sets with mean expres-sion values in the behavioral "NOAEL" dose groups (see Table 1) as being different from control as compared to the SAM analyses (compare Figure 2B &2E, insets to
Fig-Table 6: Pharmacokinetic estimates of pyrethroid brain concentrations.
Administered Dose (mg/kg) Time (h) Brain Concentration (μM)
Deltamethrina 0.3 6 0.005 1 6 0.0169 3 6 0.050 Permethrinb 1 6 0.060 10 6 0.582 100 6 5.940
a Estimates based on Mirfazaelian et al. (2006). b Estimates based on Tornero-Velez et al. (2007).
Comparison of PIR and SAM regression methods Figure 1
Comparison of PIR and SAM regression methods. Panels A & B plot the penalized isotonic regression (PIR) test statistic
(Mi, x-axis) against the penalized linear regression (SAM) test statistic (di, y-axis) for deltamethrin and permethrin, respectively. All 31,042 probe sets present on the Affymetrix Rat 230 2.0 GeneChip® are shown. Data points in green have an empirical
p-value < 0.01 for both the PIR and SAM methods. Data points in blue have an empirical p-p-value < 0.01 for the PIR regression only. Data points in orange have an empirical p-value < 0.01 for the SAM regression only. In the deltamethrin and permethrin analyses, 49.5% and 53.7% of all probe sets identified by either the PIR or SAM method had p < 0.01 for both methods. Data points circled in red have a q-value < 0.10 in permutation-based FDR calculations employed in the SAM algorithm. Note that the rank order of statistical significance was similar between the two methods in that probe sets commonly identified using the PIR or SAM method tend to appear in the upper-right and lower left hand corners of the scatterplots (green points).
ure 2C &2F, insets).
Comparison of transcriptional effects across compounds
A comparison of the probe sets identified as dose-respon-sive in the PIR and SAM regression analyses demonstrates that the transcriptional response elicited by the two pyre-throids has some common characteristics. The panels in Figures 3 plot the -log10 of the empirical p-values
associ-ated with the PIR regression (3A) or SAM regression (3B) for each probe set identified as dose-responsive for either deltamethrin or permethrin. Data from the PIR regression analyses demonstrate that expression of 27.2% of all probe sets identified as dose-responsive for either pyre-throid are significantly altered by both compounds at an empirical p-value threshold of p < 0.05 (Figure 3A). Like-wise, SAM analyses demonstrated that 27.8% of all
dose-responsive transcripts are altered by both pyrethroids (Fig-ure 3B). Differences in the global transcriptional response profiles between pyrethroids are also apparent.
Quantitative real-time RT-PCR
Table 4 summarizes the results of the qRT-PCR assays and compares them to the fold-change expression values derived from the microarray study. Of the nine transcripts examined by qRT-PCR in Cohort 3, Ca+2/calmodulin
dependent protein kinase 1γ (Camk1g) and dopa decar-boxylase (Ddc) were commonly affected by both com-pounds indicating that for these genes there was no differences in the changes in expression elicited by equi-potent doses of either pyrethroid. Camk1g qRT-PCR expression values closely resembled those observed in the microarray study. In contrast to Camk1g, the microarray Dose-response functions identified by PIR and SAM regression methods
Figure 2
Dose-response functions identified by PIR and SAM regression methods. Panels A-F plot dose-response functions
for probe sets identified by PIR (B & E), SAM (C & F) or both regression methods (A & D) for deltamethrin (A-C) and per-methrin (D-F). Only probe sets that had a Benjamini-Hochberg adjusted p-value < 0.05 for a main effect of dose in a one-way ANOVA are shown. For each probe set expression summaries for each treatment group were normalized to vehicle control and plotted as fold-change from control. The color scheme corresponds to that used in Figure 1, with green curves being detected by both PIR and SAM regression methods (A, D), blue curves being detected exclusively with the PIR method (B, E) and orange curves being detected exclusively with the SAM method (C, F). Insets on each panel are the summated results of a Dunnett's many-to-one mean contrast test performed within each probe set comparing the means of the lowest (C-L), middle (C-M) and highest (C-H) doses to the mean of vehicle treated control. y-axis is number of probe sets identified under each comparison at a significance level of p < 0.05. Note the green portion of the stacked bars in the insets are the same values in inset panels A-C and D-E, respectively.
dose-response cohort demonstrated a dose-related change in Ddc expression for deltamethrin only, even though a clear dose-dependent decrease in Ddc mRNA expression was observed in both the deltamethrin and permethrin qRT-PCR cohorts.
A significant interaction between compound and EDL was observed for glycerol-3-phosphate dehydrogenase 1 (Gpd1) and FK506-binding protein 5 (Fkbp51), indicating that equipotent doses of the two pyrethroids did not elicit similar changes in expression at 6 h post-exposure. A main effect of dose was observed for Gpd1 and Fkbp51 mRNA only for deltamethrin (Table 4). The qRT-PCR expression values for Gpd1 and Fkbp51 closely match those observed in the microarray study.
The immediate early genes (IEG), FBJ murine osteosar-coma viral oncogene homolog (c-fos) and early growth response 1 (Egr1) were differentially affected by the two pyrethroids at 6 h post-exposure, however, no significant main effect of dose (EDL) was observed for either com-pound. For deltamethrin, the direction of fold-change for
c-fos and Egr1 is down in most dose groups measured by
qRT-PCR. In contrast, for permethrin no change in the
expression of c-fos and Egr1 mRNA was observed across dose groups in the qRT-PCR cohort. While c-fos and Egr1 expression at 3 mg/kg deltamethrin and 100 mg/kg per-methrin reflect the direction of fold-change observed in the microarray study, very little similarity is apparent between qRT-PCR and microarray expression values for these genes at the lower dose levels (Table 4).
There were no effects of pyrethroid exposure on mRNA expression for heat shock 27 kDa protein (Hsp27), brain derived neurotrophic factor (BDNF) or Ras association (RalGAS/AF-6) domain family 6 (Rassf5) (data not shown). In the case of BDNF, qRT-PCR expression values closely approximate the expression values observed in a second probe set not identified as dose-responsive in the microarray analyses (data not shown).
Characterization of the time course of mRNA expression for Camk1g, Gpd1, c-fos and Egr1 demonstrates that altered expression of these transcripts also occurs at times earlier than 6 h following acute, oral pyrethroid exposure (Figure 4, Additional file 5). Treatment-related increases in
Camk1g and Gpd1 mRNA expression were observed for
both deltamethrin and permethrin. For deltamethrin, Comparison of probe sets identified by PIR or SAM between pyrethroids
Figure 3
Comparison of probe sets identified by PIR or SAM between pyrethroids. Panels A and B plot the -log10 (empirical p-value) for deltamethrin (x-axis) against the -log10 (empirical p-value) for permethrin (y-axis) for probe sets identified during PIR or SAM regression analyses, respectively. All probe sets that had a Benjamini-Hochberg adjusted p-value < 0.05 in a one-way ANOVA for either permethrin or deltamethrin are included in the plot. Dashed boxes represent empirical p-value thresholds of p < 0.05. All points in the upper right of the figures, within the dashed boxes, meet the respective p-value criteria for both pyrethroids. 27.2% and 27.8% of all probe sets identified during PIR or SAM analysis, respectively, had empirical p-values of p < 0.05 for both compounds.
both Camk1g and Gpd1 mRNA had maximally induced expression at 3 h followed by persistent elevations at 6 h (Figure 4). For permethrin, both Camk1g and Gpd1 had maximal induction at 6 h preceded by slight elevations at 3 h. Permethrin-mediated Gpd1 induction was statistically significant while Camk1g induction reflected the trends observed in the dose-response cohorts but did not reach statistical significance. Ddc mRNA expression was decreased following both deltamethrin and permethrin exposure. For deltamethrin decreased expression began at 6 h and persisted through 9 h while for permethrin, expression decreased at 6 h only. The changes in Ddc mRNA expression over time were consistent with those observed in the qRT-PCR cohort
Both deltamethrin and permethrin increase the expres-sion of the IEGs c-fos and Egr1, albeit with different tem-poral characteristics. Expression of c-fos and Egr1 increases at 3 h for deltamethrin and returns to control levels at 6 h. For permethrin, expression of c-fos and Egr1 increases at 3 h, remains persistently elevated at 6 h and returns to con-trol levels by 9 h. The large increases in c-fos and Egr1 for permethrin and not deltamethrin are consistent with the microarray data as these two genes were identified as dose-responsive at 6 h for the former and not the latter compound. However, the data in Figure 4 demonstrate that the two pyrethroids, in fact, elicit qualitatively similar responses in the expression of c-fos and Egr1. The expres-sion of another IEG, BDNF, is apparently not affected by pyrethroids under the dosing paradigm used in this study.
Significant Analysis of Function and Expression (SAFE)
Seven GO categories were identified as commonly enriched for both pyrethroids using SAFE analysis and Fisher's χ2 method (Table 5). The composition of the
commonly enriched categories for both chemicals included genes involved in neuronal morphogenesis, intracellular Ca+2 signaling and small molecule transport.
In addition, five GO-BP categories and two canonical KEGG pathways were identified as enriched in the indi-vidual SAFE analyses of permethrin and deltamethrin, respectively (Table 5). For permethrin, the SAFE findings include enriched gene categories related to neuronal mor-phogenesis and developmental patterning. For deltameth-rin the SAFE findings include two KEGG metabolic pathways, one of which involves synthesis of the precur-sor molecules for monoamine neurotransmitters. SAFE plots of the GO categories 'morphogenesis of a branching structure' and 'Ca+2/calmodulin dependent
protein kinase complex' demonstrate the significant cate-gory enrichment for both permethrin and deltamethrin (Figure 5). This is evidenced by the divergence of the stair step line from the unity line near the far left of Figure 5, panels A-D. A SAFE plot of a GO category not significantly
enriched for either compound is given in Figure 5, panels E-F for comparison purposes. The most significant dose-responsive transcripts for each of the enriched GO catego-ries are illustrated in the heatmaps to the right of Figure 5, panels A-D. These heatmaps demonstrate that appreciable dose-dependent increases in the expression of probe sets contained within the enriched GO categories occurs fol-lowing pyrethroid exposure.
Pyrethroid effects on neurite length and branching in primary mixed cortical cell cultures
Both deltamethrin and permethrin produce an increase in the number of neurite branch points following a 96 h exposure (Figure 6A &6D). The range of predicted tissue concentrations (in μM) from the pharmacokinetic predic-tions listed in Table 6 are marked near the x-axes and cor-respond well to areas along the in vitro dose-response curve where changes in branching were observed. An aver-age increase of ~25% above control in the number of neu-rite branch points was observed at nominal media concentrations ranging from 0.01 – 0.03 μM deltamethrin and 0.01 – 3 μM permethrin. No significant increase in total neurite length was observed for either compound save at the 0.01 μM exposure level for permethrin (Figure 6B &6E). Changes in cell viability were not apparent in the concentration ranges tested (Figure 6C &6F).
Discussion
A principle finding of the present study was that dose-dependent alterations in gene transcription occur in the cortex at doses of deltamethrin and permethrin below those required to elicit acute neurotoxic effects in the whole animal. Both similarities and differences in the overall transcriptional response were observed when com-paring the two pyrethroids. Quantitative real-time RT-PCR analysis in additional cohorts of animals provided independent biological and technical replicates of the findings from the microarray data set. In addition, tran-scripts for which the time course of gene expression was characterized demonstrated qualitative similarities in the response for both pyrethroids. SAFE analysis of the micro-array data identified several GO categories jointly enriched by both deltamethrin and permethrin including some related to branching morphogenesis. Subsequently, a significant increase in the number of neurite branch points was observed in a primary cortical cell culture model.
Microarray dose-response analyses
Dose-dependent alterations in transcript expression were observed in frontal cortex 6 h following acute exposure to pyrethroids. Prior to experimentation, the shape of the dose-response curve for any potential alterations in gene transcription was unknown. Visual inspection of the data demonstrated a definite heterogeneity in the types of
qRT-PCR time course results Figure 4
qRT-PCR time course results. Transcript expression over time following a single acute dose of 3 mg/kg deltamethrin (top)
or 100 mg/kg permethrin (bottom). Gene symbols are listed on the y-axis. Data were analyzed using two-way ANOVA fol-lowed by one-way ANOVA within time points were interaction was observed. (**) denotes no interaction of time and treat-ment and a main effect of treattreat-ment (p < 0.05). (‡) denotes no interaction of time and treattreat-ment and a main effect of both time and treatment (p < 0.05). (*) denotes a significant effect of treatment for that time point (p < 0.05). (†) denotes a significant main effect of dose from qRT-PCR dose-response analysis (Table 4). Values for time-matched vehicle controls are not shown. A summary of the statistical analyses performed on these data is provided in Additional file 5.
dose-response functions produced by these pyrethroid exposures (see Figure 2). The biological factors mediating this heterogeneity are unclear but may involve activation of different intracellular signaling pathways at different points along the dose range [59-62]. To generate lists of candidate genes for qRT-PCR follow-up that captures this heterogeneity, the GeneChip® expression data was
ana-lyzed using two independent but similarly structured regression methods: SAM and a novel PIR. Both methods identified qualitatively similar dose-related alterations in gene expression within each compound (Figure 1A &1B). The SAM regression model detected a number of dose-responsive transcripts with expression levels different from control only at the highest pyrethroid dose (Figure 2). However, PIR identified other dose-related changes with small, but significant, increases or decreases in expression that were similar in magnitude at both the "NOAEL" and "high" pyrethroid doses (Figure 2B &2E) and not detected by SAM. These dose-responsive tran-scripts may in fact be biologically relevant responses to acute pyrethroid intoxication which would have been excluded using the standard SAM analysis. Therefore, while both SAM and PIR identified the same sub-set of transcripts within compound, the PIR method detected a larger component of the global transcriptional response of the cortex composed of expression changes that do not fit a linear model.
The regression analysis frameworks detailed in this work were used exclusively as an identification and prioritiza-tion method for selecprioritiza-tion of genes for subsequent qRT-PCR analyses. Conclusions concerning the biological sig-nificance of individual transcriptional changes were reserved for those transcripts successfully replicated by qRT-PCR in independent cohorts of test subjects. For the goals of this study, the risk of excluding true positives in the microarray data analysis outweighed the caveat of including false positives from the final list of prioritized targets. Thus, the modified protocol of regression screen-ing and subsequent ANOVA based analyses was adopted.
Comparison across compounds
The present data demonstrate both similarities and differ-ences in the global transcriptional response in rat cortex to acute, low-dose deltamethrin and permethrin exposure. Similarities in the global transcriptional response across compounds suggest that these two pyrethroids may affect common biological pathways (Figure 3). The differences observed between compounds in the global transcrip-tional response (i.e. microarray dataset) are likely due to a combination of two factors: 1) authentic heterogeneity in the pharmacodynamic activities of deltamethrin and per-methrin on gene transcription and 2) a slight offset in the time course of qualitatively similar responses across com-pounds. In addition, time course data implies that addi-tional alterations in gene expression not detected in the 6 h dose-response study may occur at time points other than the one sampled. The qRT-PCR data shown here sup-port this conclusion (Figure 4).
The results of the SAFE functional category level analysis support the conclusion that the biological activities of the two pyrethroids overlap. Several categories were found to be commonly upregulated between the two compounds. Similarities are not surprising, given that both pyrethroids act on mammalian VSSCs [12,32]. Whether the individual gene changes or impacted functional categories are directly linked to this site of action, remains yet to be determined. Importantly, these data provide guidance on some novel cellular functions affected by pyrethroids.
Biological significance of experimental findings
Interestingly, probe sets corresponding to the primary molecular targets for pyrethroids were not altered for either pyrethroid tested in the microarray study. Specifi-cally, there were no treatment related changes in any of the VSSC or VSCC isoforms/subunits or any subunits that comprise neurotransmitter receptors complexes [63-66]. This finding is supported by in vitro data [27] that charac-terized the global transcriptional response of cortical neu-rons exposed to a variety of pharmacological agents that Composition and expression patterns of significantly enriched GO categories from SAFE analysis
Figure 5 (see previous page)
Composition and expression patterns of significantly enriched GO categories from SAFE analysis. Panels A-D
are SAFE plots for two commonly enriched categories for both deltamethrin (A & C) and permethrin (B & D). Panels E & F are SAFE plots for a category not enriched for either deltamethrin (E) or permethrin (F). The x-axis of each plot denotes the posi-tion of all probe sets in a rank ordered list of significance (from left to right) according to the empirical p-value from a linear regression across dose. The y-axis is a cumulative percentage calculated by taking the rank position of a given probe set either within the entire data set (solid unity line) or the interrogated Gene Ontology sub-category (solid stair-step line) and dividing them by the total number of probe sets contained within the entire data set or interrogated category, respectively. The degree of deviation of the stair-step line from the unity line indicates enrichment. The probe sets (excluding ESTs) that are ranked highest in significance for each GO category for both compounds in panels A-B and C-D are denoted at the top of each panel and included in a heatmap to the side of the respective panels. In the heatmaps, each row of tiles is a probe set and each col-umn of tiles represents the mean fold-change from control with increasing doses of each compound running from right to left. Colorbar for heatmaps is given in panel G.
Pyrethroid effects on branching and neurite length in primary cortical cell cultures Figure 6
Pyrethroid effects on branching and neurite length in primary cortical cell cultures. Changes in the total number
neurite of branch points (A & D), total neurite length (B & E) and cell viability (C & F) in primary cortical cell cultures exposed to deltamethrin (A-C) or permethrin (D-F). n = 3 replicate experiments. Values for each end point are normalized to untreated controls (± standard error). Untreated control values are shown in white. The bold lines underneath each curve represent the range of estimated brain concentrations expected to occur during the in vivo exposures used in the present study (Mirfazaelian et al. 2006 and Tornero-Velez et al. 2007). Significance was determined using a One-way ANOVA, * = p < 0.10, ** = p < 0.05.
altered firing rates. No changes in the expression of VSSC or VSCC isoforms/sub-units or neurotransmitter receptors were identified in this study in response to increases in neuronal firing rates [27]. Since a primary action of pyre-throids is to change firing rates [67], the present data do not support transcriptional induction or repression of VSSCs, VSCCs or neurotransmitter receptor subunits as a neuronal response to acute pyrethroid exposure. These data do not exclude transcription-independent changes in the expression or functional state of these channels known to occur following excitatory stimuli [68-71]. The immediate early transcription factors c-fos and Egr1 were upregulated by deltamethrin and permethrin. This is consistent with IEG expression changes in the cortex fol-lowing acute pyrethroid exposure [29,72]. Increased Egr1 and c-fos expression supports that deltamethrin and per-methrin increased neuronal excitation in the present study. Egr1 and c-fos are among the genes induced by increased neuronal firing in cortical cells in culture [27], as well as in vivo following stimuli that produce neuronal excitation [73,74]. Induction of IEG mRNAs is a rapid transcriptional response of neurons following increased activity [75-78]. The time course for the expression of the IEGs c-fos and Egr1 does not support de novo gene tran-scription as being responsible for mediating the acute behavioral effects of pyrethroids. The earliest time that increased IEG expression is observed in the present study is at 3 h: IEG expression is at control levels at 1 h. Onset of behavioral effects following oral pyrethroid exposure occurs prior to the onset of increased IEG expression (i.e. 30 min – 1 h) [79]. Therefore, the IEG induction described here can not mediate the acute neurotoxic signs of pyre-throid intoxication, but instead are markers of neuronal excitation.
The present study found dose- and time-dependent increases in the expression of Camk1g mRNA. Data from
in vitro models of developmental morphogenesis in
neu-rons indicates that increased expression of Camk1g (Table 4 and Figure 4) may alter the structure and function of pyrethroid-sensitive neurons. Wayman et al. (2006) [80] demonstrated that Camk1g plays a specific role in the activity-dependent growth of hippocampal neurons between 7-9DIV by activating a Ras/MEK/ERK/CREB/
Wnt2 signaling cascade in response to excitatory stimuli.
In addition, Takemoto-Kimura et al. (2007) [81] demon-strated that Camk1g participates in a Rac signaling path-way that mediates the morphogenesis of cortical neurons. In both those studies, artificial knockdown or over-expres-sion of Camk1g altered outgrowth of neuronal processes in a development context [80,81]. The role of Camk1g in maintenance and plasticity of neuronal processes in the adult CNS is currently unknown. Furthermore, there is evidence in the literature that Camk1g mRNA expression
is regulated by changes in neuronal firing patterns similar to IEGs. Changes in neuronal firing rates correlates with increases or decreases in the expression of Camk1g mRNA [27,82-85]. These observations support that pyrethroid-mediated changes in neuronal firing rates could mediate changes in the expression of Camk1g, which may in turn lead to changes in neuronal morphology (see below), especially during development.
The transcriptional upregulation of glycerol-3-phosphate dehydrogenase 1 (Gpd1) and FK506-binding protein (Fkbp51) mRNA (Table 4, Figure 4) indicate: 1) that pyre-throid exposure activates the hypothalamic-pituitary-adrenal (HPA) axis and 2) that non-neuronal cell popula-tions in the CNS are sensitive to pyrethroids. The proteins encoded by Gpd1 and Fkbp51 are expressed in the brain exclusively in oligodendrocytes [86] and T-cell lym-phocytes [87]. Both the Gpd1 and Fkbp51 genes contain glucocorticoid receptor binding motifs either in the upstream promoter region (Gpd1) [88] or in an intronic region (Fkbp51) [89] and increased expression of both is dependent upon glucocorticoid hormone stimulation [90,91]. Glucocorticoids are released in the circulation from the adrenals in response to a variety of stressors and increased circulating corticosterone levels were reported in the rat following deltamethrin exposures; albeit at very high, intravenous doses [92]. It is likely that increases in
Gpd1 and Fkbp51 expression may be components of a
gen-eralized, non-specific stress response brought about by overstimulation of the HPA axis by pyrethroids. The potential impact of increased Gpd1 and Fkbp51 expression on the health and function of affected glia, to date, is unclear.
Decreases in the expression of aromatic L-amino acid decarboxylase (Ddc) suggest that pathways controlling monoaminergic neurotransmitter synthesis may be affected by pyrethroids. Ddc is the final enzyme in the syn-thesis pathways of dopamine and serotonin [93]. Previ-ous reports note a depletion of dopamine and serotonin in a variety of brain regions following repeated exposure to deltamethrin [94-96]. In the case of dopamine deple-tion, two of these studies demonstrate concurrent decreases in the expression of tyrosine hydroxylase, the penultimate enzyme in dopamine synthesis [95,96]. The mechanism controlling Ddc mRNA repression following pyrethroid exposure is unclear, but provides support that monoaminergic neurotransmitter systems are sensitive to the compounds.
The changes in gene transcription observed in the present study occur at doses at or near the threshold for eliciting acute neurobehavioral signs of intoxication in the whole animal [33,97,98]. Time course data (Figure 4) demon-strate that transcriptional changes are transient and