LONG-TERM TEMPORAL DYNAMICS OF THE DUKE FOREST
Christopher Joseph Payne
A dissertation submitted to the faculty at the University of North Carolina at Chapel Hill in partial fulfillment of the requirements for the degree of Doctor of Philosophy in Ecology in the
Curriculum for the Environment and Ecology in the College of Arts and Sciences.
Chapel Hill 2018 Approved by: Robert K. Peet Peter S. White Dean L. Urban David R. Peart Conghe Song
© 2018
Christopher Joseph Payne ALL RIGHTS RESERVED
ABSTRACT
Christopher Joseph Payne: Long-term temporal dynamics of the Duke Forest (Under the direction of Robert K. Peet)
In this dissertation, I describe a series of permanent sample plots in the North Carolina Piedmont used to examine near-century forest processes and to evaluate how observed trends can inform existing conceptual models. Specifically, 80 years of tree growth and forest composition were recorded across all succession phases in a series of successional Pinus taeda stands and second-growth Quercus-Carya and Liriodendron-Liquidambar hardwood stands in the Duke Forest. I use these long-term data to scrutinize classical theories of community dynamics and growth trends in Piedmont forests that have served as a model system for successional research for nearly 100 years. Specifically, using a suite of multivariate statistics I examine whether old-field pine forests have succeeded toward putative climax compositions or whether deviations in successional trajectories have occurred owing to shifts in species composition and disturbance events. I additionally examine whether biomass of successional stands can be predicted based on canopy mortality and lags in regeneration and whether growth rates of later-stage forests have increased more than expected over the last century. 80-year biomass and growth trends in successional plots confirm the importance of canopy density and mortality in driving these patterns, but lag patterns in post-hurricane regeneration are not yet formally discernible. In contrast, second-growth hardwood plots demonstrate consistent biomass accumulation and continued increases in growth rate, despite having achieved biomass levels found in more static
compositional trajectories that were accelerated by Hurricane Fran and resulted in replacement of upland-associated hardwood species (e.g., Cornus florida) with species associated with more mesic stands (e.g., Acer rubrum, Liquidambar styraciflua, and Fagus grandifolia). A similar replacement of putative climax species (e.g., Quercus alba) with A. rubrum occurred in understories of late-successional hardwood stands. In contrast with accepted successional models, these results are in line with mounting evidence of unanticipated and less predictable forest dynamics over the last century. Such changes could be the result of changing climate patterns or anthropogenic impacts. Regardless, more mechanistic experiments must be developed to determine the cause of these seemingly-widespread patterns to better inform global change and forestry models.
In loving memory of my grandfather, Joseph A. Bugica, who provided me with so many early outdoor experiences and countless scientific conversations. You truly cultivated my curiosity for
science, and these experiences helped shape my fascination with the environment. Thank you so much. You will truly be missed.
ACKNOWLEDGMENTS
I would like to acknowledge all the volunteer field assistants I have had including Drew Chandler, Eric Hill, Kate Murphy, Robert Paxton, Alanna Marron, Lindsey Bargelt, Rebecca Leloudis, Billy Balton, Meghan Cooper, Natalie Lynch, Francesca Marsh, Emily Adams, Syed Shouvik Saleh, Alopi Modi, and especially Scott Parker. I would further like to thank all others who assisted with fieldwork including Christopher Hakkenberg, Sierra Woodruff, Kelly
McNulty, Catie Alves, Alissa Brown and Michael Lee. This dissertation would not have been possible without the thousands of person-hours that these tenacious people collectively provided in the field. They suffered through many long hot days, near misses in unsuspected lightning storms, bee stings, poison ivy, ticks, tick diseases, chiggers, copperheads, falling trees, and even a few emergency room visits. I am truly indebted to all of you for your help on this project! I would also like to thank Megan McClung, Hannah Meeler, Alexandra Noetzel, and Spencer Snider for their countless hours assisting with data entry for this project, and I would like to thank Abby Henderson for her help with soil collection and processing as well as digitizing of old data. Finally, I’d like to thank Chase Faircloth, Paapa Burko, and Rebekah Appleton for their additional assistance with digitizing old data sheets.
I would like to thank Sara DiBacco Childs, Judd Edeburn, Beverly Burgess and the rest of the past and present Duke Forest staff for their endless assistance throughout my dissertation project. Additionally, I would like to thank Johnny Randall for granting me access to Big Oak Woods in Mason Farm Biological Reserve and Glenn Catts for granting me access to the North Carolina State University G. W. Hill Forest for soil collection.
I would like to thank those who provided statistical assistance for this project including Jack Weiss, Dean Urban, James Wilson, Chris Wiesen of the Odum institute, James
Umbanhowar, Bruce McCune, and dozens of professionals who answered my questions on the “Cross Validated” and “Stack Overflow” StackExchange question-and-answer forum websites. Of these people, Jack Weiss proved to be a huge aid in my initial stages of statistical analyses, and I will always remember the 8-hour day Jack and I spent in his office that lasted long after the working day was done. Jack’s unending willingness to help graduate students, his phenomenal stats notes and his ability to so successfully facilitate statistical and ecological analyses really left a strong impression on me. I cannot even begin to count the number of days in my final years at UNC that I wished Jack was still around to help. May he rest in peace.
I would like to thank the members of my committee for their continued support in guiding me through the dissertation process when I most needed it and for providing career advice when I sought it. I would especially like to thank Bob Peet for providing these data to me in 2012 to start this long journey as well as the countless resources and hours of his time he provided to aid me along the way. David Peart was very helpful in talking through a number of concepts, and he provided much needed guidance, focus and direction. Thanks, David, for the valuable conversations we have had; I am very glad things worked out the way they did. Dean Urban helped me significantly with quantitative analyses, and Peter White and Conghe Song additionally provided support and provided constructive feedback at committee meetings.
I have a number of funding sources to thank. I would like to thank both the Curriculum for the Environment and Ecology and the Department of Biology for employing me as a teaching assistant for numerous years. This dissertation would not have been possible without several Department of Biology fellowships including the Mrs. William C. Coker Fellowship, several
Alma Holland Beers Scholarships, several Summer W.C. Coker Fellowships, and multiple Gwendolyn Burton Caldwell Graduate Scholarships. I would like to thank Dean Urban for funding soil analyses to enable a complete reanalysis of all plots in a consistent fashion, and I would especially like to thank Bob Peet for the additional generous funding he provided
throughout this research project. Finally, a Dissertation Completion Fellowship through the UNC Graduate School made (almost) timely completion of my dissertation possible.
I would like to thank the Curriculum for the Environment and Ecology and all members of the Plant Ecology Lab for their support. Peter Wilfahrt and Bianca Lopez were like big brother and sister to me for 5+ years. I would especially like to thank Michael Lee for all of the database and computer help he provided throughout my tenure at UNC as well as for countless hours of enjoyable conversation, shared fascination in astronomical exploration and hundreds of ping-pong matches. I could only win when he played left-handed!
I would like to thank my parents, brothers, and my family near and far for their continued love and support throughout the last seven years. It seemed no matter where I traveled, I could find family to lean on. Thanks mom, dad, Nick, and Mike for making it down for the defense!
Finally, I would like to thank my wife, Angelica, for her love and support over the last five years and her continued patience and understanding as I diligently tried bringing together this dissertation. She is truly an exemplary spouse from whom I find much inspiration, and I thank God every day that he brought us together. Thankfully, we made time for some memorable adventures during our tenure in NC, and I am excited to start a new adventure with her as we prepare to move to Ohio for my Assistant Professor job at Malone University in August. To Angelica and all of my friends and family: I hope this means I finally have my life back!
TABLE OF CONTENTS
List of tables... xv
List of figures ... xvii
List of abbreviations and symbols ... xxi
Chapter 1: Introduction ... 1
Long-term studies ... 4
Current study ... 8
References ... 11
Chapter 2: Long-term permanent sample plots in Duke Forest, North Carolina: 80 years of individual tree growth data ... 20
Summary ... 20
Key words ... 21
Introduction ... 21
Site description... 23
Geology and history ... 23
Research plot history and description ... 27
Research methods ... 34
Tree sampling... 34
Nomenclature ... 41
Error correction and data standardization ... 41
Site analyses ... 50
Soil methods... 52
Project personnel ... 54
Data set status and accessibility ... 55
Archiving ... 55
The data ... 55
File identities ... 55
File sizes... 56
File comments ... 56
Format and storage mode ... 58
Authentication procedures ... 58
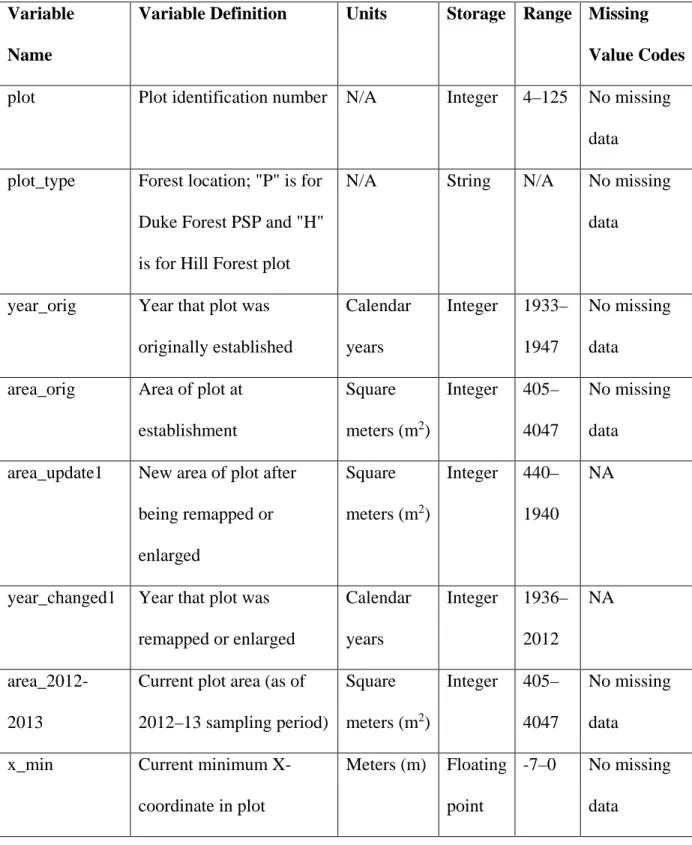
Variable definitions ... 59
Publications and results... 94
Acknowledgments... 95
References ... 97
Chapter 3: Large mapped permanent sample plots in North Carolina Piedmont Forests: Multi-decadal individual tree growth data ... 103
Summary ... 103
Key words ... 104
Introduction ... 104
Period of study ... 104
Site description... 105
Research plot history and description ... 107
Tree sampling... 112
Nomenclature ... 116
Error correction and data standardization ... 116
Project personnel ... 122
Data set status and accessibility ... 123
Archiving ... 123
The data ... 124
File identities ... 124
File sizes... 124
File comments ... 124
Format and storage mode ... 124
Authentication procedures ... 125
Variable definitions ... 125
Quality assurance/quality control procedures ... 149
Publications and results... 149
Acknowledgments... 151
References ... 153
Chapter 4: MultiEDA: An interactive data exploration application for Duke Forest long-term forest data ... 156
Summary ... 156
Introduction ... 157
Description ... 160
Main control bar ... 160
Silhouette ... 164 Indicator Spp ... 167 SPEC Data ... 167 Spp Density ... 170 Plot Layout ... 171 NMDS Data ... 176 Raw Data ... 179 Input ... 179 Conclusion ... 183 References ... 185
Chapter 5: Long-term biomass and forest growth trends in the Duke Forest, North Carolina ... 188
Summary ... 188
Introduction ... 189
Methods... 193
Study area and site description ... 193
Data post-processing ... 197
Analysis... 201
Results ... 202
Successional pine plots ... 202
Hardwood plots ... 216
Discussion ... 223
Successional pine plots ... 223
Conclusion ... 231
References ... 233
Chapter 6: 80 years of forest dynamics in the North Carolina Piedmont: Revisiting a model system for study of forest succession ... 240
Summary ... 240
Introduction ... 241
Methods... 245
Study area and data ... 245
Post-processing forest growth data ... 246
Multivariate analyses ... 247
Results ... 253
NMDS ... 253
Classifying community types: Cluster analysis, species weighted averages and indicator species analyses ... 258
Successional change... 260 Species trends... 264 Environmental correlations ... 292 Discussion ... 299 Compositional trends ... 299 Environmental drivers ... 304 Conclusion ... 309 References ... 311
Appendix A1: Species code definitions ... 320
Appendix A3: Biomass tables (hardwood plots) ... 353
Appendix A4: Relative species abundances in Chapter 6 cluster-analysis groups ... 363
Appendix A5: Indicator species in Chapter 6 cluster-analysis groups ... 370
References ... 375 Appendix S1: PSP data ... S1 Appendix S2: MAP data ... S2 Appendix S3: MultiEDA source code ... S3
LIST OF TABLES
Table 2.1 Variable definitions for Duke Forest PSP tree growth data………..59
Table 2.2 Variable definitions for Duke Forest PSP extinct plot tree growth data………...69
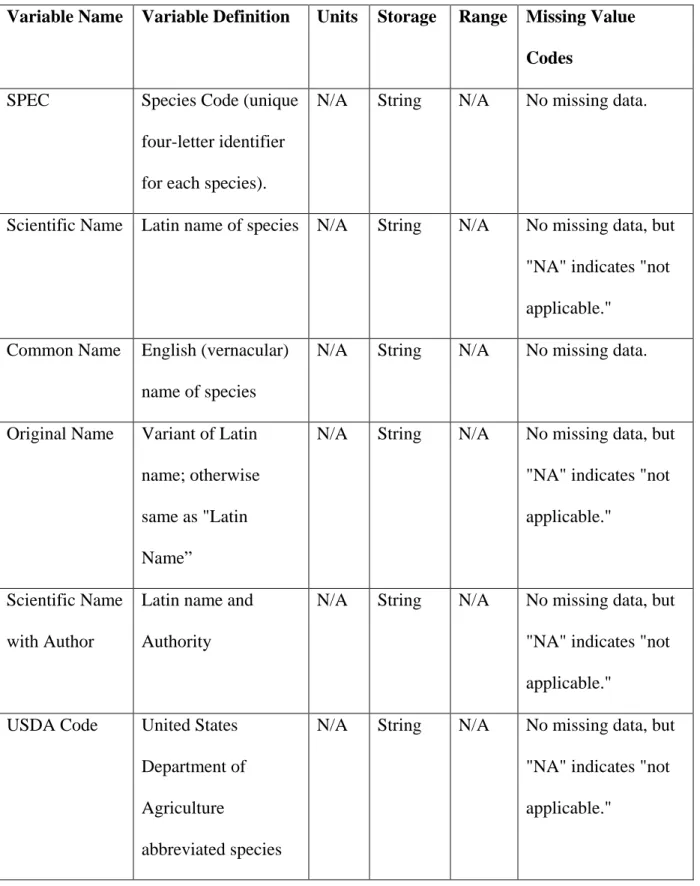
Table 2.3 Variable definitions for Duke Forest PSP species descriptions………74
Table 2.4 Variable definitions for Duke Forest PSP site and environmental data………76
Table 2.5 Variable definitions for Duke Forest PSP area and mapping information and changes……….……….………....85
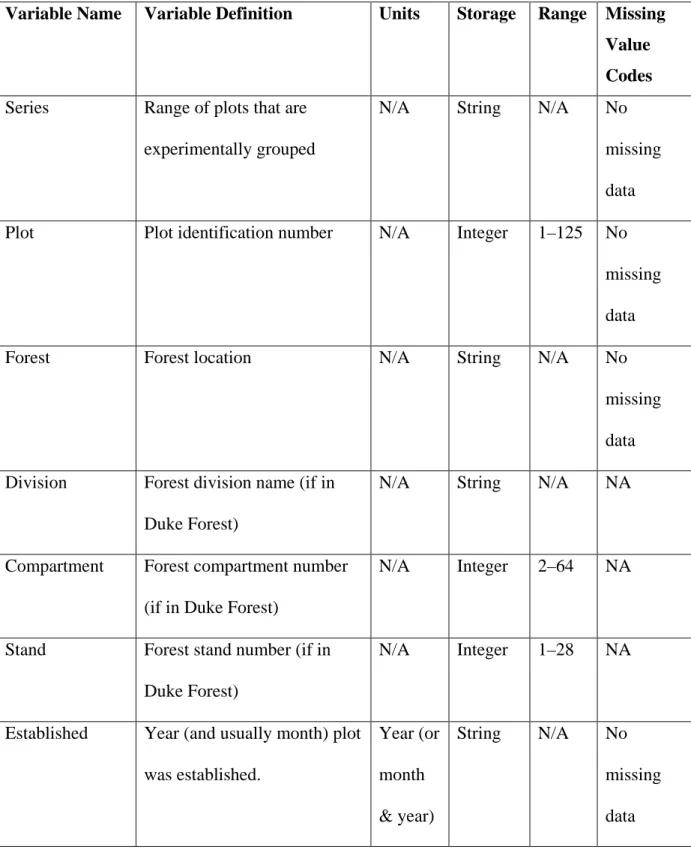
Table 2.6 Variable definitions for Duke Forest PSP plot history and experimental status information……….……….………...87
Table 3.1 Variable definitions for Duke Forest MAP plot tree growth data………...125
Table 3.2 Variable definitions for Duke Forest MAP plot species descriptions……….141
Table 3.3 Variable definitions for Duke Forest MAP area and mapping information and changes……….……….………...142
Table 4.1 Grid showing the names of all the files current utilized by MultiEDA Version 1.52 to present output data.……….………..182
Table 5.1 Species-average wood density values and literature sources………...199
Table 5.2 Mixed effect model for successional plot biomass trends.………..210
Table 5.3 Mixed effect model for successional plot biomass accumulation rate trends.……….211
Table 5.4 Mixed effect model for successional plot growth rate trends.……….212
Table 5.5 Mixed effect model for hardwood plot biomass trends.………..219
Table 5.6 Mixed effect model for hardwood plot biomass accumulation rate trends.………….220
Table 5.7 Mixed effect model for hardwood plot growth rate trends.……….221
Table 5.8 Mixed effect model describing growth rate trends for both successional and hardwood plots.……….……….…………..222
Table 6.1. Pearson correlations between environmental variables and NMDS axes of complete plot ordination.……….………...296
Table 6.2. Pearson correlations between environmental variables and NMDS axes
of small-stem data ordination.……….………...298 Table A1.1. Species codes (“SPEC”) and associated species names.………...………....320 Table A2.1. Tables showing plot-level biomass of all individual species that achieved
a cumulative, across-sampling-period (1933 – 2013) sum of 1 Mg/ha or greater
in a given plot for each of the 28 successional pine plots.……….324 Table A3.1. Tables showing plot-level biomass of all individual species that achieved
a cumulative, across-sampling-period (1933 – 2013) sum of 1 Mg/ha or greater
in a given plot for each of the 9 hardwood plots.……….…………..353 Table A4.1. Relative abundances (%) of species in each cluster-analysis group for
unpartitioned PSP data………...364 Table A4.2. Relative abundances (%) of species in each cluster-analysis group for
PSP canopy stems………..365 Table A4.3. Relative abundances (%) of species in each cluster-analysis group for
PSP subcanopy stems……….366 Table A4.4. Relative abundances (%) of species in each cluster-analysis group for
small-stem (i.e., DBH ≤ 10 cm) PSP data………..368 Table A5.1. Indicator species for each cluster-analysis group for unpartitioned PSP data…….371 Table A5.2. Indicator species for each cluster-analysis group for PSP canopy stems…………372 Table A5.3. Indicator species for each cluster-analysis group for PSP subcanopy stems……...373 Table A5.4. Indicator species for each cluster-analysis group for small-stem
LIST OF FIGURES
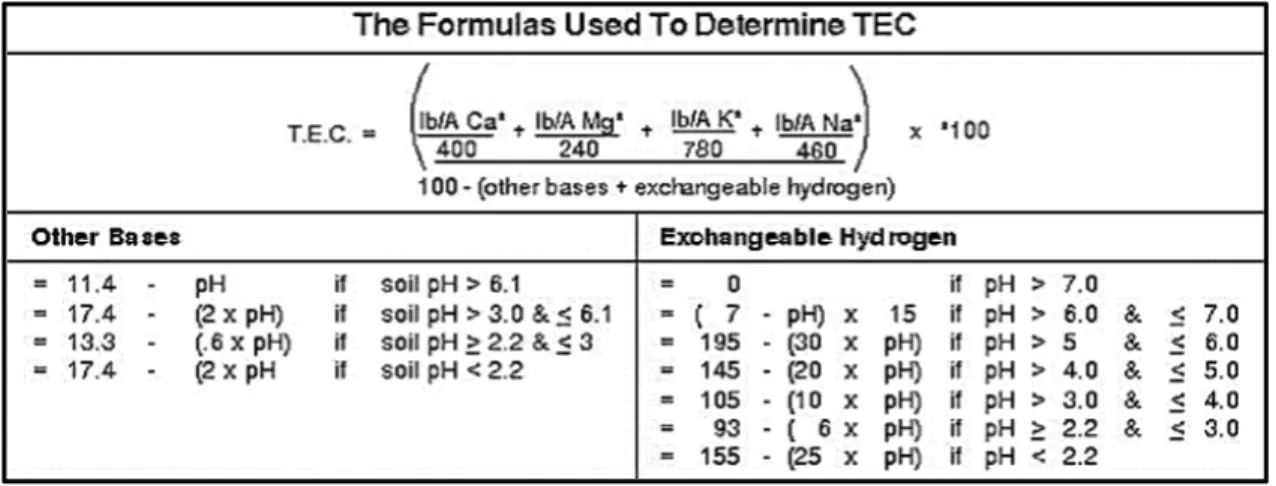
Figure 2.1 Equations and rules used by Brookside Laboratories, Inc. for determining
interpolated soil property values.……….………….53 Figure 4.1 Screenshot of left-tool bar that is available on all screens of MultiEDA.…………..162 Figure 4.2 Screenshot of the NMDS ordination page on the second-tab of MultiEDA………..165 Figure 4.3 Screenshot of the “Silhouette” tab showing silhouette widths for each
clustering approach in MultiEDA……….……….……...166 Figure 4.4 Screenshot of the “Indicator Spp” tab showing table output for indicator
species analysis in MultiEDA……….……….……...……168 Figure 4.5 Screenshot of the “SPEC Data” tab showing the cluster assignment of the
species weighted averages in MultiEDA……….………...…169 Figure 4.6 Screenshot of the “Spp Density” tab showing manipulative diameter
distribution plots for the tree data in MultiEDA……….………...….172 Figure 4.7 Screenshot of the “Plot Layout” tab in MultiEDA showing the physical
orientations and locations of each tree within each study plot……….…..177 Figure 4.8 Screenshot of the “NMS Data” tab showing NMDS scores used to build
the NMDS graphic in MultiEDA……….……….………..178 Figure 4.9 Screenshot of the “Raw Data” tab in MultiEDA showing raw input data
for Duke Forest permanent plots……….……….…….….180 Figure 5.1 Modified conceptualization of Peet’s (1981a, 1992) lag model of
successional biomass trends……….……….………….…191 Figure 5.2 Relative relationships of noteworthy soil characteristics for permanent
sample plots……….……….……….….…195 Figure 5.3 Biomass loss (in terms of annual loss rates) for all Duke Forest PSPs………..196 Figure 5.4 Biomass (Mg/ha) trends for all Duke Forest successional Pinus taeda
plots across time……….……….………..….205 Figure 5.5 Biomass (Mg/ha) trends for all Duke Forest successional Pinus taeda
plots across stand age……….……….………...206 Figure 5.6 Diagnostic plots demonstrating Duke Forest successional plot trends
Figure 5.7 Panel graph showing per-plot predictions of the mixed model (Table 5.2)
for successional Biomass (Mg/ha) trends……….………..213 Figure 5.8 Raw growth rate trends for successional pine plots……….……..…214 Figure 5.9 Mean growth rate trend (surrounded by 95% bootstrapped confidence
region) for successional plots across stand age……….……….215 Figure 5.10 Biomass (Mg/ha) trends for all Duke Forest mixed-age secondary-growth
hardwood forests……….……….………...217 Figure 5.11 Mean growth rate trend (surrounded by 95% bootstrapped confidence
region) for successional (red) and hardwood (blue) plots across time………..….222 Figure 5.12 Depletion curves illustrating mortality trends of all stems alive in initial
sampling periods for each mixed-age hardwood plot……….…………....228 Figure 6.1. Nonmetric multi-dimensional scaling (NMDS) ordination of unpartitioned
PSP data…..…..…..…..…..…..…..…..…..…..…..…..…..…..…..…..…..…..…..…..…..254 Figure 6.2. Nonmetric multi-dimensional scaling (NMDS) ordination of canopy stems………255 Figure 6.3. Nonmetric multi-dimensional scaling (NMDS) ordination of subcanopy stems…..256 Figure 6.4. Nonmetric multi-dimensional scaling (NMDS) ordination of small
(i.e., ≤ 10 cm DBH) stems……….……….………....257
Figure 6.5. Scree plots showing mantel r for possible cluster analysis grouping outcomes…....261 Figure 6.6. Successional compositional change of plots in NMDS space using
unpartitioned PSP data ……….………..269 Figure 6.7. Cumulative and per-sampling-period change vectors tracing change
in canopy community composition in NMDS space……….…………...270 Figure 6.8. Cumulative and per-sampling-period change vectors tracing change
in subcanopy community composition in NMDS space……….………...271 Figure 6.9. Cumulative and per-sampling-period change vectors tracing change
in small-stem stratum community composition in NMDS space………...272 Figure 6.10. Change vectors demonstrating the direction and magnitude of gradual
and accelerated community composition change (in NMDS space) before and
Figure 6.11. Diameter distribution of Pinus taeda (PITA) in each sampling period
in each successional PSP……….……….………..274 Figure 6.12. Canopy NMDS ordinations with point size weighted by Pinus taeda
(PITA) abundance……….……….………275 Figure 6.13. Canopy NMDS ordinations with point size weighted by Cornus florida
(COFL) abundance……….275 Figure 6.14. Unpartitioned-data NMDS ordinations with point size weighted by
hardwood species that were once prominent in successional pine plots but
that have significantly declined……….……….…………276 Figure 6.15. Canopy-tree NMDS ordinations with point size weighted by hardwood
species that have become increasingly more abundant in the canopies of
successional pine stands……….……….………...277 Figure 6.16. Unpartitioned-data NMDS ordinations with point size weighted by
successional hard-wood species that tend to be more common toward bottomland hardwood sample points (top row), that tend to have increased following major disturbance (middle row), and tend to be more abundant in
upland hardwood sites……….……….………..278 Figure 6.17. Small-stem NMDS ordinations with point size weighted by prominent
species in small-stem Group 1 (PITA) and Group 4 (DIVI)………..279 Figure 6.18. Small-stem NMDS ordinations with point size weighted by prominent
species in small-stem Group 2 (LIST, FRAX, CAOV, & CACA)……….……279 Figure 6.19. Small-stem NMDS ordinations with point size weighted by prominent
species in small-stem Group 3 (NYSY, COFL, ACRU, & OXAR)………...280 Figure 6.20. Small-stem NMDS ordinations with point size weighted by prominent
species in small-stem Group 5 (CACR and FAGR).……….……….280 Figure 6.21. Small-stem NMDS ordinations with point size weighted by prominent
species in small-stem Group 6 (JUVI, QUAL, CATO, and CAGL).……….281 Figure 6.22. Small-stem NMDS ordinations with point size weighted by prominent
species in small-stem Group 7 (ULAL, QURU, QUFA, and QUVE).………...282 Figure 6.23. Small-stem NMDS ordinations with point size weighted by Morus
rubra (MORU), which has become more prevalent in the understory of
Figure 6.24. Diameter distribution of the 24 most abundant species in each sampling
period aggregated across all successional pine plots.……….………284 Figure 6.25. Diameter distribution of the 24 most abundant species in each sampling
period aggregated across all upland hardwood plots (PSPs 10, 36, 37, 123, 124,
& 125)……….……….……….…………..285 Figure 6.26. Diameter distribution of the 24 most abundant species in each sampling
period aggregated across both bottomland hardwood plots (PSPs 43 & 44)………..286 Figure 6.27. Comparing relative abundances of prominent species of all diameter
sizes between 1980s and 2010s for plot-types designated by cluster analysis
using full data set……….……….………...287 Figure 6.28. Comparing relative abundances of prominent canopy species between
1980s and 2010s for plot-types designated by cluster analysis using canopy trees………288 Figure 6.29. Comparing relative abundances of prominent subcanopy species between
1980s and 2010s for plot-types designated by cluster analyses using subcanopy
trees……….……….……….…………...289 Figure 6.30. Comparing relative abundances of small-stem species between 1980s
& 2010s. Groups were designated by cluster analysis using sub-10 cm DBH
stems……….……….……….………290 Figure 6.31. Comparing relative abundances of prominent small-stem species between
1980s and 2010s……….……….………...291 Figure 6.32. Unpartitioned-data NMDS ordination biplot showing correlation vectors for
environmental variables……….……….………295 Figure 6.33. Small-stem-data NMDS ordination biplot showing correlation vectors for
environmental variables……….……….………297 Figure 6.34. Successional trajectories of sample PSPs to demonstrate how gradual
changes in composition began occurring in the 1960s and how hurricane
impacts (Hazel in 1954 and Fran in 1996) accelerated compositional change.…………..300 Figure 6.35. Relative abundances of prominent subcanopy species in the 1940s………...307
LIST OF ABBREVIATIONS AND SYMBOLS
(d/c/m) m (deci/centi/milli) meters
°C Degrees Celsius
AIC Akaike Information Criterion
BA Basal Area
BH Breast height (1.37 m)
BIC Bayesian Information Criterion
CC Condition code
CO2 Carbon dioxide
COS Cosine
DBH Diameter at breast height
Ft. Foot (US Standard unit of length)
(M) g Grams
GIS Geographic Information System
h Height
ha Hectares
MAP Mapped permanent sample plot
n Sample size
NMDS Nonmetric Multidimensional Scaling
PCA Principle Components Analysis Ppm Parts per million
PSP Permanent Sample Plot
r Radius
R2 Explanatory Power (coefficient of determination)
SG Specific Gravity
SPEC Species code (4-letter)
SPEI Standardized Precipitation-Evapotranspiration Index Tasp Transformed Aspect
TEC Total Exchange Capacity (cation + anion exchange capacities)
USDA United States Department of Agriculture USGS United States Geological Survey
Vp Parabolic Volume
CHAPTER 1: INTRODUCTION
For more than a century, succession has been a focal point in plant ecology and has proven useful as an organizational scheme, as a context for generating and testing numerous ecological concepts, and as a predictive tool (Peet & Christensen 1980, Peet 1992). The predictive ability is increasingly pertinent for understanding the ecological consequences of global change.
Early successional observation and research (e.g., Cowles 1899, 1901, 1911, Clements 1916, 1928, Gleason 1926, Wells 1942, Egler 1954, Odum 1969) – including extensive work in the North Carolina Piedmont (e.g., Billings 1938, Oosting 1942, Kozlowski 1949, Keever 1950, Bormann 1953) – established general successional trends and theories for the field. However, more recent work (e.g., Drury & Nisbet 1973, Pickett 1976, Connell & Slatyer 1977, Pickett et al. 1987a, 1987b, Pickett & McDonnel 1989, van der Maarel & Sykes 1993, and various papers by Peet and Christensen: Christensen 1977, Peet & Christensen 1980, 1988, Christensen & Peet 1981, 1984, Peet 1981, 1992, Peet et al. 2014) have focused instead on empirically and
experimentally examining and building on early theories and models in search for underlying mechanisms of succession. These more recent efforts revealed succession to be more complex than the foundational work suggested. Further, this contribution of reductionist, mechanistic-focused research – along with alternative mechanistic concepts proposed by Grime (1977, 1979), Tilman (1985), Huston & Smith (1987), and Smith & Huston (1989) – directed the field toward reevaluating concepts of classical succession in search for a more unifying and generalizable
effectively captured the efforts of many of the reductionist approaches that came out of this mid-to-late century work in their reductionist, population-based approach to understanding
succession. Specifically, their approach was to explain successional change at the community (or even ecosystem) level as a consequence of population processes in which variation in rates of reproduction, establishment, growth and mortality of individuals strongly influence community-level properties of succession.
Peet (1992) further broke this down by theorizing that secondary succession can be understood as a combination of two sets of linked processes: as a gradient-in-time (sensu Whittaker 1953; also see Pickett 1976, 1982) of physiological and life-history characteristics adapting to variable environments, and as a community undergoing competitive-sorting (sensu Margalef 1963, 1968) to produce a temporal gradient of increasing community organization and predictability. Although these processes can result in a “climax” community, both short-term and long-term environmental change can impact what that community looks like. This is made evident, for example, by pollen deposit studies (e.g., Davis 1981 and Huntley & Birks 1983) and climate change studies (e.g., Kullman 1987, 1988) that document long-term changes in regional vegetation.
Disturbance events (both local events such as tree mortality and larger events such as wind storms, fire, drought, ice, etc.) can both drive and reinitiate successional sequences (e.g., Bormann & Likens 1979, Turner et al. 2008). Large, episodic events are more likely to initiate drastic changes in a successional sequence, while more continuous events (e.g., individual tree mortality) are likely to expediate the current successional trajectory. However, as both can impact the short-term and long-term environmental characteristics experienced by succeeding
plant communities, all scales of disturbance should be considered when analyzing plant community dynamics.
Although new approaches and models proposed as a result of the pulse of mid-to-late-twentieth century research (see Peet & Christensen 1980 for a summary) predicted significant changes and variations in eastern forests, research completed in the last 30 years has
demonstrated further complexities in understanding succession. Some of this research has improved our understanding of the effects of land-use history (Dupouey et al. 2002, Taverna 2004, Flinn & Vellend 2005), latitudinal variation (Wright and Fridley 2010) and both small-scale (Palmer 1990) and large-small-scale (Fridley & Wright 2012) variations in soil properties on patterns of plant dynamics.
Additional research in the last 30 years has demonstrated novel changes in eastern forests that are not inherent in previous models or descriptions of climax communities.
Specifically, some studies have shown unprecedented compositional changes and decreases in putative climax species (Abrams & Downs 1990, Abrams 1998, Golubiewski & Urban 1998, Shumway et al. 2001, McDonald et al. 2002, 2003, Abrams 2003, Taverna et al. 2005, Schwartz 2007, Woods 2007, Israel 2011, Peet et al. 2014; including those owing to more than a century of fire suppression: Abrams & Nowacki 1992 and Nowacki & Abrams 2008), shifts in biomass and productivity trends (Myneni et al. 1997, Boisvenue & Running 2006, McMahon et al. 2010 – though see Foster et al. 2010 – , Phillips & Lewis 2014, and Pontius et al. 2016), increasing populations of white-tailed deer (Odocoileus virginiana) and subsequent impacts on plant communities (Stromayer & Warren 1997, Abrams 1998, Russell et al. 2001, Horsely et al. 2003, Côté et al. 2004, Keyser et al. 2005, Rossell et al. 2005, Israel 2011, Kribel et al. 2011, White 2012, J. Clark pers. comm.), increases in exotic species and their impacts on native flora (Lovett
et al. 2006, Israel 2011, and Luken 2014), and multi-year impacts due to major disturbances (e.g., hurricanes; see Xi et al. 2008, 2012, Xi & Peet 2011).
It is unclear from this recent research whether additional successional mechanisms need to be considered, whether roles of disturbances and human land-use in successional timelines need to be reevaluated, or whether global change has and will continue to alter vegetation
dynamics in unpredictable ways. Further, recent research (Israel, 2011) suggests that a number of these changes, at least those occurring in the southeastern U.S., are occurring at an increasing rate as compared to just a decade ago. Consequently, it is imperative to develop a better
understanding of these recently-recognized complexities, which are potentially arising from the interaction of successional processes with novel exogenous factors, including those resulting from global change. These complexities, however, are difficult to parse without long-term, frequent examination of forests.
Long-term studies
To understand succession, it is necessary to first identify the underlying patterns of community change through time (Cadenasso et al. 2008). Any subsequent understanding of underlying mechanisms and potential applications (e.g., use as a predictive tool for management) rely on a clear understanding of these patterns. The traditional method for determining patterns of change, still widely used today, is examination of chronosequences employing a space-for-time substitution. However, these studies make a series of assumptions (e.g., see Pickett 1989, Pickett et al. 2001, Cadenasso et al. 2008) that, if not met, preclude the ability to accurately predict successional change. In fact, there was recognition over thirty years ago that this approach can provide limited or misleading information concerning the nature of successional change and effectively no information concerning the extent and nature of variability in the
process (Christensen & Peet 1981). More recent empirical work also calls into question the validity of assumptions derived from chronosequence research (see Johnson & Miyanishi 2008). The continued use of chronosequences has been necessary for successional studies due to the paucity of term resampling data. However, future work will have to rely more on such long-term resampling efforts (including those that integrate many fields of study; Kampe et al. 2010) to effectively understand the complexities of succession and long-term ecological dynamics in general (Franklin 1989 and Rees et al. 2001).
Long-term resampling studies are unique in that they can track forest change directly instead of inferring change from stand characteristics or dendrochronological studies. These types of studies can incorporate fine-scale spatio-temporal structure, heterogeneity, and spatially-explicit processes (aspects that chronosequences, as well as other often-utilized approaches such as model simulations and idealized theoretical models, lack or ignore; Pickett et al., 2001). Long-term resampling studies further benefit from their ability to capture periodic events or system shifts (e.g., hurricanes and droughts) that may play a significant role in forest dynamics (Woods 2004, Cadenasso et al. 2008, Xi & Peet 2011). Without extensive pre- and post-disturbance data, it is almost impossible to understand the long-term impacts of unpredictable, mid-successional disturbances that otherwise play an important role in creating a mosaic of early and late
successional communities throughout forest regions (Pickett & White 1985). Finally, long-term resampling efforts can allow for improved understanding of decadal climate variation on successional trajectories. This understanding is imperative for a successional framework to be truly useful as a predictive tool, especially in the face of significant impacts due to a changing climate (IPCC 2014).
Although ideal for successional studies, long-term resampling projects are difficult and expensive to establish and maintain. Some exceptions include federally-funded programs such as the Long-Term Ecological Research (LTER) program, Long Term Research in Environmental Biology (LTREB) program, National Ecological Observatory Network (NEON), Smithsonian Center for Tropical Forest Science (CTFS), and the Forest Inventory and Analysis Program (FIA) of the U.S. Forest Service. Additional government-funded programs include networks in Australia (the Australian SuperSite Network; Karan et al. 2016) and China (Chinese Ecosystem Research Network; Fu et al. 2010). Ryan et al. (2017), however, acknowledge that a truly useful network of long-term studies must expand beyond a small number of large programs and include a much more extensive network driven by the work of college professors and amateur scientists (e.g., individual researchers, students, citizen scientists, etc.).
Another historical barrier that has impeded the existence of more long-term studies to date is that benefits of such studies can only be realized as the result of insight from research initiatives taken place before many of today’s successional complexities were well known or understood. As a result, those long-term studies that do exist rarely span greater than 20-30 years. Moreover, many of the longer-running long-term studies have involved few (< 5)
resampling efforts, potentially resulting in an inability to capture both fine-scale and longer-term dynamics. Some such existing long-term studies include: Bartlett Experimental Forest permanent plots (established 1931; Filip et al. 1960, Leak 1970, Leak & Filip 1977), Bartlett Experimental Forest inventory plots (est. 1931; Pontius et al. 2016), Porcupine Mountains permanent plots (1981; Frelich and Lorimer 1991, Lorimer et al. 2001, Lorimer & Halpin 2014, Halpin &
Lorimer 2016), Lady Park Wood permanent transects (est. 1945; Peterken & Jones 1987, 1989), NYBG Forest inventory surveys (est. 1930’s; Rudnicky & McDonnell 1989), Heart’s Content
plots (est. 1929; Lutz 1930, Whitney 1984, Rooney & Dress 1997), T.T. Munger Research Natural Area plots (est. 1947; Franklin & DeBell, 1988), Harvard Forest hurricane-damaged permanent plots (est. 1940; Hibbs 1983), and a series of permanent plots associated with the H. J. Andrews LTER program (est. 1910-1989; see Acker et al. 1998 and Acker et al. 2000).
A few quantitative, plot-based studies spanning greater than 30 years with a greater number of sampling efforts do exist. These few extant studies span early stages of
post-disturbance succession (Buell-Small Succession Study; est. 1958; see Cadenasso et al. 2008 for examples of previous work), aggrading, transitional and intermediate stages of succession (Duke Forest permanent sample plots; est. 1933 and later; see Xi et al. 2008 for list of previous
publications), and dynamics of old-growth forests (Huron Mountains study site; est. 1962; Woods 2000a and Dukes Research Natural Area; est. 1935; Woods 2000b, 2004, 2007).
One of the longest spanning resampling projects examining individual tree growth in temperate forests consists of a series of permanent sample plots in the Duke Forest of the North Carolina Piedmont (with many plots established in the 1930’s). The Duke Forest and the adjacent Piedmont landscape have long been used as a model system to study and explain secondary succession, so it is of no surprise that projects associated with these data have generated a substantial quantity of significant literature (e.g., see Xi et al. 2008 for examples), including work that has examined more than 50 years of resampled data (e.g., Christensen & Peet 1981, Golubiewski & Urban 1998, Peet et al. 2014). However, there are still no studies that have tracked forest dynamics of individual temperate forest stands across the entire successional sequence from old-field to mature hardwood forest. Specifically, there is still a lack of
population data from a continual resampling study through the later stages of the successional transition phase (see Bormann & Likens 1979, Peet & Christensen 1987, and Peet 1992 for
description of phases). Access to such continuous, extensive data is necessary for parsing out long-term successional dynamics from external factors while simultaneously examining the effects of disturbances on successional patterns and processes.
Current study
This dissertation is unique in that I have extended the long-term dataset of the Duke Forest used by Peet, Christensen, Xi and others to now span 80 years of resampled forest growth data for stands across a broad range of initial ages and site conditions. The dataset now spans the successional sequence through the transition phase of a number of successional pine plots and includes upwards of 80 years of data for later-stage hardwood (“climax”) dynamics as well. Given this data opportunity, I am equipped to examine the complex compositional and
community trends of these Piedmont forest plots in the context of a nearly complete successional trajectory that captures the transition of these stands from young even-aged pines to mixed hardwood communities. Further, I can examine these trends within the backdrop of a century marked by significant climatic, environmental, and ecosystem change.
The objectives of this dissertation, therefore, are to examine the long-term temporal dynamics of successional and late-stage eastern deciduous forests in the Piedmont of the southeastern United States and to determine whether these trends conform to traditional theoretical and observational theories or whether they appear to corroborate novel changes observed throughout eastern forests during the last 30 years. Specifically, this dissertation examines long-term trends in forest composition structure and growth patterns across all stages of succession in the Duke Forest through the exploration of the following key questions:
1. What are the long-term patterns of biomass accretion and forest growth rate in
that predict mortality, pine density, and lag in forest regeneration as major drivers of successional trends?
2. Do biomass accretion trends in established, mixed-age hardwood forests dispute equilibrating patterns expected by theoretical models and continue to aggregate similar to recently published trends, and, if so, do the observed patterns seem to be driven by increasing forest growth rates?
3. What is the long-term trend of tree species community composition throughout the course of secondary succession, and do successional trajectories conform to the predictions of classical, early-20th-century models or reflect more recently published trends?
4. What species-specific and environmental patterns appear to be driving larger community trends observed in the Duke Forest, and how do these drivers inform future study of forest dynamics in a changing world?
Questions 1 and 2 are addressed in Chapter 5 of this dissertation. Specifically, Chapter 5 examines the trends in biomass accretion, accretion rate, and growth rate of successional and hardwood forests in the Duke Forest and explores through the use of mixed models what characteristics of the forest best explain the trends observed. Questions 3 and 4 are addressed in Chapter 6. The analyses in Chapter 6 employ a suite of visual and multivariate statistical
approaches to characterize the complex forest systems and explore underlying explanations of the dynamics observed. The remaining chapters are dedicated to characterizing the unique Duke Forest permanent sample data used to address this dissertation’s research questions.
Long-term research initiatives are innately linked to the system in which the study was established. Further, long-term research is unavoidably marked by a rich and complex history of
sampling efforts, data intricacies, protocol nuances, personnel changes, and countless ancillary occurrences and objectives that arise with unforeseen natural circumstances. As such, a thorough characterization and understanding of the Duke Forest is necessary in guiding this dissertation’s analyses. Chapter 2 serves the primary role in this dissertation of documenting and describing in detail the long-term permanent sample plot data from the Duke Forest (and nearby G. W. Hill Forest) that inform most of this dissertation’s analyses. Chapter 3 provides a similar role for a second Duke Forest dataset containing larger permanent plots that served as a validation dataset in this dissertation’s analyses and could be used to extend the analyses described in Chapters 5 and 6. Chapter 4 introduces an interactive web application I built to explore the complex data in Chapters 2 and 3 in the context of ecological community analyses and which helped to inform the questions asked in subsequent chapters described above.
Overall, this dissertation utilizes the unique longevity of individual tree-growth data present in the Duke Forest (and nearby associated forests) to explore long-term forest dynamics that have been traditionally characterized using less direct approaches such as chronosequences and predictive computer models. In this way, this dissertation provides directly-resampled, long-term evidence to inform our understanding of forest dynamics within the context of a growing body of literature that questions traditional hypotheses in the face of global change.
REFERENCES
Abrams, M. D. 1998. The red maple paradox. BioScience 48:355–364.
Abrams, M. D. 2003. Where has all the white oak gone? BioScience 53:927–939.
Abrams, M. D., and G. J. Nowacki. 1992. Historical variation in fire, oak recruitment, and post-logging accelerated succession in central Pennsylvania. Bulletin of the Torrey Botanical Club 119:19–28.
Abrams, M. D., and J. A. Downs 1990. Successional replacement of old-growth white oak by mixed mesophytic hardwoods in southwestern Pennsylvania. Canadian Journal of Forest Research 20:1864–1870
Acker, S. A., McKee, W. A., Harmon, M. E., and Franklin, J. F., 1998. Long-term research on forest dynamics in the Pacific Northwest: A network of permanent forest plots. Pages 93– 106 in F. Dallmeier and J. A. Comiskey, editors. Forest biodiversity in North, Central and South America, and the Caribbean: Research and Monitoring, Man and the biosphere series, volume 21, The Parthenon Publishing Group, Inc., New York, New York, USA.
Acker, S. A., P. A. Harcombe, M. E. Harmon, and S. E. Greene. 2000. Biomass accumulation over the first 150 years in coastal Oregon Picea-Tsuga forest. Journal of Vegetation Science 11:725–738.
Billings, W. D. 1938. The structure and development of old field shortleaf pine stand and certain associated physical properties of the soil. Ecological Monographs 8:437–499.
Boisvenue, C., and S. W. Running. 2006. Impacts of climate change on natural forest
productivity - evidence since the middle of the 20th century. Global Change Biology 12: 862–82.
Bormann, F. H. 1953. Factors determining the role of loblolly pine and sweetgum in early old-field succession in the piedmont of North Carolina. Ecological Monographs 23:339–358. Bormann, F. H., and G. E. Likens.1979. Pattern and Process in a Forested Ecosystem,
Springer-Verlag, New York, New York, USA.
Cadenasso, M. L., S. J. Meiners, and S. T. A. Pickett. 2008. The success of succession: a symposium commemorating the 50th anniversary of the Buell-Small Succession Study. Applied Vegetation Science 12:3–8.
Christensen, N. L. 1977. Changes in structure, pattern and diversity associated with climax forest maturation in Piedmont, North Carolina. American Midland Naturalist 97:178–188.
Christensen, N. L., and R. K. Peet 1981. Secondary forest succession on the North Carolina Piedmont. Pages 230–245 in D. C. West, H. H. Shugart and D. B. Botkin, editors. Forest succession: Concepts and application. Springer-Verlag, New York, New York, USA. Christensen, N. L., and R. K. Peet. 1984. Convergence during secondary forest succession.
Journal of Ecology 72:25–36.
Clements, F. E. 1916. Plant succession: an analysis of the development of vegetation. Carnegie Institution of Washington Publ. 242. Washington DC: Carnegie Institution of
Washington.
Clements, F. E. 1928. Plant succession and indicators. H.W. Wilson, Co., New York, New York.
Connell, J. H., and R. O. Slatyer. 1977. Mechanisms of succession in natural communities and their role in community stability and organization. American Naturalist 111:1119–1144. Côté, S. D., T. P. Rooney, J. P. Tremblay, C. Dussault, and D. M. Waller. 2004. Ecological
impacts of deer overabundance. Annual Review of Ecology, Evolution, and Systematics 35:113–147.
Cowles, H. C. 1899. The ecological relations of the vegetation of the sand dunes of Lake Michigan. Botanical Gazette 27:95–391.
Cowles, H. C. 1901. The physiographic ecology of Chicago and vicinity: a study of the origin, development, and classification of plant societies. Botanical Gazette 31:73–108, 145– 182.
Cowles, H. C. 1911. The causes of vegetative cycles. Botanical Gazette 51:161–183.
Davis, M. B. 1981. Quaternary history and the stability of forest communities. Pages 132–53 in D. C. West, H. H. Shugart and D. B. Botkin, editors. Forest succession: Concepts and application. Springer-Verlag, New York, New York, USA.
Drury, W. H., and I. C. T. Nisbet. 1973. Succession. Journal of the Arnold Arboretum. 54:331– 368.
Dupouey, J. L., E. Dambrine, J. D. Laffite, and C. Moares. 2002. Irreversible impact of past land use on forest soils and biodiversity. Ecology 83:2978–2984.
Egler, F. E. 1954. Vegetation science concepts. I. Initial floristic composition - a factor in old-field vegetation development. Vegetatio 4:412–17.
Filip, S. M., D. A. Marquis, and W. B. Leak. 1960. Development of old-growth northern hardwoods on Bartlett Experimental Forest-a 22-year record. USDA Forest Service, Northeastern Forest Experiment Station Paper 135.
Flinn, K. M., and M. Vellend. 2005. Recovery of forest plant communities in post-agricultural landscapes. Frontiers in Ecology and the Environment 3:243–250.
Foster, J. R., J. I. Burton, J. A. Forrester, F. Liu, J. D. Muss, F. M. Sabatini, R. M. Scheller, and D. J. Mladenoff. 2010. Evidence for a recent increase in forest growth is questionable. Proceedings of the National Academy of Sciences 107:E86–E87.
Franklin J. F. 1989. Importance and justification of long-term studies in ecology. Pages 3–19 in G. E. Likens, editor. Long-term studies in ecology. Springer, New York, New York, USA.
Franklin, J. F., and D. S. DeBell. 1988. Thirty-six years of tree population change in an old-growth Pseudotsuga-Tsuga forest. Canadian Journal of Forest Research 5:913–934. Frelich, L. E., and C. G. Lorimer. 1991. A simulation of landscape-level stand dynamics in the
northern hardwood region. Journal of Ecology 79:223–233.
Fridley, J. D., and J. P. Wright. 2012. Drivers of secondary succession rates across temperate latitudes of the Eastern USA: climate, soils, and species pools. Oecologia 168:1069-1077.
Fu, B., S. Li, X. Yu, P. Yang, G. Yu, R. Feng, R., and X. Zhuang. 2010. Chinese ecosystem research network: Progress and perspectives. Ecological Complexity 7:225–233.
Gleason, H. A. 1926. The individualistic concept of the plant association. Bulletin of the Torrey Botanical Club 53:1–20.
Golubiewski, N. E., and D. L. Urban. 1998. Land-Use Legacies and Successional Convergence in a Southeastern Piedmont Forest. Unpublished manuscript, Duke University, Durham, NC. 47 pp.
Grime, J. P. 1977. Evidence for the existence of three primary strategies in plants and its relevance to ecological and evolutionary theory. American Naturalist 111:1169–1194. Grime, J. P. 1979. Plant strategies and vegetation processes. Wiley. Chichester, New York, New
York, USA.
Halpin, C. R., and C. G. Lorimer. 2016. Long‐term trends in biomass and tree demography in northern hardwoods: an integrated field and simulation study. Ecological Monographs 86:78–93.
Hibbs, D. E. 1983. Forty years of forest succession in central New England. Ecology 64:1394– 1401.
Horsley, S. B., S. L. Stout, and D. S. DeCalesta. 2003. White-tailed deer impact on the
Hough, A. F. 1965. A twenty-year record of understory vegetational change in a virgin Pennsylvania forest. Ecology 46:370–373.
Huntley. B., and H. J. B. Birks. 1983. An atlas of past and present pollen maps for Europe: 0-13000 years ago. Cambridge University Press, Cambridge, UK.
Huston, M., and T. Smith. 1987. Plant succession: Life history and competition. American Naturalist 130:168–198.
IPCC. 2014. Climate Change 2014: Impacts, adaptation, and vulnerability. Part B: Regional aspects. Contribution of Working Group II to the 5th Assessment Report of the
Intergovernmental Panel on Climate Change. Barros, V. R., C. B. Field, D. J. Dokken, M. D. Mastrandrea, K. J. Mach, T. E. Bilir, M. Chatterjee, K. L. Ebi, Y. O. Estrada, R. C. Genova, B. Girma, E. S. Kissel, A. N. Levy, S. MacCracken, P. R. Mastrandrea, and L. L. White, editors. Cambridge University Press, Cambridge, United Kingdom and New York, NY, USA, pp. 688.
Israel, K. A. 2011. Thirty-three years of change in North Carolina Piedmont forests. Master’s thesis, University of North Carolina, Chapel Hill, NC.
Johnson, E. A., and K. Miyanishi. 2008. Testing the assumptions of chronosequences in succession. Ecology Letters 11:419–431.
Kampe, T. U., B. R. Johnson, M. Kuester, and M. Keller. 2010. NEON: The first continental-scale ecological observatory with airborne remote sensing of vegetation canopy biochemistry and structure. Journal of Applied Remote Sensing 4:043510.
Karan, M., M. Liddell, S. M. Prober, A. Arndt, J. Beringer, M. Boer, J. Cleverly, D. Eamus, P. Grace, E. Van Gorsel, and J. M. Hero. 2016. The Australian SuperSite Network: A continental, long-term terrestrial ecosystem observatory. Science of The Total Environment 568:1263–1274.
Keever, C. 1950. Causes of succession on old fields of the Piedmont, North Carolina. Ecological Monographs 20:231–250.
Keyser, P.D., D. C. Guynn Jr., and H. S. Hill, Jr. 2005. Population density – physical condition relationships in white-tailed deer. Journal of Wildlife Management 69:356–365.
Kozlowski, T. T. 1949. Light and water in relation to growth and competition of Piedmont forest tree species. Ecological Monographs 19:207–231.
Kribel, J. R., K. B. Kolman, and S. Ware. 2011. Rapid change in sapling and seedling layers in an otherwise stable hardwood forest: an effect of deer browsing. Castanea 76:140–148. Kullman, L. 1987. Little ice age decline of a cold marginal Pinus sylvestris forest 111 the
Kullman, L. 1988. Short-term approach to tree-limit and thermal climate: evidence from Pinus sylvestris in the Swedish Scandes. Annales Botanici Fennici 25:219–27.
Leak, W. B. 1970. Successional change in northern hard- woods predicted by birth and death simulations. Ecology 51:794-801.
Leak, W. B., and S. M. Filip, 1977. Thirty-eight years of group selection in New England northern hardwoods. Journal of Forestry 75:641–643.
Lorimer, C. G., and C. R. Halpin. 2014. Classification and dynamics of developmental stages in late-successional temperate forests. Forest Ecology and Management 334:344–357. Lorimer, C. G., S. E. Dahir, and E. V. Nordheim. 2001. Tree mortality rates and longevity in
mature and old-growth hemlock-hardwood forests. Journal of Ecology 89:960–971. Lovett, G. M., C. D. Canham, M. A. Arthur, K. C. Weathers, and R. D. Fitzhugh. 2006. Forest
ecosystem responses to exotic pests and pathogens in eastern North America. BioScience 56:395–405.
Luken, James O. 2014. Forest invasions: Perceptions, impacts, and management questions. Pages 356–368 in F. S. Gilliam and M. R. Roberts, editors. The herbaceous layer in forests of eastern North America, second edition, Oxford University Press, Oxford, UK.
Lutz, H. J. 1930. The vegetation of Heart's Content, a virgin forest in northwestern Pennsylvania. Ecology 11:1–29
Margalef, R. 1963. On certain unifying principles in ecology. American Naturalist 97:357–374. Margalef, R. 1968. Perspectives in ecological theory, University of Chicago Press, Chicago,
Illinois, USA.
McDonald, R. I., R. K. Peet, and D. L. Urban. 2002. Environmental correlates of oak decline and red maple increase in the North Carolina Piedmont. Castanea 67:84–95.
McDonald, R. I., R. K. Peet, and D. L. Urban. 2003. Spatial pattern of Quercus regeneration limitation and Acer rubrum invasion in a Piedmont forest. Journal of Vegetation Science 14:441–450.
McMahon, S. M., G. P. Parker, and D. R. Miller. 2010. Evidence for a recent increase in forest growth. Proceedings of the National Academy of Sciences 107:3611–3615.
Myneni, R., C. Keeling, C. Tucker, G. Asrar, and R. Nemani. 1997. Increased plant growth in the northern high latitudes from 1981 to 1991. Nature 386:698–702.
Nowacki, G. J., and M. D. Abrams. 2008. The demise of fire and “mesophication” of forests in the eastern United States. BioScience 58:123–138.
Odum, E. P. 1969. The strategy of ecosystem development. Science 164:262–270. Oosting, H. J. 1942. An ecological analysis of the plant communities of Piedmont, North
Carolina. American Midland Naturalist 28:1–126.
Palmer, M. W. 1990. Spatial scale and patterns of species environment relationships in hardwood forest of the North Carolina Piedmont. Coenoses 5:79–87.
Peet, R. K. 1981. Changes in biomass and production during secondary forest succession. Pages 324–338 in D. C. West, H. H. Shugart and D. B. Botkin, editors. Forest succession: Concepts and application. Springer-Verlag, New York, New York, USA.
Peet, R. K. 1992. Community structure and ecosystem properties. Pages 102–151 in D. C. Glenn-Lewin, R. K. Peet, and T. T. Veblen, editors. Plant succession: Theory and prediction. Chapman and Hall, London, UK.
Peet, R. K., and N. L. Christensen. 1980. Succession: a population process. Vegetatio 43:131– 140.
Peet, R. K., and N. L. Christensen. 1987. Competition and tree death. BioScience 37:586–595. Peet, R. K., and N. L. Christensen. 1988. Changes in species diversity during secondary forest
succession on the North Carolina Piedmont. Pages 233–245 in H. J. During, M. J. A. Werger, and J. Willems, editors. Diversity and pattern in plant communities. SPB Academic Publishing, The Hague, Netherlands.
Peet, R. K., N. L. Christensen, and F. S. Gilliam. 2014. Temporal patterns in herbaceous layer communities of the North Carolina Piedmont. Pages 277–293 in F. S. Gilliam and M. R. Roberts, editors. The herbaceous layer in forests of eastern North America, second edition, Oxford University Press, Oxford, UK.
Peterken, G. F., and E. W. Jones. 1989. Forty years of change in Lady Park Wood: the young-growth stands. Journal of Ecology 77:401–429.
Peterken, G., and E. Jones. 1987. Forty Years of Change in Lady Park Wood: The Old-Growth Stands. Journal of Ecology 75:477–512.
Phillips O. L., and S. L. Lewis. 2014. Recent changes in tropical forest biomass and dynamics. Pages 77–108 in D. A. Coomes, D. Burslem and W. D. Simonson, editors. Forests and global change. Cambridge University Press, Cambridge, UK.
Pickett, S. T. A. 1976. Succession: an evolutionary interpretation. American Naturalist 110:107– 119.
Pickett, S. T. A. 1982. Population patterns through twenty years of oldfield succession. Vegetatio 49:45–59.
Pickett, S. T. A. 1989. Space for time substitution as an alternative to long-term studies. Pages 110–135 in G. E. Likens, editor. Long-term studies in ecology. Springer, New York, NY, USA.
Pickett, S. T. A., and M. J. McDonnell. 1989. Changing perspectives in community dynamics: a theory of successional forces. Trends in ecology & evolution 4:241–245.
Pickett, S. T. A., and P. S. White. 1985. The Ecology of Natural Disturbances and Patch Dynamics. Academic Press, New York, NY.
Pickett, S. T. A., M. L. Cadenasso, and S. Bartha. 2001. Implications from the Buell-Small Succession Study for vegetation restoration. Applied Vegetation Science 4:41–52. Pickett. S. T. A., S. C. Collins, and J. J. Armesto. 1987a. Models, mechanisms and pathways of
succession. Botanical Review 53:335–71.
Pickett. S. T. A., S. C. Collins, and J. J. Armesto. 1987b. A hierarchical consideration of causes and mechanisms of succession. Vegetatio 69:109–14.
Pontius, J., J. M. Halman, and P. G. Schaberg. 2016. Seventy years of forest growth and
community dynamics in an undisturbed northern hardwood forest. Canadian Journal of Forest Research 46:959–967.
Rees, M., R. Condit, M. Crawley, S. Pacala, and D. Tilman. 2001. Long-term studies of vegetation dynamics. Science 293:650–655.
Rooney, T. P., and W. J. Dress. 1997. Species Loss Over Sixty-Six Years in the Ground-Layer Vegetation of Heart's Content, an Old-Growth Forest in Pennsylvania, USA. Natural Areas Journal 17:297–305.
Rossell Jr, C. R., B. Gorsira, and S. Patch. 2005. Effects of white-tailed deer on vegetation structure and woody seedling composition in three forest types on the Piedmont Plateau. Forest Ecology and Management 210:415–424.
Rudnicky, J., and M. McDonnell. 1989. Forty-Eight Years of Canopy Change in a Hardwood-Hemlock Forest in New York City. Bulletin of the Torrey Botanical Club 116:52–64. Russell, F. L., D. B. Zippin, and N. L. Fowler. 2001. Effects of white-tailed deer (Odocoileus
virginianus) on plants, plant populations and communities: a review. The American Midland Naturalist 146:1–26.
Ryan, W. H., E. S. Gornish, L. Christenson, S. Halpern, S. Henderson, G. LeBuhn, and T. E. Miller. 2017. Initiating & managing long-term data with amateur scientists. The American Biology Teacher 79:28–34.
Schwartz, M. J. 2007. Vegetation change over decadal and century scales in the North Carolina Piedmont. Ph.D. dissertation, Duke University, Durham, North Carolina.
Shumway, D. L., M. D. Abrams, and C. M. Ruffner. 2001. A 400-year history of fire and oak recruitment in an old-growth oak forest in western Maryland, U.S.A. Canadian Journal of Forest Research 31:1437–1443.
Smith, T., and M. Huston. 1989. A theory of the spatial and temporal dynamics of plant communities. Vegetatio 83:49–69.
Stromayer, K. A. K., and R. J. Warren. 1997. Are overabundant deer herds in the eastern United States creating alternate stable states in forest plant communities? Wildlife Society Bulletin 25:227–234.
Taverna, K. 2004. Mature hardwood forests of the central Piedmont of North Carolina: landscape distribution and understory change. Master’s thesis, University of North Carolina, Chapel Hill, NC.
Taverna, K., R. K. Peet, and L. C. Phillips. 2005. Long-term change in ground-layer vegetation of deciduous forests of the North Carolina Piedmont, USA. Journal of Ecology 93:202– 213.
Tilman, D. 1985. The resource-ratio hypothesis of plant succession. American Naturalist 125:827–852.
Turner, M. G., W. L. Baker, C. J. Peterson, and R. K. Peet. 1998. Factors influencing succession: Lessons from large, infrequent natural disturbances. Ecosystems 1:511–523.
van der Maarel, E., and M. T. Sykes. 1993. Small-scale plant species turnover in a limestone grassland: the carousel model and some comments on the niche concept. Journal of Vegetation Science 4:179–188.
Wells, B. W. 1942. Ecological problems of the southeastern United States coastal plain. Botanical Review 8:533–61.
White, M. A. 2012. Long-term effects of deer browsing: Composition, structure and productivity in a northeastern Minnesota old-growth forest. Forest Ecology and Management
269:222–228.
Whitney, G. G. 1984. Fifty years of change in the arboreal vegetation of Heart's Content, an old-growth hemlock – white pine – northern hardwood stand. Ecology 65:403–408.
Whittaker, R. H. 1953. A consideration of climax theory: the climax as a population and pattern. Ecological Monographs 23:41–78.
Woods, K. D. 2000a. Dynamics in late-successional hemlock-hardwood forests over three decades. Ecology 81:110–126.
Woods, K. D. 2000b. Long-term change & spatial pattern in a late-successional hemlock-northern hardwood forest. Journal of Ecology 88:267–282.
Woods, K. D. 2004. Intermediate disturbance in a late-successional hemlock-northern hardwood forest. Journal of Ecology 92:464–476.
Woods, K. D., 2007. Predictability, contingency, and convergence in late succession: slow systems and complex data-sets. Journal of Vegetation Science 18:543–554.
Wright, J. P., and J. D. Fridley. 2010. Biogeographic synthesis of secondary succession rates in eastern North America. Journal of Biogeography 37:1584–1596.
Xi, W., and R. K. Peet. 2011. The complexity of catastrophic wind impacts on temperate forests. Pages 503–534 in A. Lupo, editor. Recent hurricane research: Climate, dynamics and societal impacts. Intech, Vienna, Austria.
Xi, W., R. K. Peet, and D. L. Urban. 2008. Changes in forest structure, species diversity and spatial pattern following hurricane disturbance in a Piedmont North Carolina forest, USA. Journal of Plant Ecology 1:43–57.
Xi, W., R. K. Peet, and D. L. Urban. 2012. The impacts of a large, infrequent hurricane on understory sapling dynamics and diversity in North Carolina Piedmont forests, USA. Tree and Forestry Science and Biotechnology 6:51–59.
CHAPTER 2: LONG-TERM PERMANENT SAMPLE PLOTS IN DUKE FOREST, NORTH CAROLINA: 80 YEARS OF INDIVIDUAL TREE GROWTH DATA
Summary
I describe a data set of tree inventory and growth collected across 80 years in mapped permanent sample plots in the Duke Forest and nearby Hill Forest both located in the
northeastern North Carolina Piedmont, USA. The purpose of these data is to document long-term trends in forest composition and dynamics. There are thirty-seven extant plots (405 – 1940 m2)
that were established in the 1930s (n = 34) and 1940s (n=3) that have each been sampled 12 – 16 times with between-sample periods ranging from 2 – 23 years. Twenty-eight plots represent successional old-field pine (primarily Pinus taeda) stands with known age and stem density at plot establishment. These stands vary in age since initial post-abandonment pine growth (9 – 30 years) and initial stem density (600 – 29000 stems/ha) and are currently at varying levels of transition to hardwood forests. The remaining nine plots represent relatively “mature” hardwood forests that have been mixed-aged hardwood stands since plot inception 70 – 80 years ago. Two of the plots represent bottomland hardwood communities, while the remaining are representative of upland oak-hickory stands with various soil properties. Diameter and height measurements of stems individually identified to species allows for direct quantification of stand growth and development. Additionally, records of tree condition permit accounting for tree damage and mortality, especially in relation to experimental manipulations in some plots prior to 1960 and damage that resulted from two hurricanes (Hurricane Hazel in 1954 and Hurricane Fran in 1996) that variously impacted plots. Soils were collected for each plot in 2016 and analyzed for
nutrients, pH, soil texture and organic matter. The described data have previously been used to examine tree population processes, predictability and convergence in composition, mechanisms of tree competition, patterns of mortality, changes in biomass and production, changes in genetic structure, impacts of land use legacies, and impacts of hurricanes and wind events on long-term forest dynamics. The unprecedented temporal length of the data will continue to be critically important for investigation of long-standing, unconfirmed theories regarding succession and for parsing novel trends in Piedmont forest dynamics from theoretical predictions.
Key words
Permanent sample plots, longitudinal study, secondary succession, Piedmont, North Carolina, forest, tree growth.
Introduction
Individual tree growth data have been methodically collected from permanent sample plots (PSPs) in North Carolina Piedmont forests for periods of up to 80 years. Specifically, these data document long-term forest growth and dynamics in the Duke Forest and the nearby G. W. Hill Forest in Orange and Durham Counties, North Carolina, USA from 1933 through 2013. This data chapter serves to explain and document these data, which are available in supplementary files included with this dissertation with file names provided throughout this chapter.
Professors Clarence F. Korstian and Theodore. S. Coile of the Duke School of Forestry initially directed the Duke Forest PSPs project and established 87 plots between 1933 and 1936 of which 34 are still actively sampled and included as part of these data. Korstian established the plots to monitor tree growth and species composition changes within stands of various age and site condition and subject to various silvicultural management practices. To achieve these goals,