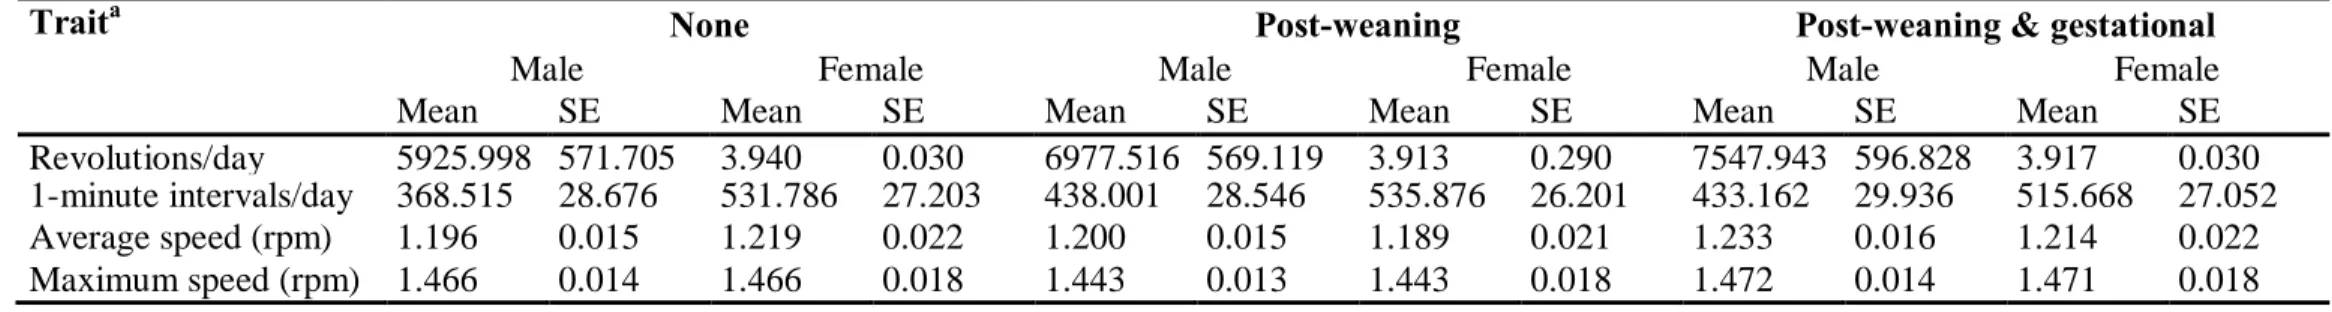
Table S1 Estimated marginal means and standard errors from SPSS, corresponding to tests (separate-sex analyses) presented in Table 1. Means represent the effects of maternal exercise condition (none, post-weaning only, post-weaning and gestational) on offspring (G2) exercise traits, body weight, body composition, and change in body weight and composition as a result of exercise.
Traita None Post-weaning Post-weaning & gestational
Male Female Male Female Male Female
Mean SE Mean SE Mean SE Mean SE Mean SE Mean SE
Revolutions/day 5925.998 571.705 3.940 0.030 6977.516 569.119 3.913 0.290 7547.943 596.828 3.917 0.030 1-minute intervals/day 368.515 28.676 531.786 27.203 438.001 28.546 535.876 26.201 433.162 29.936 515.668 27.052 Average speed (rpm) 1.196 0.015 1.219 0.022 1.200 0.015 1.189 0.021 1.233 0.016 1.214 0.022 Maximum speed (rpm) 1.466 0.014 1.466 0.018 1.443 0.013 1.443 0.018 1.472 0.014 1.471 0.018
a
Revolutions/day (distance), 1-minute intervals/day(time, cumulative 1-minute intervals in which at least one revolution was recorded), average running speed (total revolutions/time spent running), and maximum running speed (highest number of revolutions in any 1-min interval within a 24 h period).
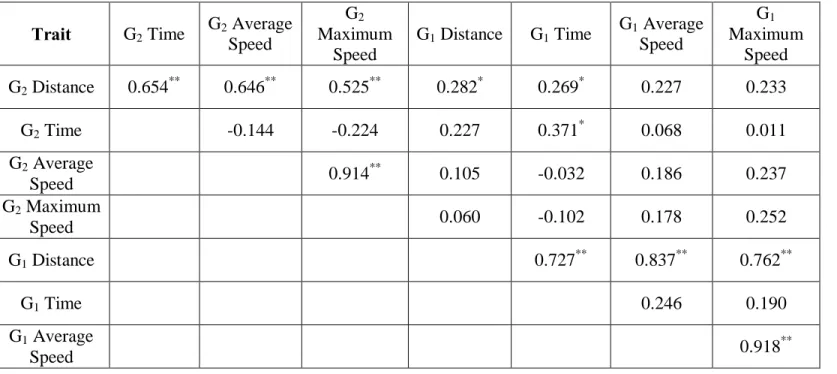
Table S2 Pearson partial correlations for maternal (G1) and offspring (G2) mean voluntary running traits. Correlations were generated with individuals (G1 and G2) representing two of three maternal exercise conditions (post-weaning only, post-weaning and gestational).
Trait G2 Time G2 Average Speed G2 Maximum Speed G1 Distance G1 Time G1 Average Speed G1 Maximum Speed G2 Distance 0.654** 0.646** 0.525** 0.282* 0.269* 0.227 0.233 G2 Time -0.144 -0.224 0.227 0.371* 0.068 0.011 G2 Average Speed 0.914 ** 0.105 -0.032 0.186 0.237 G2 Maximum Speed 0.060 -0.102 0.178 0.252 G1 Distance 0.727** 0.837** 0.762** G1 Time 0.246 0.190 G1 Average Speed 0.918 **
Pearson partial correlations (r; controlling for sex) are shown for revolutions/day (distance), 1-minute intervals/day(time, cumulative 1-minute intervals in which at least one revolution was recorded), average running speed (total revolutions/time spent running), and maximum running speed (highest number of revolutions in any 1-min interval within a 24 h period). G1 values are the averages of days 33 and 34 of wheel access. The G1 running trait values are approximately age matched to the values of the offspring (G2). Running wheel circumference was 1.1 m. *p < 0.05. **p < 0.001.
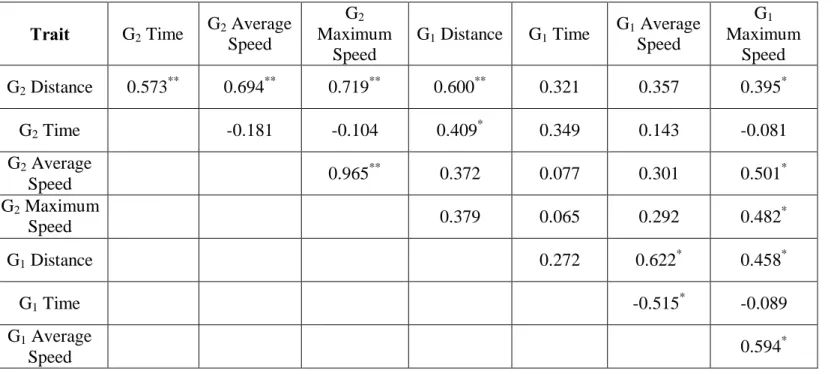
Table S3 Pearson partial correlations for maternal-gestational (G1) and offspring (G2) mean voluntary running traits. Correlations were generated with individuals (G1 and G2) representing one of three maternal exercise conditions (post-weaning and gestational).
Trait G2 Time G2 Average Speed G2 Maximum Speed G1 Distance G1 Time G1 Average Speed G1 Maximum Speed G2 Distance 0.573** 0.694** 0.719** 0.600** 0.321 0.357 0.395* G2 Time -0.181 -0.104 0.409* 0.349 0.143 -0.081 G2 Average Speed 0.965 ** 0.372 0.077 0.301 0.501* G2 Maximum Speed Speed 0.379 0.065 0.292 0.482* G1 Distance 0.272 0.622* 0.458* G1 Time -0.515* -0.089 G1 Average Speed 0.594 *
Pearson partial correlations (r; controlling for sex) are shown for revolutions/day (distance), 1-minute intervals/day(time, cumulative 1-minute intervals in which at least one revolution was recorded), average running speed (total revolutions/time spent running), and maximum running speed (highest number of revolutions in any 1-min interval within a 24 h period). G1 running trait values are the means of days 48-54 of wheel access. Days 48-54 occurred after a confirmed pregnancy (presence of vaginal plugs) and removal of the male, but prior to giving birth. Running wheel circumference was 1.1 m. *p < 0.05. **p < 0.001.
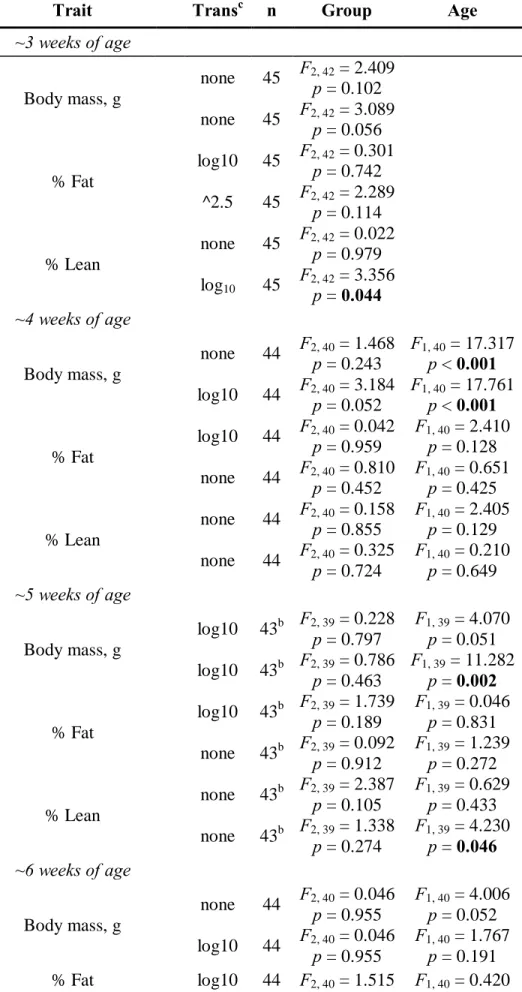
Table S4 Separate-sex analyses of offspring (G2) body composition traits at different ages and in response to 6 days of voluntary wheel running.
Trait Transc n Group Age
~3 weeks of age Body mass, g ♂ none 45 F2, 42p = 0.102 = 2.409 ♀ none 45 F2, 42 = 3.089 p = 0.056 % Fat ♂ log10 45 F2, 42 = 0.301 p = 0.742 ♀ ^2.5 45 F2, 42 = 2.289 p = 0.114 % Lean ♂ none 45 F2, 42 = 0.022 p = 0.979 ♀ log10 45 F2, 42p = 0.044 = 3.356 ~4 weeks of age Body mass, g ♂ none 44 F2, 40 = 1.468 p = 0.243 F1, 40 = 17.317 p < 0.001 ♀ log10 44 F2, 40 = 3.184 p = 0.052 F1, 40 = 17.761 p < 0.001 % Fat ♂ log10 44 F2, 40 = 0.042 p = 0.959 F1, 40 = 2.410 p = 0.128 ♀ none 44 F2, 40 = 0.810 p = 0.452 F1, 40 = 0.651 p = 0.425 % Lean ♂ none 44 F2, 40p = 0.855 = 0.158 F1, 40p = 0.129 = 2.405 ♀ none 44 F2, 40 = 0.325 p = 0.724 F1, 40 = 0.210 p = 0.649 ~5 weeks of age Body mass, g ♂ log10 43b F2, 39 = 0.228 p = 0.797 F1, 39 = 4.070 p = 0.051 ♀ log10 43b F2, 39 = 0.786 p = 0.463 F1, 39 = 11.282 p = 0.002 % Fat ♂ log10 43b F2, 39 = 1.739 p = 0.189 F1, 39 = 0.046 p = 0.831 ♀ none 43b F2, 39 = 0.092 p = 0.912 F1, 39 = 1.239 p = 0.272 % Lean ♂ none 43b F2, 39 = 2.387 p = 0.105 F1, 39 = 0.629 p = 0.433 ♀ none 43b F2, 39 = 1.338 p = 0.274 F1, 39 = 4.230 p = 0.046 ~6 weeks of age Body mass, g ♂ none 44 F2, 40p = 0.955 = 0.046 F1, 40p = 0.052 = 4.006 ♀ log10 44 F2, 40 = 0.046 p = 0.955 F1, 40 = 1.767 p = 0.191 % Fat ♂ log10 44 F2, 40 = 1.515 F1, 40 = 0.420
p = 0.232 p = 0.521 ♀ none 44 F2, 40p = 0.821 = 0.198 F1, 40p = 0.938 = 0.006 % Lean ♂ ^6.0 44 F2, 40 = 1.218 p = 0.306 F1, 40 = 1.003 p = 0.322 ♀ none 44 F2, 40 = 0.355 p = 0.703 F1, 40 = 0.039 p = 0.844 ~7 weeks of age Body mass, g ♂ log10 44 F2, 40 = 0.214 p = 0.808 F1, 40 = 4.700 p = 0.036 ♀ log10 44 F2, 40 = 0.050 p = 0.951 F1, 40 = 6.546 p = 0.014 ~8-9 weeks of agec Body mass, g ♂ none 44 F2, 40p = 0.827 = 0.191 F1, 40p = 0.315 = 1.035 ♀ log10 44 F2, 40 = 0.209 p = 0.812 F1, 40 = 1.866 p = 0.180 % Fat ♂ log10 44 F2, 40 = 1.763 p = 0.185 F1, 40 = 1.600 p = 0.213 ♀ none 44 F2, 40 = 0.615 p = 0.546 F1, 40 = 0.029 p = 0.867 % Lean ♂ ^5.0 44 F2, 40 = 1.649 p = 0.205 F1, 40 = 2.143 p = 0.151 ♀ none 44 F2, 40p = 0.743 = 0.299 F1, 40p = 0.674 = 0.179 Post exercise Body Mass, g ♂ ^2.5 44 F2, 40 = 0.840 p = 0.439 F1, 40 = 0.005 p = 0.944 ♀ log10 44 F2, 40 = 0.367 p = 0.695 F1, 40 = 1.227 p = 0.275 % Fat ♂ log10 44 F2, 40 = 1.625 p = 0.210 F1, 40 = 2.240 p = 0.142 ♀ ^0.5 44 F2, 40 = 0.136 p = 0.873 F1, 40 = 0.001 p = 0.971 % Lean ♂ ^5.0 44 F2, 40p = 0.126 = 2.178 F1, 40p = 0.024 = 5.503 ♀ none 44 F2, 40 = 0.139 p = 0.871 F1, 40 = 0.198 p = 0.659 % Change in mass ♂ none 43b F2, 39 = 2.308 p = 0.113 F1, 39 = 1.907 p = 0.175 ♀ none 44 F2, 40 = 0.032 p = 0.969 F1, 40 = 0.880 p = 0.354 % Change in % fat ♂ none 43b F2, 39 = 0.537 p = 0.589 F1, 39 = 0.604 p = 0.442 ♀ none 44 F2, 40p = 0.387 = 0.972 F1, 40p = 0.998 < 0.001 % Change in % lean ♂ none 43b F2, 39 = 3.228 p = 0.050 F1, 39 = 0.402 p = 0.718 ♀ none 44 F2, 40 = 0.009 p = 0.992 F1, 40 = 2.245 p = 0.142
Data were from general linear models [Univariate GLM ANOVA (SPSS, Chicago, IL)] and transformeda as necessary to improve normality of residuals. Significance levels (P-values: bold indicates p < 0.05) for the effect of maternal (G1) exercise group (none, post-weaning only, post-weaning and gestational). Age, days since birth at the time of phenotypic measurement was included as a covariate where appropriate. bRemoval of one or more outliers based on formal statistical test [37,38]. cAt ~8 weeks of age body composition measures were taken immediately prior to (in) and following (out) 6 days of wheel access. Percent body fat (and lean) was calculated as (fat mass/body mass)*100. Percent change variables were calculated as [(out - in)/in]*100.
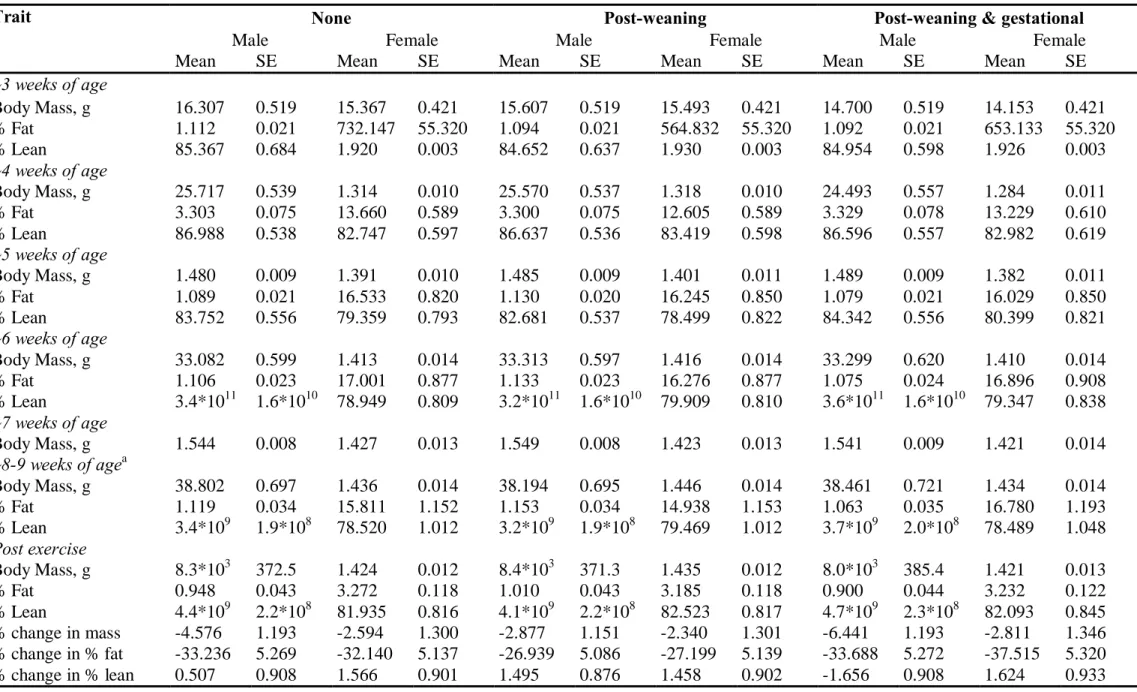
Table S5 Estimated marginal means and standard errors from SPSS, corresponding to tests (separate-sex analyses) presented in Supplementary Table 4. Note that data transformation is not uniform for males and females for a given trait. Means represent the effects of maternal exercise condition (none, post-weaning only, post-post-weaning and gestational) on offspring (G2) body weight, body composition, and change in body weight and composition as a result of exercise.
Trait None Post-weaning Post-weaning & gestational
Male Female Male Female Male Female
Mean SE Mean SE Mean SE Mean SE Mean SE Mean SE
~3 weeks of age Body Mass, g 16.307 0.519 15.367 0.421 15.607 0.519 15.493 0.421 14.700 0.519 14.153 0.421 % Fat 1.112 0.021 732.147 55.320 1.094 0.021 564.832 55.320 1.092 0.021 653.133 55.320 % Lean 85.367 0.684 1.920 0.003 84.652 0.637 1.930 0.003 84.954 0.598 1.926 0.003 ~4 weeks of age Body Mass, g 25.717 0.539 1.314 0.010 25.570 0.537 1.318 0.010 24.493 0.557 1.284 0.011 % Fat 3.303 0.075 13.660 0.589 3.300 0.075 12.605 0.589 3.329 0.078 13.229 0.610 % Lean 86.988 0.538 82.747 0.597 86.637 0.536 83.419 0.598 86.596 0.557 82.982 0.619 ~5 weeks of age Body Mass, g 1.480 0.009 1.391 0.010 1.485 0.009 1.401 0.011 1.489 0.009 1.382 0.011 % Fat 1.089 0.021 16.533 0.820 1.130 0.020 16.245 0.850 1.079 0.021 16.029 0.850 % Lean 83.752 0.556 79.359 0.793 82.681 0.537 78.499 0.822 84.342 0.556 80.399 0.821 ~6 weeks of age Body Mass, g 33.082 0.599 1.413 0.014 33.313 0.597 1.416 0.014 33.299 0.620 1.410 0.014 % Fat 1.106 0.023 17.001 0.877 1.133 0.023 16.276 0.877 1.075 0.024 16.896 0.908 % Lean 3.4*1011 1.6*1010 78.949 0.809 3.2*1011 1.6*1010 79.909 0.810 3.6*1011 1.6*1010 79.347 0.838 ~7 weeks of age Body Mass, g 1.544 0.008 1.427 0.013 1.549 0.008 1.423 0.013 1.541 0.009 1.421 0.014 ~8-9 weeks of agea Body Mass, g 38.802 0.697 1.436 0.014 38.194 0.695 1.446 0.014 38.461 0.721 1.434 0.014 % Fat 1.119 0.034 15.811 1.152 1.153 0.034 14.938 1.153 1.063 0.035 16.780 1.193 % Lean 3.4*109 1.9*108 78.520 1.012 3.2*109 1.9*108 79.469 1.012 3.7*109 2.0*108 78.489 1.048 Post exercise Body Mass, g 8.3*103 372.5 1.424 0.012 8.4*103 371.3 1.435 0.012 8.0*103 385.4 1.421 0.013 % Fat 0.948 0.043 3.272 0.118 1.010 0.043 3.185 0.118 0.900 0.044 3.232 0.122 % Lean 4.4*109 2.2*108 81.935 0.816 4.1*109 2.2*108 82.523 0.817 4.7*109 2.3*108 82.093 0.845 % change in mass -4.576 1.193 -2.594 1.300 -2.877 1.151 -2.340 1.301 -6.441 1.193 -2.811 1.346 % change in % fat -33.236 5.269 -32.140 5.137 -26.939 5.086 -27.199 5.139 -33.688 5.272 -37.515 5.320 % change in % lean 0.507 0.908 1.566 0.901 1.495 0.876 1.458 0.902 -1.656 0.908 1.624 0.933
a
At ~8 weeks of age body composition measures were taken immediately prior to (in) and following (out) 6 days of wheel access. Percent body fat (and lean) was calculated as (fat mass/body mass)*100. Percent change variables were calculated as [(out - in)/in]*100.