THE CAUSES & CONSEQUENCES OF HFT:
IMPLICATIONS FOR THE FUTURE
Bo Yin
An honors thesis submitted to the faculty of the Kenan-Flagler Business School at the
University of North Carolina at Chapel Hill
Chapel Hill 2015
ii
ABSTRACT
Bo Yin
The Causes & Consequences of HFT: Implications for the Future (Under the direction of Jennifer Conrad)
There has been much debate on High Frequency Trading (HFT) in recent years from both business and academic fields. However, very little of this debate has separated the technology from the uses to which the technology has been put. Imagine the difference between the use of gunpowder to make fireworks and its use in
producing weapons. This thesis examines changes in trading technologies and its uses through time. I consider existing empirical evidence and conduct additional
quantitative analysis. I examine what regulatory authorities have done and what, if any, further regulations need to be in place in order to eliminate any unfair and
discriminatory advantages that high-frequency traders may have, while preserving the benefits this technology has brought to the U.S. stock market.
iii TABLE OF CONTENTS ABSTRACT ... II LIST OF FIGURES ... IV Chapter I. INTRODUCTION ... 1
A. How Important Is High-Frequency Trading? ... 1
B. What Are the Objectives and Why? ... 3
II. LITERATURE REVIEW ... 4
A. Introduction ... 4
B. Evolvement of high frequency trading ... 5
C. different methodologies of evaluating HFT’s market impacts ... 8
D. Distinct perspectives on HFT’s market impacts ... 10
E. HFT strategies ... 12 F. Conclusion ... 14 III. METHODOLOGY ... 14 A. Key Measurements... 15 B. Quantitative Approach ... 16 C. Qualitative Approach ... 17
IV. ANALYSIS OF RESULTS ... 20
A. Descriptive Data Analysis... 20
iv
V. CONCLUSION ... 31 VI. APPENDIX ... 34 A. Average Daily Trade Size and Trading Volume Comparison ... 34 B. Change in Dollar Realized Spread of the 10 Random Selected Stocks .... 35 C. Average Daily Bid-Ask Spread in 2007, 2010, and 2012... 36 VII. REFERENCES ... 37
v
LIST OF FIGURES
FIGURE 1 AVERAGE DAILY TRADING DOLLAR AMOUNT ... 21
FIGURE 2 AVERAGE DAILY TRADING VOLUME ... 22
FIGURE 3 AVERAGE DAILY BID-ASK SPREAD IN 2007 ... 25
FIGURE 4 AVERAGE DAILY BID-ASK SPREAD IN 2010 ... 25
FIGURE 5 AVERAGE DAILY BID-ASK SPREAD IN 2012 ... 26
FIGURE 6 AVERAGE DAILY PRICE IMPACT SINCE 2007 ... 28
1
Introduction
When the Dow Jones Industrial Average plunged almost 1,000 points in a few minutes before bouncing back in 2010, the term “algorithmic trading”, or, perhaps, high-frequency trading (HFT) started to receive a great deal of attention. Since then, a considerable amount of research has been conducted in this area. While most of the research focused on the impacts that the growth of HFT had made to the current market conditions, relatively little research has addressed the future or further development of this new means of trading. In this paper, I consider how HFT may change, and how those changes in HFT may affect financial markets, and the evolution of markets. I will also address why this is an important topic, what my objectives are throughout the research project, as well as why I wanted to pursue these objectives.
How Important Is High-Frequency Trading?
Since the emergence of High-Frequency Trading, this type of trading has been at least anecdotally associated with various problems. Thousands of human traders have been replaced by computers and fiber-optic cables1. The industry has undergone a dramatic restructuring, in which trading floors are disappearing and machines are competing in milliseconds to make a profit. In analyzing these significant changes during the past few years, some academics have reached the conclusion that HFT has had largely positive impacts on the financial market. For instance, Charles Jones, a professor at Columbia Business School, stated in his paper, "In specific terms, HFT
has sharply increased competition in market-making, and bid-ask spreads are much
1
2
narrower as a result. Stock prices are more efficient as a result of HFT activity. Overall, there is no evidence of any adverse effect due to HFT in the average results."
(Jones, C. M., 2013)
On the contrary, however, other researchers like Daniel Beunza argue that the loss of floor trading has had negative impacts. Mr. Beunza, "who has spent the last
13 years scrutinizing the arcane language, rites of passage and rituals of an insular tribe, the floor traders, who are imperiled by advances of the modern world,” (Hope,
B., 2014) attributes events such as the Flash Crash, on May 6, 2010, to the use of automated High-Frequency Trading, and argues that the quick recovery on that day is due to floor traders who successfully slowed down trading activities and restored rationality to prices immediately after the market crash.
High-frequency trading is certainly of economic significance. HFT firms, which represent approximately 2% of the 20,000 trading firms operating in the US markets today, accounted for 60-73% of all US equity trading volume in 2009. Their importance declined somewhat after the Flash Crash (Lati, R., 2009), falling to approximately 50% of market trading volume in 2012. Since 2010, a number of questions have been raised regarding the consequences of high-frequency trading technologies. What factors led to the rise of high-frequency trading, and why is HFT taking such a large proportion of trading in the US equity market? Does HFT
destabilize the market? How should regulations change in an environment in which frequency trading represents the majority of trading volume? Some
high-frequency trading firms have reached trading speeds that approach the speed of light; does this mean that this technology has reached the limits of the effects that it will
3
have on the market? As I am writing this paper, the SEC is still mulling new rules on HFT. So many questions with too few answers have made HFT even more valuable of a topic to examine.
What Are The Objectives of High-Frequency Trading?
I hope to acquire a better understanding of high-frequency trading and its effects, to gain exposure to scholarly research, and use it as a tool to pursue new knowledge. My interest in the financial market stemmed from the emerging markets program in India, where we visited a variety of companies during my freshman year, which made me realize the great potential that emerging markets have and how fast they are growing. After that, I read a book called The Market Wizards, and found it really fascinating, which helped me calibrate my interests specifically in the sales and trading industry. Since then, I have sharpened my business skills by taking finance classes, followed by internships to apply what I learned from school to the real world. I began to follow the market on a daily basis and reach out to people already in the industry. During these conversations, I was inspired by their experience of making quick, accurate and analytical decisions, while mitigating unwanted risks.
More importantly, during my final round interview with a bulge bracket investment bank, one of the interviewers was from their Algorithmic Trading Team, which supervised the High-Frequency Trading team. That specific conversation really inspired me and completely changed my perspective on the financial market. Before that, my impression of the stock market was that shares were traded, and prices were set, through the actions of floor traders, rather than being largely determined through the interactions of algorithms. I became interested in understanding whether the trend
4
toward algorithmic trading will continue and whether there was a place, or would be a place, for human traders. Along the road, my goal has been developing as I learned more about HFT and I believe my conversations with our professors at KFBS has further broadened and enriched my research as well as my general understanding of HFT and the financial market.
Before I dive into this research, I would like to share something I heard this semester that has been quite inspiring to me, "Apple understood the value of stores. Airlines understand that pilots are not just there for marketing. In both cases, it is not just people or technology, but the right blend of them."
Literature Review
Introduction
Much research has been done on high frequency trading (HFT), especially since 2009 after Goldman Sachs, among other big players who adopted HFT technology on Wall Street, had record quarters with tremendous profits even when the economy was still facing collapse and merger and acquisition volume was low. While most of these analyses explored HFT’s more recent impact on financial markets, my research will be focusing on a broader time horizon – starting from HFT’s predecessor, algorithmic trading, and how it has evolved to where it is today. Moreover, in my research, I will attempt to distinguish HFT traders’ role and HFT as a technology and explore the traders’ influence on HFT’s reputation. Specifically, I will cover the following aspects of HFT:
5
- Different methodologies of evaluating HFT’s market impacts - Distinct perspectives on HFT’s market impacts
- HFT Strategies (market making, directional and arbitrage)
This research aims to analyze what impacts HFT has had on the market as a technology development, and how different trading strategies influenced its final outcomes, and ultimately to answer the question: what kind of foreseeable regulatory changes will be able to eliminate any negative influences of HFT?
Evolution of high frequency trading (HFT)
In this section, I will explain what HFT is and discuss the history of HFT, as well as how it has evolved to be what it is today.
HFT is a relatively new term and, surprisingly, it is not yet clearly defined. It typically is used to refer to professional traders acting in a proprietary capacity that engage in strategies that generate a large number of trades on a daily basis (US Securities and Exchange Commission, 2010). While there is no formal definition of HFT, SEC has attributed certain distinctive characteristics found in HFT (US Securities and Exchange Commission, 2014), including:
1. Use of extraordinarily high speed and sophisticated programs for generating, routing, and executing orders.
2. Use of co-location services and individual data feeds offered by exchanges and others to minimize network and other latencies.
3. Very short time-frames for establishing and liquidating positions.
6
5. Ending the trading day in as close to a flat position as possible (that is, not carrying significant, unhedged positions overnight)
To explore the history of HFT, we have to look at its predecessor, Algorithmic Trading (AT). HFT is often labeled as a subset of the notion of AT, and AT in turn is a way of acting in a market by means of computer-aided algorithms (Ashlstedt & Villyssono, 2012).
The history of AT can be traced back to as early as the 1970s, when the National Association of Securities Dealers Automated Quotations (NASDAQ) became the world’s first electronic stock market and introduced an electronic
quotation system for competing market markers to trade securities. In 1976, the New York Stock Exchange was swamped by so many orders that they could not complete the paper work associated with those orders. This situation eventually led them to introduce the “designated order turnaround” (DOT) system, which routed orders electronically to the proper trading post, and then executed them manually. In 1980s and 1990s, fully electronic execution and electronic communication networks (ECN) were developed. It successfully narrowed the bid-ask spreads of individual securities, decreased the market makers’ trading advantages, and therefore increased market liquidity. Later on, entering the 2000s, HFT was born.
Four developments in the financial industry have greatly facilitated the rise of AT and, more specifically, HFT over the last two decades. The first is the fact that the financial system is becoming more complex over time, and therefore many arbitrage opportunities loomed across different trading venues. The second is the set of
7
breakthroughs in the quantitative modeling of financial markets: the contribution of financial economic giants – Black, Fama, Merton, Markowitz, Scholes, Sharpe, and others. The third development is an almost parallel set of breakthroughs in computer technology, including hardware and software (Kirilenko and Lo, 2013). Last but not least, regulatory changes played a crucial role in the blooming of HFT technologies. In 2005, the SEC passed the Regulation National Market System, which updated the Trade-through Rule, promoting transparency and competition between markets and requiring trade orders to be posted nationally and not at individual exchanges. These changes, along with improving high-speed technology, have acted as a catalyst, giving rise to a new approach to trading: high frequency trading (Agarwal, 2012).
In order to distinguish HFT from AT, Jonathan Ashlstedt and Johan Villysson (2012) looked at some of their distinctive characteristics and realized that HFT-strategy often involves a large number of orders--orders that are placed can be rapidly canceled, positions are held for a short period of time and these traders require very low latency in the markets, where latency refers to the delay between the transmission of information from a source and the reception of the information at a destination). The time aspect of HFT is very important and on today’s market trading time is measured in microseconds. Studies in 2005 reported that on average a stock is held for 22 seconds in the US (US Securities and Exchange Commission, 2005), and this number is likely smaller as of today.
8
Different methodologies of evaluating HFT’s market impacts
To examine the market impacts HFT has had since its introduction, different researchers used different metrics. Here is a list of the common ones that have been adopted in most of the studies on HFT:
- Different types of spreads [examples include realized spread, effective spread, etc.]
- Various dimensions of price discovery [examples include variance ratios, price impact, etc.]
- Short-term volatility - Liquidity
As we can see, these metrics are relatively broad concepts and to evaluate them, we must use more detailed standards. Charles Jones (2013), a professor at Columbia Business School, explained that, “because liquidity is complex and multi-dimensional, there is no single best measure of it.” In most cases, these liquidity measures are highly correlated with each other, but inferences and conclusions can sometimes depend on the liquidity measure that is examined.
Bid-ask spread is the easiest metric to calculate and observe; conceptually, it is the price that investors pay market makers for a round-trip transaction in a security. It is normally measured as a fraction of the total amount traded, but sometimes it can also be calculated in cents per share. Here are some examples of the simple spread calculation:
9
(1) Percent spread = 𝑜𝑓𝑓𝑒𝑟−𝑏𝑖𝑑𝑜𝑓𝑓𝑒𝑟 ∗ 100%
(2) Effective spread = 2 * |Execution price – mid-quote|
(3) Realized spreadit = 2*Dit*(Pit-Pit+n)
where Dit is a binary variable which equals one for customer buy orders and negative
one for customer sell orders. Pit is the execution price for security I at time t, Pit+n
denotes the first transaction price observed at least n minutes after the trade for which the realized spread is measured.
Ultimately, transactions may not take place at the quoted bid or ask price. There could be a hidden order at a better price, or a market maker may offer a better price to some incoming orders (known as price improvement). In both of these cases, the effective bid ask spread may be narrower than the quoted spread. If the incoming order is large and exceeds the amount that is bid or offered at the quoted price, the effective spread is actually wider than the quoted spread.
Price discovery can be measured by looking at the response of share prices to a particular trade. However, the preferred trading cost measure for an institution is known as the implementation shortfall. It is calculated as the average execution price for the order compared to the price of the stock prior to the start of execution.
(4) Implementation Shortfall = Execution Costs + Opportunity Costs
As for trading costs, while many liquidity measures could be used to calculate the trading costs, there are some liquidity measures that focus on deviations from the
10
so-called efficient price. These measures of price efficiency typically measure the average size of these deviations using an econometric model that takes into account a great deal of recent order flow information.
Aside from the more straightforward metrics mentioned by Jones, other more advanced and complex metrics are also used in recent researches on HFT. For instance, variance ratio has been used to measure price efficiency and execution quality (Conrad, Wahal & Xiang, 2014).
Distinct perspectives on HFT’s market impacts
As mentioned earlier, different metrics or datasets used by various researchers could lead to different inferences and conclusions. Even with the same metrics and datasets, different interpretation or just perspectives from the researchers could also lead to dramatically different results. Interestingly, the academic literature primarily shows positive effects of HFT based strategies on market quality. On the contrary, some non-academic researches reach the conclusion that HFT might increase an adverse selection problem and in the case of the flash crash, argue that HFT
exacerbated volatility. After my preliminary research, I attributed this phenomenon to the fact that the academic researchers typically deal with large datasets, with the goal of providing results that have general application; as a consequence, they typically do not focus on specific predatory HFT strategies and “dirty tricks” which might use this technology. But the truth may be that, as with many other new technologies, there are both costs and benefits, and the conclusion that one draws from these studies depends on the weight that one puts on each side of the trade-off.
11
In Jones’ (2013) research, he concludes that, based on the vast majority of the empirical work to date, HFT and automated competing trading venues have
substantially improved market liquidity and reduced trading costs for all investors. Share prices are higher as a result of the reduction in trading costs, benefiting long-term investors. Higher share prices in turn will lower the cost of capital for companies, and then with a lower cost of capital, firms are likely to invest more, which lead to increases in GDP and other measures of economic activities. In specific terms, HFT has sharply increased competition in market making, and bid-ask spreads are much narrower as a result. Stock prices are more efficient as a result of HFT activity. Overall, there is no evidence of any adverse effect due to HFT in the average results. However, Jones (Jones, 2013) did raise one concern, which is the instability that HFT may inject in the market during high volatility periods. During the flash crash of May 6, 2010, even though the incident was not directly caused by HFT, this type of trading did play an important role in exacerbating the consequences of a mutual fund’s
submission of a rapid sequence of large sell orders during a volatile trading session. Initially, HFT and other intermediaries helped stabilize prices by buying, but HFT were soon overwhelmed and rapidly liquidated their positions by selling stocks and futures, thereby exacerbating the decline.
Some argue that the damages of high-frequency trading are greater than the benefits brought by HFT. In Kirilenko’s (2010) research, he reached the conclusion that “High Frequency Traders may compete for liquidity and amplify price volatility.” Other than volatility, Kirilenko also concluded that the provision of liquidity by the high frequency traders is not of the same quality as the traditional market makers, as
12
they account for most of the cancellations in the market. Boehmer, Fong & Wu (2014) studied trading data from around the world and discovered that “algorithmic traders can have impact beyond the immediate trading environment and potentially affect the more fundamental functions of capital markets, such as the allocation of capital to firms.”
In my preliminary research, I find that the researchers who reached negative conclusions like these normally took into consideration the predatory trading strategies adopted by the HFT traders, using their speed advantage to exploit profits by eliminating traditional market makers. I will take a closer look at this in my formal research and attempt to determine whether it is true.
HFT Strategies (marking making, directional, and arbitrage)
The strategies involved in HFT are often fairly simple though the exact implementations of the strategies are company secrets (Ashlstedt & Villysson, 2012). The market for HFT is constantly changing and so are the algorithms. There are a number of arbitrage strategies; there are also directional strategies as well as ones for market making. Some of them are legal, while others are illegal.
Some legal strategies include statistical arbitrage, filter trading, and rebate trading. Statistical arbitrage is an example of arbitrage using HFT where the strategy finds imbalances in prices on an asset listed on different markets and profits on the differences. It could also involve correlated assets such as derivative contracts and their underlying assets. However, as HFT has been much more widely adopted, the profit potential for this arbitrage strategy has become very limited. Filter trading
13
refers to the strategy where algorithms search for new announcements or rumors that could have an impact on a particular asset and quickly assess the news and make trades before the public will be aware of the opportunity. An example of market making strategy is rebate trading, where HFT traders take advantage of rebates given to traders that add liquidity to the market. This is an old strategy that has been used for years, but HFTs implemented it very successfully and made it more profitable.
Very often, especially at the very beginning of HFT’s history when there was no regulation on it whatsoever, many toxic or predatory trading strategies were used. Often times these HFT-algorithms are the ones that get the most spotlight in the media, which could be one of the reasons why HFT has come to be such a heated topic, with a great deal of controversy. Most of these strategies are considered to be market manipulation. For example, in September 2010, the company Trillium was fined $1 million by FINRA for quote: “…using an illicit high frequency trading strategy and related supervisory failures”. One strategy they adopted was called
Layering. This technique is based on using the speed of HFT to post bids and then
immediately cancel them, by which they could intentionally lower or raise the price on certain assets and then trade profitably from that price movement. Another illegal strategy is called Quote Stuffing. It relies on the fact that HFT-algorithms can post a lot of offers and cancel them immediately. The difference between quote stuffing and layering is that the former slow down the market to other traders and achieve an advantage over them.
14 Conclusions
As controversial as it can get, HFT appears to be associated with both benefits and costs—with both positive and negative effects on the market. In my research, I attempt to find out whether these damages come with the technology development or the strategies HFT traders use. In addition to that, just like many other new
technologies, it will take additional work by regulatory authorities to study HFT and implement regulations step by step. My goal is to stay ahead of the curve and locate the most important issues related to HFT that need to be regulated to limit the damage of this new technology while preserving its benefits.
Methodology
In this section, I will present the complete methodology that I adopted throughout my research to obtain the final results. In order to achieve the best outcome possible, I broke my research into two main components - quantitative and qualitative approaches. Within the quantitative section, I focused on the case studies comprised of the most representative transactions over different sample periods related to the emergence of HFT. Specifically, I selected the following events to separate my datasets for comparison. I will discuss the reasons why I believe they are highly representative events, as well as the significance of each one of them in the qualitative analysis section:
15 1. August 20, 2007 – Regulation NMS 2. May 6, 2010 – Flash Crash
3. September, 2010 – Single Stock Circuit Breaker 4. May 31, 2012 – Limit Up-Limit Down
As for the qualitative section, I incorporated my results from the quantitative analyses and discussed what changes each major events/regulations has posed on HFT and the marketplace.
Before I jump into the two main approaches, I will first introduce the key metrics I used to evaluate HFT's impacts on market liquidity and efficiency, as well as transaction costs, and then I will discuss the data sources I chose for the
quantitative analysis.
Key Measurements
Average Daily Trading Volume (ADTV) is the average amount of
individual securities traded in a day or over a specified amount of time. In this study, it is calculated by taking the average amount (in shares) of each individual stock traded in a day, among the 10 stocks I randomly selected. Average Daily Trading Volume is a measure of the liquidity of a stock. When ADTV is high, the stock can be easily traded and therefore has a high liquidity. It could also have certain degree of impact on the stock’s price – lower the volume, less expensive the stock due to the basic supply demand relationship.
Bid-Ask Spread is one of the most common measures of transaction costs as
16
order processing costs and taxes associated with the trades, as well as the implicit transaction costs. In this study, I used the dollar bid-ask spread to examine the change in transaction costs and liquidity over time. It is calculated by subtracting the bid price from the offer price.
Price Impact is a measure of how much a transaction will change the
prevailing prices in the market in which the trade gets executed. It is an important measure especially to people who buy or sell in large quantities, as their actions contribute more to aggregate supply and demand than do those of the average/retail participants.
Many economic models are built on the assumptions that buyers and sellers are price takers, which means they do not have price impacts, and instead only see prices and make moves based on their own valuation of the assets. In reality, markets have a limited numbers of participants, and each of them may affect overall market conditions. For instance, a large order for a product stimulates demand, driving up the price. In this research, this measure helps me examine whether the changes in
numbers of HFT transactions have had any impact on market participants’ impacts on the asset prices.
Quantitative Approach
In order to examine the impacts that HFT has had on the financial market over the sample period, I divided the time period into three intervals including growth, uncertainty, and maturity. To gather data from transactions in each of these periods, I used several databases containing high frequency transactions, including WRDS
17
(Wharton Research Data Services), official stock exchange websites, and SEC websites. I utilized all three channels concurrently in order to find as much information as possible.
With the data gathered from the first stage, I was able to present cases (transactions) from different time periods and then analyzed these cases using the different metrics I presented earlier. Specifically, I examined both the market and individual securities' liquidity by looking at the Amihud Ratio in the three days immediately before and after each order execution, and further evaluated the liquidity and transaction costs by analyzing the bid-ask spread during the past twenty years, cost of transaction, as well as conducting a comprehensive analysis on some certain trends that faster speed has brought us.
Qualitative Approach
Following the quantitative analysis, I also incorporate the results into a qualitative discussion seeking to find out what regulatory changes are needed to preserve HFT’s benefits. As mentioned earlier, I selected RegNMS, Flash Crash, Single Stock Circuit Breaker, and Limit Up-Limit Down to separate my datasets and make the comparison. I would like to introduce each of those events and briefly discuss their significance:
Regulation National Market System (or Reg NMS) is a set of rules passed by the Securities and Exchange Commission (SEC), designed to “modernize and strengthen the National Market System for equity securities.” In other words, it is intended to improve the U.S. exchanges through improved fairness in price
18
executions as well as improve the displaying of quotes and amount and access to market data. Some notable rules include:
Order Protection (or Trade Through) Rule – aims to ensure that both institutional and retail investors get the best possible price for a given trade by comparing quotes on multiple exchanges. If a better price is quoted elsewhere, the trade must be routed there for execution, and not “traded through” at its current exchange. (Rule 611)
Access Rule – addresses access to market data such as quotations, and requires greater linking and lower access fees. (Rule 610)
Sub-Penny Rule – establishes minimum pricing increments of all stocks from over $1.00 per share to at least $0.01.
This set of initiatives marked great significance to the financial market, and their timing coincided near simultaneously with the rise of HFT. Therefore, Reg NMS becomes the first regulatory change I am going to look at in this study.
2010 Flash Crash
On May 6, 2010, a quick drop in securities prices (about 9% in Dow Jones Industrial Average, the 2nd largest point swing in its history) followed by a recovery in twenty minutes happened in the U.S. stock market, which is known as the 2010 Flash Crash. Even though the real cause of this crash remains unknown, regulators determined that high frequency traders sold aggressively to eliminate their positions and withdrew from the markets in the face of uncertainty, which exacerbated the price
19
declines. Therefore I looked at data around this date and seek to find any abnormal changes in the stock market during this time period.
Single Stock Circuit Breaker
Followed by the 2010 Flash Crash, on September 10 in the same year, the U.S. Securities and Exchange Commission approved rules known as Single Stock Circuit Breakers triggered by large, sudden price moves in an individual stock. Specifically, it imposes a uniform market-wide pause in individual stocks whose price moves 10% or more in a five-minute period. Its origin closely connects to the Flash Crash, since on May 6, 2010 when the crash occurred, many stocks fell very sharply and quickly in the afternoon while the downturn was still not broad enough to trigger existing market-wide circuit breakers. The regulatory authorities are concerned that events such as these can seriously undermine the integrity of U.S. markets so including data analysis around this period is likely to be very helpful to my study.
Limit Up-Limit Down (LU/LD) is a more robust, or upgraded version of Single Stock Circuit Breakers approved by SEC on May 31, 2012. This mechanism aims to address market volatility by preventing trades in listed equity securities when triggered by large, sudden price moves in an individual stock. Specifically, it is intended to prevent trades in individual securities from occurring outside of a specified price band, which would be set at a percentage level above and below the average price of the stock over the immediately preceding five-minute trading period. Every security will have a price band with the reference price as the spread mid-point, and if an offer reaches the lower quote band or a bid reaches the upper quote band,
20
the stock will enter a limit state for 15 seconds, to allow for trading counterparties to enter the market. Therefore, looking at whether trading data around this data has gone through major changes would also be helpful to my study.
Even with the help from instructors and advisors, the first part of the research was mostly individual work and from this part on, I was looking to add some
professional opinions so that the results from my research will be more convincing and accurate. I have been reaching out to industry experts at Themis Trading LLC, and KCG Holdings Inc. to request phone interviews and floor shadowing. I also contacted several researchers in this area like Charles Jones at Columbia University in order to hear some opinions from the academic field.
Through collecting data, analyses through different time periods, and
gathering information from professionals and experts, I was able to get a general idea of how HFT has been evolving during the past twenty years, and where it is headed going forward.
Analysis of Results
Descriptive Data Analysis
To examine what impacts HFT has had in the stock market, I randomly
selected 10 stocks from S&P 500. All of these securities are listed on the NYSE, and the sample includes:
1. AGN: Allergan
21 3. CNP: CenterPoint Energy 4. GIS: General Mills
5. LMT: Lockheed Martin Corp. 6. MO: Altria
7. MCD: McDonald’s 8. WMT: Wal-Mart
9. IBM: International Business Machines 10. DUK: Duke Energy
Average Daily Trading Volume and Dollar Amount
One of the simplest and yet direct measures to examine how HFT’s role in the marketplace has been evolving is to examine trading volume and dollar amount. I take the average of daily trading volume and dollar amount across these 10 stocks from the time period surrounding the 3 regulatory changes and the flash crash and the results are as follows:
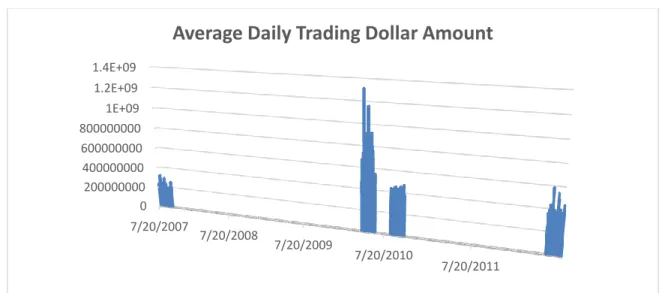
Figure 1. Average trading dollar amount on randomly selected 10 stocks
0 200000000 400000000 600000000 800000000 1E+09 1.2E+09 1.4E+09 7/20/2007 7/20/2008 7/20/2009 7/20/2010 7/20/2011
Average Daily Trading Dollar Amount
22
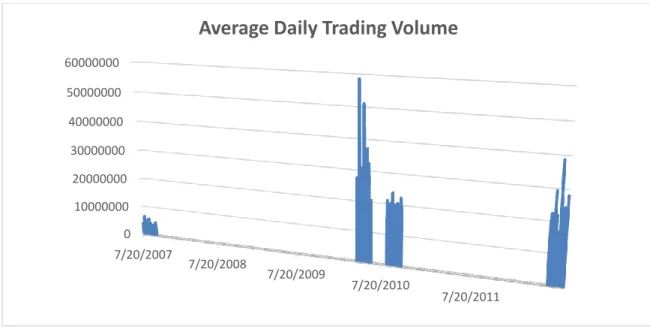
Figure 2. Average trading volume on randomly selected 10 stocks
As we see from the chart, trading volume for these 10 stocks from 2007 to 2010 has been increasing quite dramatically until the flash crash, corresponding with the rapid growth of high-frequency trading volumes. After the flash crash, in 2010, the volume decreased and stabilized at a lower level. With the implementation of Single Stock Circuit Breaker, Limit Up-Limit Down and other new regulations carried out by SEC, the trading volume pattern, to some extent, has been flattened since then.
With the increase in volume and trade size, along with the rise of HFT from 2007 to 2010, it is evident that the market has become deeper, meaning that more securities that people are willing to trade are available in the stock market.
However, tracing back to the main reasons of the sudden boom of HFT in 2007, as mentioned earlier, the adoption of Reg NMS includes a very important set of rules known as the Access Rule, or Rule 610: “The Access Rule sets forth new
0 10000000 20000000 30000000 40000000 50000000 60000000 7/20/2007 7/20/2008 7/20/2009 7/20/2010 7/20/2011
Average Daily Trading Volume
23
standards governing access to quotations in NMS stocks.” The Access Rule banned locked markets (A market in which a stock’s bid and ask prices are identical), from which High Frequency Traders and stock exchanges were able to leverage for mutual benefits. To be more specific, the implementation of Reg NMS constrained price movements in the U.S. stock market in a certain way, and at the same time, created a market condition for HFT to gain a competitive advantage against other traditional trading strategies.
By 2010, HFT accounted for more than 60 percent of all U.S. equity volume, and seemed to be positioned to take over the rest. However, from the graph above, it is not hard to see that it didn’t turn out that way. After May 6, 2010, or the Flash Crash, trading volume dropped dramatically. The reasons behind it are still under debate, and two opposite opinions include: 1. The HFT boom and the flash crash have scared away many investors in the U.S. market. 2. Because of the foreseeable risks and regulations, the HFT firms are under so much pressure and limitations, and forced to draw back their presence. One potential positive impact from the two figures above is that, since the trade size does not fluctuate as much as the trading volume in 2012 as before, it is very likely that the market has achieved a better price consistency.
24 Bid-ask Spread
Bid-ask Spread is the difference in price between the highest price that a buyer is willing to pay for an asset and the lowest price for which a seller is willing to sell it. It is among the most effective and yet easiest liquidity measures. Both in theory and practice, the more competitive the market is, the smaller the bid-ask spread that prevails. Imagine in a simplified stock market where there are only two market makers, and each of them bought 10 shares at $10. Market maker A is willing to sell at $10.10, and B sees it, and is willing to sell at $10.09 because she thinks to attract buyers could outweigh the $0.01 profits. Then A realizes this, and decides to sell at $10.08, and it goes on and on. “The minimum price increment was $0.125 per
share before 1997, which meant that the minimum bid-ask spread was also $0.125. The minimum tick is now $0.01. In the mid 1970’s, Congress enacted the National Market System, which was designed to encourage competition between various
trading venues.”2 Professor Jones concisely explained how the market became so
competitive today, and Reg NMS as I mentioned earlier took this to the next level. Imagine adding thousands of market makers, with each of them happy to compete with one another. HFT strategies do not necessarily add thousands of more market makers, but the speed they added essentially works in the same way as more market makers do.
2
25
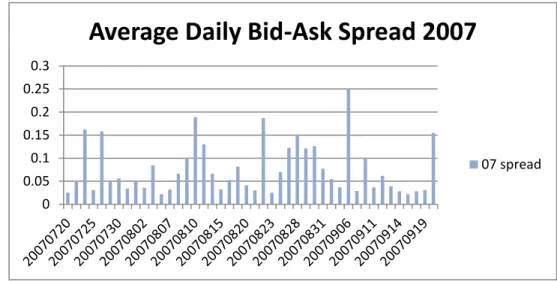
Figure 3. Average Daily Bid-Ask Spread in 2007
Figure 4. Average Daily Bid-Ask Spread in 2010 0 0.005 0.01 0.015 0.02 0.025 0.03 0.035 20 1004 06 20 1004 13 20 1004 20 20 1004 27 20 1005 04 20 1005 11 20 1005 18 20 1005 25 20 1006 02 20 1008 12 20 1008 19 20 1008 26 20 1009 02 20 1009 10 20 10 09 17 20 1009 24 20 1010 01 20 1010 08
Average Daily Bid-Ask Spread 2010
10 spread 0 0.05 0.1 0.15 0.2 0.25 0.3
Average Daily Bid-Ask Spread 2007
26
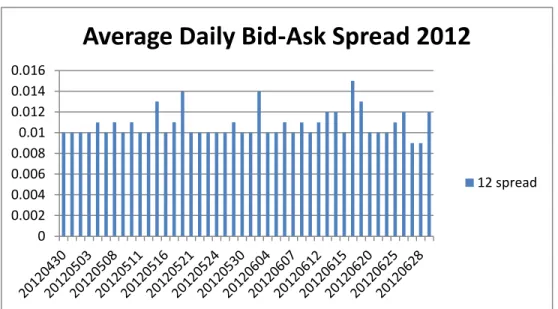
Figure 5. Average Daily Bid-Ask Spread in 2007
From the change in bid-ask spread among these 10 stocks I randomly selected from S&P 500, after the rise of HFT in 2007, daily bid-ask spread has dramatically decreased, and in the meantime, it is also obvious that the volatility among the spreads has also been lowered. Due to the small sample size, we should be cautious about over-interpreting the result. However, since we can observe fairly dramatic and consistent differences through timeeven in such a small sample, it is very likely that HFT has facilitated liquidity in the market and made it more efficient and competitive. While the bid-ask spread alone measures meaningful liquidity for small/retail
investors, large/institutional investors might need to look at the price impact since large purchases/sell-offs tend to have impact on the share price. Going back to what we see from figure 1 and 2, the more stabilized trade size might indicate a more consistent price level, but let’s take a closer look at the price impact.
0 0.002 0.004 0.006 0.008 0.01 0.012 0.014 0.016
Average Daily Bid-Ask Spread 2012
27 Price Impact
In this study, I used the computation method by Bidisha Chakrabarty, Bingguang Li, Vanthuan Nguyen, and Robert Van Ness in their paper “Trade Classification Algorithms for Electronic Communications Network Trades.” Specifically, the price impact (PI) is calculated as:
(5) Effective spread = 2*I*(Transaction Price-Midpoint)
(6) %Effective spread = Transaction PriceEffective spread
(7) PIi = I*(Mi,t+10-Mi,t)
where PIi is price impact for trade I at time t, I is trade indicator which equals
1 (-1) for buy (sell) orders, Mi,t is quote midpoint at the time of trade, and Mi,t+10 is
the quote midpoint 10 minutes after the trade.
Even with a small sample size of 10 stocks, we can still see the pattern that the price impact has been decreasing and stabilizing at lower levels since 2007, which supports the interpretation that the stabilized trade size marked a better price consistency in the stock market. After the rise of HFT in 2007 and nation-wide implementation of Reg-NMS, investors did not need to think about which exchange to execute a trade in terms of the price as the prices will be the same no matter where the stock trades. It is mainly due to the fact that HFT has ensured that no arbitrage opportunities are available across different exchanges, otherwise they would buy low, sell high, and make profits within every single millisecond.
28
Figure 6. Average Daily Price Impact on randomly selected 10 stocks
Volatility
Stock Volatility is a statistical measure of the dispersion of returns for a given security or market index. In this study, I measure volatility by calculating the 30-day standard deviation of return for each stock I selected. The results are below:
Price Impact 0 0.01 0.02 0.03
Price Impact
Price Impact29
Figure 7. Average Daily Price Impact on randomly selected 10 stocks
As we see from the chart above, there is no clear pattern of either an increase or decrease of volatility from the year 2007 to 2012, even though it is widely argued that HFT has added much volatility to the stock market. It could be because my sample size is not sufficiently large to see a pattern here, but the arguments that the increase in the activities of high frequency traders is associated with an increase in the volatility of the market environment is not supported in these data.
Flash Crash Analysis
Looking back on what happened on May 6, 2010, the stock markets plunged suddenly and recovered almost immediately after. More specifically, around 1pm, volatility in some markets increased in a down market. After about an hour and half, volatility was up sharply while the Dow was down 2.5 percent. In the meantime, a program to sell $4.1 billion in E-mini futures started, and was followed by a big sell-off among the automated trading platforms. At 2:46pm, trading in the futures market
0 0.005 0.01 0.015 0.02
Average Monthly Volatility
30
paused for five seconds, which alleviated the selling pressure and the market began to recover.
The causes behind this incident are still to be determined. , Early speculations and theories included the fat-finger theory, which describes a trade where a human input error leads to a very significant wrong trade that was not supposed to happen. On May 6, a sell order for Procter & Gamble stock was placed in “billions” instead of “millions” by mistake, which triggered massive HFT orders to dump the stock. However, the theory was soon proved false after it was determined the decline in stock was after the E-mini futures.
As widely discussed after the incident, HFT was under much scrutiny including Michael Lewis best-selling book Flash Boys. The main arguments for HFT’s impact during the incident include:
1. Some high frequency traders sold aggressively to eliminate their positions and withdrew from the markets when the incident happened, and therefore exacerbated price declines.
2. The large sell-off by high frequency traders also caused sudden liquidity drain, which in turn harmed market sentiment and further led to the precipitous fall in prices
3. The use of sweep orders by high frequency traders could lead to trades being executed at very strange prices when there is a liquidity failure, and in the flash crash there were many strange quotes for NYSE-listed stocks trading on NASDAQ.
31
The bottom line is that the regulator investigating the crash concluded: “that quote-stuffing – placing and then almost immediately cancelling large numbers of rapid-fire orders to buy or sell stocks – was not a ‘major factor’ in the turmoil”. Overall, no concrete evidence has shown HFT has caused real harm to the market during the Flash Crash. However, arguments about the negative consequences of HFT, including the possibility of liquidity drain, sweep orders, and market spamming and cancelling, persist.
Conclusion
To summarize, from the 10 stocks I randomly selected from S&P 500, we observe evidence that HFT has improved market liquidity, lowered price impact, and deepened the market in the sense that more securities are available at prices with narrower bid-ask spreads. These results suggest that HFT has had a positive impact in the market. However, the 2010 Flash Crash, and the series of new regulations carried out since 2010 also illustrate certain risks of HFT activities. One distinction between these benefits and potential unfair market advantages appears to be how traders are leveraging this technology. A disciplined high frequency trader, and a well-regulated HFT environment would greatly benefit the market, while a less well-regulated market environment could lead to less-disciplined high frequency traders using passive HFT trading strategies like rebate arbitrage, latency arbitrage, order anticipation, and high frequency statistical arbitrage as predatory strategies to
leverage the unfair market advantage to make profits. That is, high frequency trading environments are associated both with benefits, and with increased risks.
32
Perhaps we can never rely on the expectation that no less-disciplined high frequency trader will exist again; as a consequence, we should focus attention on having a well-regulated market environment to curtail possible abuses From what we see in some of the market behavior around the implementation of Reg NMS, Single Stock Circuit Breaker, Limit Up-Limit Down to eliminate unfair and discriminatory HFT consequences, I have the following proposals:
1. Strengthen the Market Access Rule of Reg NMS. As I discussed earlier in this study, the Rule 610 of Reg NMS largely fixed the fragmented
marketplace in that it brings different exchanges to a truly unified national market. Nevertheless, at the same time, it also, to some extent,
compromised the market mechanism of how price moves as locked markets are banned. To better regulate HFT and improve market quality, the regulatory authority should probably strengthen the Market Access Rule and try to recover the market mechanism of how price moves. 2. Limit market spamming and cancelation by high frequency traders. As
shown in the flash crash, HFT strategies that rapidly cancel orders that have no economic benefits can be burdensome, and create risks to market liquidity. Such behavior should be limited to make the market structure safer and more fair for all the investors. Recently, many exchanges and regulatory authorities have taken actions against this type of HFT
strategies. In fact, the high frequency trading firm Citadel LLC was fined $800,000 for violations including market spamming and cancelation.
33
NASDAQ stated that the firm, “Failed to prevent the strategy from sending millions of orders to the exchanges with few or no executions.”3
3. Strengthen the enforcement preventing market manipulation activities by high frequency traders. The SEC has already done a great deal in this matter, but given the nature of HFT, it is very hard to show whether they have intent to artificially affect prices. Many high frequency trading firms are not in the market as long-term investors, and they have no interest whatsoever in the company fundamentals. They are aiming at taking profit from rapid trading without any overnight positions. Because of HFT’s large volume, it could easily affect a stock’s price in a matter of seconds and milliseconds. Therefore it is very important for the regulatory authorities to prevent events like this from happening.
The discussion on market structure is extremely complex, and I believe that I have barely scratched the surface in my limited research on this subject. To
demonize HFT is not necessary, and to ignore HFT’s potential risks is also not feasible. As the chairwoman of the SEC, Mary Jo White, said, “Our markets are not broken and they are not static. In that sense, our work on market structure is never finished – the speed with which technology and markets change makes that
impossible – instead, we must always be focused on what in our market structure can be improved for the benefit of investors and companies.”
3
https://www.nasdaqtrader.com/content/marketregulation/NASDAQ/DisciplinaryActions/CDRG_NQ_ 2014.pdf
34
Appendix I: Average Daily Trade Size and Trading Volume Comparison
0 200000000 400000000 600000000 800000000 1E+09 1.2E+09 1.4E+09 7/20/2007 7/20/2008 7/20/2009 7/20/2010 7/20/2011
Trade Size and Trading Volume
Comparison
Size Volume
35
Appendix II: Change in Dollar Realized Spread of the 10 Random Selected Stocks
36
37 References:
Ahlstedt, J., & Villysson, J. (2012). High Frequency Trading. Retrieved from
http://www.math.chalmers.se/~rootzen/finrisk/Gr5_Johan_Jonathan_HFT.pdf
Agarwal, A. (2012). High Frequency Trading: Evolution and the Future. Retrieved from
http://www.capgemini.com/resource-file-access/resource/pdf/High_Frequency_Trading__Evolution_and_the_Future.pdf
Boehmer , E., Fong , K., & Wu , J. (2014). International Evidence on Algorithmic Trading. AFA 2013 San Diego Meetings Paper . Retrieved from http://papers.ssrn.com/sol3/papers.cfm?abstract_id=2022034
Conrad, J., Wahal, S., & Xiang, J. (2014). High Frequency Quoting, Trading, and the Efficiency of Prices. Retrieved from
http://papers.ssrn.com/sol3/papers.cfm?abstract_id=2357122
Jones, C. (2013). What Do We Know About High-Frequency Trading? Retrieved from http://papers.ssrn.com/sol3/papers.cfm?abstract_id=2236201
Kirilenko, A. A., & Lo, A. W. (2013). Moore’s Law versus Murphy’s Law: Algorithmic Trading and Its Discontents. The Journal of Economic Perspectives, 27(2), 51–72.
Staff of the U.S. Securities and Exchange Commission. (2005). Final rules and amendments to joint industry plans. [Release No. 34-51808; File No. S7-10-04]. Retrieved from http://www.sec.gov/rules/final/34-51808.pdf
38
Staff of the U.S. Securities and Exchange Commission. (2014). Equity Market Structure Literature Review Part II: High Frequency Trading. Retrieved from:
http://www.sec.gov/marketstructure/research/hft_lit_review_march_2014.pdf
Hope, B. (2014). Researcher Argues for Preserving Floor Trading. Retrieved from http://online.wsj.com/articles/researcher-argues-for-preserving-floor-trading-1410127614?mod=WSJ_hp_RightTopStories
Lati, R. (2009). The Real Story of Trading Software Espionage. Retrieved from http://www.wallstreetandtech.com/trading-technology/the-real-story-of-trading-software-espionage/a/d-id/1262125?
Jones, C. M. (2013). What do we know about high-frequency trading? , 51. Retrieved from http://online.wsj.com/public/resources/documents/HFT0324.pdf