Penetration of Microfinance Industry in India
Parijat Dhar1 and Dr. Nissar A. Barua 2
1. Assistant Professor, Department of Economics, Bongaigaon College, Bongaigaon, Assam 2. Professor, Department of Economics, Gauhati University, Guwahati, Assam
Abstract
Microfinance is an important institution and mechanism of credit delivery, particularly for the
poor and deprived. A number of studies have been taken up in India and other developing
countries which highlight the success of various microfinance programmes to alleviate poverty in
rural areas, promoting holistic development of individuals, communities and developing small
enterprises to promote entrepreneurship development particularly for the womenfolk. The
importance of the microfinance programmes and the success of the institutions offering
microfinance services in various developing countries come to the fore due to the persistent
failure and non-responsiveness of the formal financial institutions in the sphere of rural
development in general and rural credit in particular. In India there are two different models
adopted for the delivery of microfinance services to the poor- Self Help Groups (SHGs) and
Microfinance Institutions (MFIs). But the penetration of these two models have been uneven in
the country with microfinance services remaining concentrated mainly to the Southern region of
the country while the North and the North-Eastern region are still lacking the services of both the
formal sources of finance and also the microfinance services. With this background the paper
makes an attempt to look into the outreach of both the microfinance models in various regions of
the country and construct a state-wise index of microfinance penetration.
Introduction
Until about the mid-1960s the responsibility of meeting the credit needs in the rural areas of
India was entrusted primarily to the co-operative banking sector. As the technological
developments in the agricultural sector started gaining momentum, the commercial banks were
expected to play an increasing role in the rural credit market through branch expansion and direct
lending. The overriding objective of nationalization was the taking of banking to the masses
(Christabell and Vimal 2012). The government envisaged that 40 percent of the total credit of the
commercial banks should be channelised to priority sectors, groups or regions to support
activities that were either considered to be socially beneficial or inherently risky and borrower
groups that were likely to be marginalized in the credit markets, at lower interest rates. These
measures had a strong impact on rural economy.
Although the banking system has experienced phenomenal growth in terms of geographical
spread, deposit mobilization and disbursal of credit in rural areas after nationalization, bank
credit remains by and large inaccessible to the poor. After more than six decades of
independence, the formal financial institutions have not been able to ensure better and even
distribution of credit. The very drive of the poor people to engage themselves through
self-employment is not given priority by the formal financial sector that is yet to come out of their
conventional mindset. As the poor have not been traditionally recognized as creditworthy, they
are not perceived to be potential clientele for credit by the formal financial sector. Out of 63
million operational holdings below 1 ha of land, less than 25 percent had access to formal
agricultural credit in 1990-91 (Vatta 2003). The Dantwala committee on RRBs concluded that
the agricultural credit advanced by commercial banks had been additive and unable to fill the
geographical credit gap not covered by the cooperatives. While informal lenders, despite its
exploitative nature, still continue to occupy a sizeable share of the rural credit market.
Collateral-free lending, proximity, timely delivery and flexibility in loan transactions are some of the
attractive features of the informal credit system. In such a situation, formal credit still remains
In recent periods, banking sector witnessed tremendous changes in terms of technological
advancements, internet banking, online money transfers, etc. But it is a reality that access to such
technology is restricted only to certain segments of the society. Indeed, some trends, such as
increasingly sophisticated customer segmentation technology have led to restricted access to
financial services for some groups. There is a growing divide, with an increased range of
personal finance options for a segment of high and upper middle income population and a
significantly large section of the population who lack access to even the most basic banking
services. This is termed as “financial exclusion” (Christabell and Vimal2012).
Amidst the distressed news, enthusiasm has been building about a set of unusual financial
institutions prospering in distant corners of the country. These institutions united under the
banner of “microfinance” share a commitment to serving clients that have been otherwise
excluded from the formal banking sector and to carry forward the drive towards achieving 100
percent financial inclusion. Microfinance, in India, presently provides mainly savings and credit
facilities under different models, viz., (a) the banks providing “no-frills” deposit facilities,
remittances, insurance and small loans; (b) the self-help group (SHG)-bank linkage model; (c)
the microfinance institutions (MFI) model; (d) post offices have also been providing small
savings, remittance facilities and postal life insurance facilities (Karmakar 2009). Microfinance
institutions have good potential in reaching out to the rural poor to bring them under the ambit of
the formal financial system and to address the basic issues of rural development where the
formal financial institutions have not been able to make significant headway.
Micro-credit has been defined as “programmes that provide credit for self-employment and other
financial and business services to very poor persons” (Micro Credit Summit 1997). Microfinance
can be interpreted in a broader context to contain both microcredit and micro savings even
though microcredit and microfinance have come to be used interchangeably. Microfinance is a
financial service of small quantity provided by financial institutions to the poor (Dasgupta 2005).
These financial services may include savings, credit, insurance, leasing, money transfer, equity
transaction etc, that is, any type of financial service, provided to customers to meet their normal
(i) transaction value is small and (ii) customers are poor (Dasgupta and Rao 2003). Such a
definition encompasses a large variety of initiatives ranging from individual agents in the
informal sector (like moneylenders, traders, commission agents, jobbers, etc.), to informal
groups (chit funds, rotating savings and credit associations) and formal sector institutions.
However, there has been a growing tendency to use the term microfinance only to refer to
formalised institutions. Thus, the World Development Report (2000-01) has described
microfinance as a „market-based formal mechanism‟ to hedge against the risks faced by poor
people as compared to the „informal group-based mechanisms‟ like savings and credit
associations (Nair 2001).
There are two main models of micro credit in the country and they are the Self Help Group Bank
Linkage Model (SBLP) and the „MFI model‟ (Sinha 2009). In the case of the banking model Self
Help Groups (SHGs) are formed and financed by banks. In some cases SHGs are formed by
formal agencies/NGOs and financed by banks. In the MFI model, SHGs are formed and financed
by the Microfinance Institutions (MFIs) that obtain resource support from various channels.
While the MFI model is growing rapidly, the SBLP is by far the more dominant model in terms
of outreach. Both these models are very different from each other in methodologies adopted and
legal forms of institutions involved in service delivery- SBLP is run by the government while the
MFI model is privately managed with some institutions being regulated by the Reserve Bank of
India (Sinha 2009).
The SBLP which followed an exponential growth path for around 18 years till 2010, has shown
in recent years signs of having levelled off. The data provided by NABARD for the year 2014
has shown a substantial decline of nearly 6 percent in the number of SHGs with outstanding bank
loans to 4.2 million at the end of March 2014 as compared to the previous year (NABARD
2014). The southern region significantly contributed to the decline with the leading states with
the leading states of Andhra Pradesh, Tamil Nadu, Karnataka and Kerala all registering a decline
ranging from about 4 to 23 percent in the number of SHGs with loan outstanding. As for the
changes in regional distribution, the share of the Southern states continued to increase both in
Western and Eastern regions has also marked improvements while the share of the Northern,
North-Eastern and Central Regions experienced a decline during this period.
MFIs at present operate in 29 States, 5 Union Territories and 563 districts in India. As of March
2017, the reporting MFIs had nearly 11644 branches spread across India (Bharat Microfinance
Report 2017). The total number of clients served by MFIs stood at 295 lakh as on 31 March,
2017. The majority of these clients are being served by NBFC-MFIs (81.82%), generally the
larger ones. Out of the total client base, the North-Eastern and Northern regions have the least
client outreach number with 5 percent and 4 percent respectively.
With this background the major objective of the study is to examine the outreach of microfinance
across various states of India by constructing a Microfinance Penetration Index (MPI) on the
basis of pre-determined dimensions.
Objectives
The study has been taken up with the following objectives:
(i) To look into the regional variation in the spread of SHGs.
(ii) To explore the outreach of Microfinance Institutions (MFIs) in various regions of the
country.
(iii) To construct a state-wise index of microfinance penetration in the country.
Methodology
(i) Coverage of the Study
The present study is a macro level analysis and the area chosen for the study is the
(ii) Data Source
The study is based on mainly secondary sources of data. Data has been collected from
various published reports of NABARD, Government of India, Bharat Microfinance
Report, Inclusive India Finance Reports and other empirical research works.
(iii) Line of analysis
The line of analysis followed for the present study is of descriptive type. Data has
been arranged and presented in tabular form for further analysis leading to the
fulfilment of the first two objectives of the study. For the fulfilment of the third
objective an index of microfinance penetration (MPI) has been constructed using the
following formula (Srinivasan 2009).
Share of microfinance clients in the state (in proportion to total clients of MFI
and SHG models in India)
MPI = ---
Share of households in the state (in proportion to total households in India)
Findings and Discussions
The outreach of microfinance programmes across various regions in the country under both the
models adopted in the country has been uneven. The Southern and Eastern regions are rich in
terms of client outreach and loan portfolio both under the SBLP and MFI models. While the
North-eastern and Northern regions have not made a significant headway in this regard with
Spatial Distribution of SHGs
Distribution of SHGs in the country has always remained skewed towards the Southern region
which accounts for almost half of the SHGs in the country (48 percent) followed by Eastern
region with 20 percent share of the total SHGs in 2016-17 (NABARD 2017). Among the states
Tamil Nadu has the maximum number of SHGs (12.8 percent). Compared to the previous year,
there has been a marginal fall in the share of saving linked SHGs in the Southern region from
49.75 percent to 48.32 percent and in Northern region from 4.92 percent to 4.69 percent while
the other regions have recorded a slight upward trend. In North-eastern region, apart from
Tripura all other states and all the states in the Central region have recorded a rise in the number
of savings linked SHGs during 2016-17 as compared to the previous year. The region-wise
distribution of SHGs in India during the period 2016-17 has been presented in the figure below.
Figure 1: Distribution of SHGs across different regions of India
Source: Status of Microfinance in India 2016-17, NABARD 5%
20%
11%
12% 48%
Northern
North-Eastern
Eastern
Central
Western
Southern 4
Region-wise Bank Loans Disbursed to SHGs
An analysis of region-wise distribution of SHGs with loan disbursement during 2016-17 shows
that Southern region has the maximum share with 62 percent followed by Eastern region with 21
percent. Out of total 16.26 lakh SHGs which availed loans during 2016-17 one third (5.38 lakh)
belonged to Andhra Pradesh and Telengana put together. States like Bihar, Odisha, Uttar Pradesh
and Rajasthan have reported substantial increase in the number of SHGs credit linked and
quantum of fresh loans extended while Jharkhand has shown a decline in the number and
quantum of fresh loans issued. The North-Eastern region has the lowest share with only 1 percent
loan disbursed to SHGs out of the total.
Figure 2: Region-wise Disbursement of loans to SHGs during 2016-17
Source: Status of Microfinance in India, 2016-17 NABARD
Regional Outreach of MFIs
According to The Bharat Microfinance Report 2017, MFIs currently operate in 29 states, 4
Union Territories and 563 districts in India. A total of 90 MFIs have confined their operations to
only one state, while 57 MFIs have been continuing its operation in two to five states. 21 MFIs
with a larger outreach and portfolio have their operations in more than five states, out of which
four leading MFIs are operating in more than 15 states. MFIs with a relatively smaller scale or
regional focus have concentrated their operations in one to two states only whereas other MFIs
3% 1%
21%
7%
6% 62%
Northern
North-Eastern
Eastern
Central
Western
have spread across a higher number of states in order to increase their scale of operations and at
the same time mitigate the risk of concentrating in one particular area. MFIs which have been
operating in many states are generally larger in size and follow the legal form of an NBFC-MFI.
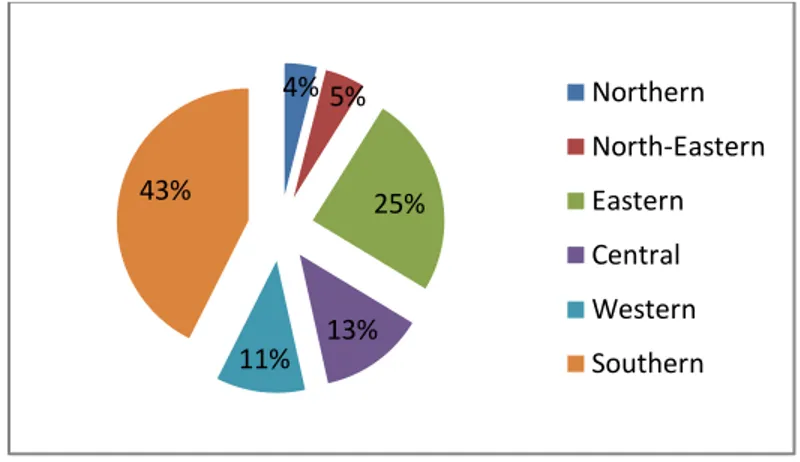
Out of the total client base of 295 lakh, the Southern region contributes to 43 percent of the total,
followed by 25 percent in Eastern region. The North-East and Northern regions have the least
clientele share of the total with only 5 percent and 4 percent respectively. While the Central
region and Western region have contributed to 13 percent and 11 percent of the total share
respectively.
Figure 3: Distribution of MFIs across different regions during 2017-18
Source: The Bharat Microfinance Report 2017
Region-wise loan portfolio of MFIs
MFIs have been very instrumental in providing credit to clients outside the net of formal
financial services. Among the various regions, the Southern region has been seen to dominate the
overall loan portfolio outstanding of MFIs with 41 percent followed by Eastern region with 23
percent of loan portfolio. The North and Northeastern regions have continued to have the least
share of loan portfolio with 6 percent each. While the Central and Western region have 14
percent and 10 percent loan portfolio share respectively. 4% 5%
25%
13% 11% 43%
Northern
North-Eastern
Eastern
Central
Western
Figure 4: Loan Portfolio of MFIs across different regions during 2017-18
Source: The Bharat Microfinance Report 2017
Microfinance Penetration Index
A regional analysis of microfinance spread across the country, as discussed above, has revealed a
higher concentration in the southern states. The Southern states have been pre-dominant in
microfinance activities since the very beginning although in recent years microfinance network is
spreading at a substantial rate in the eastern and central regions of the country. This can be
reflected in the Microfinance Penetration Index (MPI). This index was calculated for the first
time in the year 2008 in the State of the Sector Report, 2008. The MPI provides estimates of the
relative share of the states in microfinance clients as compared to their share in the population
(Nair and Tankha 2015). It compares the distribution of microfinance clients to the distribution
of total households in the country. Hence, a value of more than one indicates that the state‟s
share in microfinance clients is more than proportional to its population thus indicating better
than par performance. A score of less than one, which is the par value, indicates a comparatively
poor performance by the state. The computation of the index is presented in the table below with
the state-level scores. 6%
6%
23%
14%
10% 41%
Northern
North-Eastern
Eastern
Central
Western
Table 1: Microfinance Penetration Index during 2017-18
States Total No. of SHGs with loan
outstanding*
No. of SHG members*
No. of MFI Clients**
Total Microfinance Clients
Share of State to Total
Total Households
Share of households to total
MPI#
Andhra
Pradesh 751357 9767641 104000 9871641 35.80 21024534 8.52 1.25
Arunachal
Pradesh 239 3107 19200 22307 0.02 261614 0.11 0.22
Assam 101457 1318941 773600 2092541 2.26 6367295 2.58 0.88
Bihar 364169 4734197 2257512 6991709 7.55 18940629 7.68 0.98
Chhattisgarh 94018 1222234 535000 1757234 1.90 5622850 2.28 0.83
Delhi 415 5395 115000 120395 0.13 3143600 1.27 0.10
Goa 1598 20774 7050 27824 0.03 322813 0.13 0.23
Gujarat 48364 628732 460400 1089132 1.18 12181718 4.94 0.24
Haryana 22497 292461 383000 675461 0.73 4717954 1.91 0.38
Himachal
Pradesh 16486 214318 13000 227318 0.25 1476581 0.60 0.41
Jammu &
Kashmir 6034 78442 3000 81442 0.09 2015088 0.82 0.11
Jharkhand 87274 1134562 621000 1755562 1.90 6181607 2.51 0.76
Karnataka 649709 8446217 6833000 15279217 16.50 13179911 5.34 3.09
Kerala 142923 1857999 742120 2600119 2.81 7716370 3.13 0.90
Madhya
Pradesh 91730 1192490 2053500 3245990 3.51 14967597 6.07 0.58
Maharashtra 227912 2962856 2133000 5095856 5.50 23830580 9.66 0.57
Manipur 1762 22906 73600 96506 0.10 507152 0.21 0.50
Meghalaya 1265 16445 12550 28995 0.03 538299 0.22 0.14
Mizoram 1378 17914 57460 75374 0.08 221077 0.09 0.90
Nagaland 2449 31837 4500 36337 0.04 399965 0.16 0.25
Odisha 220662 2868606 2294000 5162606 5.58 9661085 3.92 1.42
Punjab 11882 154466 546000 700466 0.76 5409699 2.19 0.35
Rajasthan 86484 1124292 628300 1752592 1.89 12581303 5.10 0.37
Sikkim 696 9048 11200 20248 0.02 128131 0.05 0.44
Tamil Nadu 384307 4995991 3225500 8221491 8.88 18493003 7.50 1.18
Tripura 33976 441688 43300 484988 0.52 842781 0.34 1.54
Uttar Pradesh 198174 2576262 2982000 5558262 6.00 32924266 13.35 0.45
Uttarakhand 14489 188357 192000 380357 0.41 1997068 0.81 0.51
West Bengal 669469 8703097 2116100 10819197 11.69 20067299 8.13 1.44
All India 4848287 63027731 29550000 92577731 100.00 246692667 100 1.00
Source: * Status of Microfinance in India, 2016-17, NABARD
** The Bharat Microfinance Report 2017, Sa-Dhan # -- Own Calculations
The table above highlights the state-wise index of microfinance penetration which has been
calculated on the basis of pre-determined dimensions. As can be seen from the table, almost all
the Southern states have recorded huge number of microfinance clients in comparison to the
other states, both in respect of SHG members and MFI clients. The highest number of
by West Bengal and Andhra Pradesh; while the lowest number of microfinance clients has been
observed at Sikkim with only 20,248 clients. In the North-Eastern region, baring Assam (20.92
lakh clients), all other states in this region have a miniscule share out of the total microfinance
clients of the country. The Northern states viz., Delhi, Uttarakhand, Himachal Pradesh and
Jammu & Kashmir also have a smaller proportion of microfinance clients relative to the
Southern and Eastern states. The Microfinance Penetration Index (MPI) in the table above
reveals that there is concentration of the microfinance Sector in the Southern region with the
Southern States leading in penetration. The top six states with high levels of penetration have
been found out to be Karnataka with an MPI value of 3.09, Tripura (1.54), West Bengal (1.44),
Odisha (1.42), Andhra Pradesh (1.25) and Tamil Nadu (1.18). The MPI value of more than one
reflects that as the share of microfinance clients are in the numerator, so the clients obtained are
more than proportional to the total population. With the microfinance penetration being low in
Northern region, the lowest MPI value has been observed in Delhi (0.10). The bottom six states
in respect of microfinance penetration have been found to be Delhi (0.10), Jammu & Kashmir
(0.11), Meghalaya (0.14), Arunachal Pradesh (0.22), Goa (0.23) and Nagaland (0.25). Assam has
achieved an MPI value of 0.88 which is slightly less than the par value of 1 and hence remains a
potential region before the microfinance sector to tap the excluded sections of the population
from the services of formal financial institutions. Other states which have achieved MPI values
closer to one are Bihar (0.98), Kerala (0.90), Mizoram (0.90), Chhattisgarh (0.83) and Jharkhand
(0.76).
Conclusion
Despite major structural changes in credit institutions and forms of rural credit in the
post-independence period, the exploitation of the rural masses in the credit market is one of the most
pervasive and persistent features of rural life in India. In most developing countries, a large
segment of society, particularly low-income people has very little access to financial services,
both formal and semi-formal. As a consequence, many of them have to necessarily depend either
context, microfinance has emerged as a financial innovation tool to serve the millions of poor
households that are out of reach of the formal banking and financial institutions. Microfinance
has become, in recent years, a fulcrum for development initiatives for the poor, particularly in the
Third World countries and is regarded as an important tool for poverty alleviation. In India
microfinance has been operating through the two models of Self Help Group and Microfinance
Institutions. Both these delivery models have penetrated deep into various regions of the country;
but interestingly the Southern region has almost reached the level of saturation in terms of
concentration of microfinance activities. While the North-Eastern region, which remains
backward in terms of coverage by formal financial institutions, has still a lot remaining
unexplored even for the microfinance sector. Access to safe, easy and affordable credit and other
financial services by the poor and vulnerable groups, disadvantaged areas and lagging sectors is
recognized as a pre-condition for accelerating growth and reducing income disparities and
poverty. Access to a well-functioning financial system, by creating equal opportunities, enables
economically and socially excluded people to integrate better into the economy and actively
contribute to development and protects themselves against economic shocks. Therefore it is of
utmost necessity for the microfinance delivery models to reach out to the hitherto unreached,
excluded areas from the purview of formal financial system in order to alleviate poverty, reduce
regional disparities, reduce inequalities and focus on skill building of the otherwise neglected
Reference
1. Christabell, P.J. & Vimal, Raj A. (2012) “Financial Inclusion in Rural India: The role of Microfinance as a Tool”, IOSR Journal of Humanities and Social Science, 2(5): 21-25.
2. Dasgupta, R. (2005) “Microfinance in India: Empirical Evidence, Alternative Models and Policy Imperatives”, Economic and Political Weekly, Vol. 40, No. 12, pp-1229-1230+1232-1237.
3. Dasgupta, R. and K.D. Rao (2003) “Microfinance in India: Issues, Challenges and Policy Options”, Savings and Development, Vol. 2, No. XXXVII.
4. Karmakar, K.G. (2009) “Emerging Trends in Microfinance”, Economic and Political Weekly, Vol. XLIV, No. 13, March 28, 2009.
5. Micro-Credit Summit (1997) “Declaration and Plan of Action” [Online]
Available:http://www.microcreditsummit.org/declaration.htm. [accessed on 10/08/2015].
6. Nair, T.S. (2001) “Institutionalising Microfinance in India: An Overview of Strategic Issues”, Economic and Political Weekly, 36(4): 399-404.
7. Nair, T. and A. Tankha (2015) “Inclusive Finance India Report 2014”, Oxford University press, New Delhi, 2015.
8. Sinha, F. (2009) “State of Microfinance in India” [Online]
Available:http://www.inm.org.bd/publication/state_of_micro/India.pdf. [accessed on 15/08/2015]
10.NABARD (2017) “Status of Microfinance in India 2016-17”, NABARD.
11.The Bharat Microfinance Report (2017), Sa-Dhan, New Delhi, 2014.