Original Research Article
Study of glucose levels in newborn with reference to hypoglycemia
Gaddam Zion Eluzai*, K. Poojitha
INTRODUCTION
Glucose provides approximately 60% to 70% of fetal energy needs. Almost all fetal glucose derives from the maternal circulation by the process of transplacental-facilitated diffusion that maintains fetal glucose levels at approximately two-thirds of maternal levels. The severing of the umbilical cord at birth abruptly interrupts the source of glucose. Subsequently, the newborn must rapidly respond by glycogenolysis of hepatic stores,
inducing gluconeogenesis, and utilizing exogenous nutrients from feeding to maintain adequate glucose levels.1
During this normal transition, newborn glucose levels fall to a low point in the first 1 to 2 hours of life (to as low as 30 mg/dL) and then increase to >45 mg/dL, stabilizing at mean levels of 65 to 70 mg/dL by 3 to 4 hours of age.
The incidence of hypoglycemia varies by population and definition used. Furthermore, blood glucose levels change Department of Pediatrics, SVS Medical College and Hospital, Yenugonda, Mahbubnagar, Telangana, India
Received: 02 November 2019
Revised: 16 August 2019
Accepted: 07 September 2019
*Correspondence: Dr. Gaddam Zion Eluzai, E-mail: [email protected]
Copyright: © the author(s), publisher and licensee Medip Academy. This is an open-access article distributed under
the terms of the Creative Commons Attribution Non-Commercial License, which permits unrestricted non-commercial use, distribution, and reproduction in any medium, provided the original work is properly cited.
ABSTRACT
Background: Hypoglycemia is one of the common metabolic problems in neonatal medicine. Early diagnosis and
treatment of neonatal hypoglycemia is important as many studies found that, hypoglycaemic episodes in neonates lead to neurodevelopmental and physical growth deficits. In this study, blood glucose levels at different time points were assessed and the influence of maternal blood glucose, mode of delivery, gestational age on neonatal blood glucose levels were studied.
Methods: Blood glucose levels were low at 0 and 6th hour and maximum at 24th hour. The blood glucose levels
ranged from 27 mg/dl to 140 mg/dl. Neonates with high maternal blood glucose were hypoglycaemic, showing a negative correlation.
Results: The mean blood glucose levels were low in pre-term and post term babies compared to term and the range
was wide in pre-term and term babies compared to post-term. The mean blood glucose levels were high and range was wide in babies delivered vaginally at all the time points compared to the babies delivered by LSCS. 17% babies were hypoglycaemic at birth but none of them had signs. The major signs noted were jitteriness (88%), high cry (88%), lethargy (55%), tremors (55%), limpness (22%), apathy (22%), weak cry (11%) and poor feeding (11%).
Conclusions: 0 and 6th hour are the vulnerable time points for hypoglycaemia. Neonates with high maternal blood
glucose, pre-term, post-term and babies delivered by LSCS were more prone for hypoglycaemia requiring blood glucose monitoring. There is a wide variation in signs of hypoglycaemia and babies showing signs require monitoring.
Keywords: Blood glucose levels, Hypoglycaemia, Pre-term, Post-term
markedly within the first hours of life, and it is necessary to know the infant's exact age in order to interpret the glucose level and diagnose hypoglycemia. 2,3 However, a
recent prospective New Zealand study of infants at risk for hypoglycemia (defined as a blood glucose <2.6 mOsm [<46.8 mg/dL]) demonstrated that 47% of large for gestational age (LGA) infants, 52% of small for gestational age (SGA) infants, 48% of infants of diabetic mothers (IDMs), and 54% of late preterm infants were found to be hypoglycemic.4 Hypoglycemia is one of the
common metabolic problems in neonatal medicine, the assessment of blood glucose has consequently become a significant part of basic neonatal care in many hospitals.5
Various factors influence newborn blood glucose concentrations even in healthy term newborns, like birth weight, gestational age, presence or absence of disease, perinatal complications, mode of delivery and feeding behaviour.6-8 The reported incidence of hypoglycemia is
approximately 16% in large for gestational age babies.9
The incidence of hypoglycemia was 8.1% when hypoglycemia was defined as blood glucose level < 1.7 mmol/L (30.6 mg/dl) and 20.6% when it was defined as <2.2 mmol/L (39.6 mg/dl).10
Aims and objectives
• To assess the blood glucose levels in newborn babies born at S.V.S Medical College and Hospital, Mahbubnagar.
• To assess the influence of mode of delivery on neonatal blood glucose levels.
• To assess the influence of gestational age on neonatal blood glucose levels.
• To assess the influence of weight for gestational age on neonatal blood glucose levels.
• To assess the signs associated with hypoglycemia.
METHODS
It is a hospital based prospective study carried out in labor room, operation theatre, Post-operative ward, NICU and postnatal ward of SVS Medical College Hospital conducted during the study period.
Data collection
Data collection was undertaken by applying following inclusion and
Inclusion criteria
Babies born at SVS Medical College and Hospital, irrespective of gestational age, weight for age, sex and mode of delivery.
Exclusion criteria
Sick infants with congenital anomalies and chromosomal anomalies were excluded from the study.
Performance analysis
The performance data for Accu-Chek Performa system (Accu-Chek Performa meter with Accu-Chek Performa test strips) were obtained using capillary blood from diabetic patients (method comparison, accuracy) venous blood (repeatability) and control solution (reproducibility). The system is calibrated with venous blood containing various levels of glucose. The reference values are obtained using hexokinase method.
For method comparison, the results were compared with results obtained using the hexokinase method with deproteinization (automatic analyzer).
Measuring principle
The enzyme on test strip, glucose dehydrogenase, in the presence of coenzyme, converts the glucose in the blood sample to gluconolactone. This reaction creates a harmless direct electrical current that interprets for the blood glucose. The sample and environmental conditions are also evaluated using a small alternate current signal.
Blood glucose levels were measured in mothers after taking all the aseptic measures.
After taking all aseptic precautions, blood glucose levels of the newborns were measured at 0,3,6,12 and 24 hours after birth. These time points were chosen in order to study the most vulnerable period of glucose homeostasis.
All the newborns were exclusively breastfed as per the hospital policy. In case the blood glucose levels were below 40 mg/dl (2.2 mmol/L) the signs of hypoglycemia were noted and the baby was treated with a trial of additional breastfeed or expressed breast milk and glucose levels were monitored. Trial of oral feeds (expressed breast milk or formula) and repeat blood test after 1 hour.
If the baby had hypoglycemia, it was noted whether the baby was symptomatic. The time since last feed was also noted before noting the blood glucose level.
RESULTS
There were 100 babies irrespective of sex, mode of delivery, parity of mother, gestational age and weight, were enrolled in the study and data was collected according to the proforma. Of the 100 babies, 58 were male and 42 were female. Forty nine babies were delivered vaginally and remaining 51 by LSCS. Fifty four babies were born to primiparous mother and forty six to multiparous mother (Figure 1).
Figure 1: Distribution of newborns based on gender
Figure 2: Distribution of babies based on gestational age.
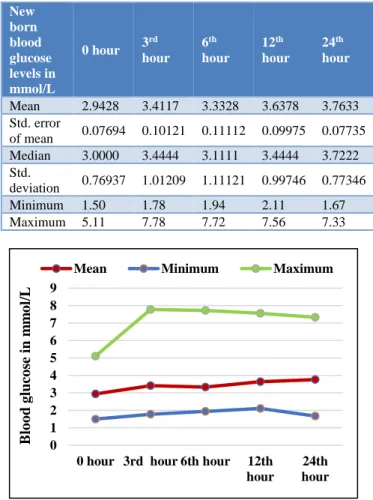
There was a wide variation in the incidence of hypoglycemia. In this study 17% of the babies were hypoglycemic at birth, 11% at 3rd hour, 7% at 6th hour, 1% at12th hour and 1% at 24th hour (Table 1).
Blood glucose levels were seen at 5 different time points are noted at points starting from the 0 hour to 24th hour ,it was observed that blood glucose level attained the maximum level at 3rd hour and minimum level at 0th hour and subsequently increased to the maximum peak at 3rd hour and subsequently declined Blood glucose levels were found to be low at 0 hour, then an increase in the mean blood glucose levels at 3rd hour followed by a minimal decrease at 6th hour (Figure 3).
Hypoglycemia was noted in 25% of 34-36 weeks GA babies, 10% of 36-38weeks GA age babies, 18% of 38-40 weeks GA babies and 25% of 40-42 weeks GA. This showed that pre-term and post-term babies were more prone for hypoglycemia when compared to term babies. (Figure 4).
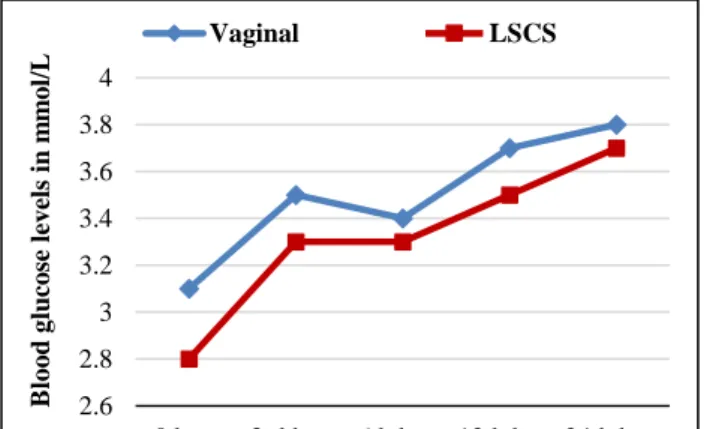
The mean blood glucose levels were high in babies delivered vaginally, at all the time points compared to the babies delivered by LSCS. This suggests that babies delivered by LSCS require blood glucose levels
monitoring, as they are at risk for hypoglycemia (Figure 5).
Table 1: Variation in Blood glucose levels in mmol/L in newborns at 5 different time points.
New born blood glucose levels in mmol/L
0 hour 3
rd
hour
6th
hour
12th
hour
24th
hour
Mean 2.9428 3.4117 3.3328 3.6378 3.7633 Std. error
of mean 0.07694 0.10121 0.11112 0.09975 0.07735 Median 3.0000 3.4444 3.1111 3.4444 3.7222 Std.
deviation 0.76937 1.01209 1.11121 0.99746 0.77346
Minimum 1.50 1.78 1.94 2.11 1.67
Maximum 5.11 7.78 7.72 7.56 7.33
Figure 3: Blood glucose levels in newborns at 5 different time points
Figure 4: Variation in blood glucose levels at different time points based on gestational age.
The major signs of hypoglycemia noted were jitteriness in 8 babies (88%), high cry in 8 babies (88%), lethargy in 5 babies (55%), tremors in 5 babies (55%), limpness in 2 babies (22%), apathy in 2 babies (22%), weak cry in 1 58%
42%
Male Female
34-36w
36-38w
38-40w
40-42w
No of babies 4 20 72 4
0 10 20 30 40 50 60 70 80
No
.o
f
ba
bies
0 1 2 3 4 5 6 7 8 9
0 hour 3rd hour 6th hour 12th
hour
24th hour
B
lo
o
d
g
luco
se
in
m
m
o
l/L
Mean Minimum Maximum
2 2.5 3 3.5 4 4.5
0 hour 3rd hour 6th hour 12th hour 24th hour
B
lo
o
d
g
lu
co
se
le
v
el
s
in
m
m
o
l/
L
baby (11%) and poor feeding in 1 baby (11%). This suggests that there is a wide variation in signs of hypoglycemia in neonates (Figure 6).
Figure 5: Variation in blood glucose levels at different time points based on mode of delivery.
Figure 6: Various signs seen in hypoglycaemic babies
Figure 7: Hypoglycaemia at different time points based on gestational age.
The babies showing these signs should be carefully monitored for hypoglycemia. At birth the mean blood
glucose levels were noted to be low in 34-36 weeks and 40-42 weeks GA neonates. It was high in 38-40 weeks GA neonates. But later at 3 hours the mean blood glucose levels were high in 34-36 weeks GA neonates but remained low in 40-42 weeks GA neonates. The mean blood glucose levels were almost equal in 36-40 weeks (Figure 7).
DISCUSSION
Blood glucose levels were studied in 100 mothers and newborns irrespective of gestational age, weight for gestational age, sex and mode of delivery. It revealed that, there was a negative correlation between the maternal blood glucose taken within half an hour of delivery or at the time of delivery and neonatal blood glucose level taken at birth. The blood glucose levels were low in neonates at birth, whose mothers had high blood glucose levels. This correlates with the study done by Singhi et al who also found a negative correlation between the maternal blood glucose and neonatal blood glucose levels taken at birth. In this study the blood glucose concentrations were assessed at 5 different time points: 0,3,6,12 and 24 hours of life (Fig4). It was found that, the lowest mean blood glucose levels were seen at 0 hour, then there was mild increase in the mean blood glucose levels at 3rd hour followed by a minimal decrement at 6th hour. Then there was mild increment at 12th hour and the maximum blood glucose levels were reached by 24thhour. This correlates with the study done by Cornblath et al who found that, blood glucose levels in neonates normally fall in the first few hours after birth while endogenous glucose production is beginning. Levels then rise to reach a steady state glucose concentration by 2 to 3 hours after birth8.It was found that the mean blood glucose levels were high in babies delivered vaginally, at all the time points compared to the babies delivered by LSCS. The range of blood glucose levels was narrow in babies delivered by LSCS, at all the time points when compared to babies delivered by normal vaginal route (Figure 5).
This correlates with the study done by Kayiran et al, who showed that neonates delivered by caesarean section had lower plasma glucose levels, as caesarean section involves less stress for the baby and the possible impact of perinatal anaesthesia, compared to a vaginal delivery. After a caesarean section, mothers are often not ready to breast feed for a relatively longer period of time compared to those after vaginal delivery.9
At birth the mean blood glucose levels were noted to be low in 34-36 weeks and 40-42 weeks GA neonates. It was high in 38-40 weeks GA neonates. But later at 3 hours the mean blood glucose levels were high in 34-36 weeks GA neonates but remained low in 40-42 weeks GA neonates. The mean blood glucose levels were almost equal in 36-40 weeks (Figure 7). Similar results were seen in a study done by Kayiran et al, who found that there was a significant decrease in blood glucose 2.6
2.8 3 3.2 3.4 3.6 3.8 4
0 hour 3rd hour 6th hour 12th hour 24th hour
B
lo
o
d
g
lu
co
se
lev
els
in
m
m
o
l/
L
Vaginal LSCS
0 2 4 6 8 10 12 14
0 hour 3rd hour 6th hour 12th hour 24th hour
No
.
o
f
ba
bies
Axis Title
34-36W 36-38W 38-40W 40-42W
0 1 2 3 4 5 6 7 8 9 10
No
.
o
f
ba
concentrations for pre-terms, in the first hour of life, suggesting they were less able to adapt to the cessation of intrauterine nutrition compared to term neonates. He also found that glucose concentration of newborns were observed to rise with increasing gestational age but in this study, it was found that glucose levels increased with the gestational age up to term gestation and then was found to decrease in post-term neonates.9
There was a wide variation in the incidence of hypoglycemia. In this study 17% of the babies were hypoglycemic at birth, 11% at 3rd hour, 7% at 6th hour,
1% at 12th hour and 1% at 24th hour (Figure 3). This can
be correlated with study done in Tehran Children’s Hospital of Iran where the incidence of hypoglycemia was 15.15%.10
Hypoglycemia was noted in 25% of 34-36 weeks GA babies, 10% of 36-38weeks GA age babies, 18% of 38-40 weeks GA babies and 25% of 40-42 weeks GA .This showed that pre-term and post-term babies were more prone for hypoglycemia when compared to term babies in contrast to a study done by Dashthi N et al, who found hypoglycemia in 45.53% of term neonates, 52.84% of preterm neonates and 1.63% of post-term neonates. In this study none of the babies showed signs of hypoglycemia at birth. Overall 9% babies had signs of hypoglycemia, 7% showed signs at 3rd hour, 6% at 6th
hour and 1% at 12th and 24th hours respectively.10
CONCLUSION
There was a statistically significant negative correlation between the maternal and neonatal blood glucose levels taken at birth. This suggests that neonates whose mothers have increased blood glucose levels require monitoring and care should be taken not to administer high dextrose concentration IV fluids to mothers, as it may lead to hypoglycemia in the baby .Blood glucose levels were found to be low at 0 hour, then there was a mild increase in the mean blood glucose levels at 3rd hour followed by a minimal decrease at 6th hour.
Then there was further increment of more than the 3rd hour, at 12th hour and the maximum blood glucose levels were reached by 24th hour. This suggests that 0 and 6th hour are the vulnerable time points for hypoglycemia and require blood glucose monitoring. At birth the blood glucose levels were noted to be low in 34-36weeks and 40-42weeks GA neonates and high in 38-40 weeks GA neonates, revealing that preterm and post-term neonates have low blood glucose levels compared to term neonates. This suggests that pre-term and post-term babies require blood glucose levels monitoring for hypoglycemia.
The mean blood glucose levels were high in babies delivered vaginally, at all the time points compared to the babies delivered by LSCS. This suggests that babies
delivered by LSCS require blood glucose levels monitoring, as they are at risk for hypoglycemia.
The major signs of hypoglycemia noted were jitteriness in eight babies (88%), high cry in eight babies (88%), lethargy in five babies (55%), tremors in five babies (55%), limpness in two babies (22%), apathy in two babies (22%), weak cry in one baby (11%) and poor feeding in one baby (11%). This suggests that there is a wide variation in signs of hypoglycemia in neonates (Figure 6). The babies showing these signs should be carefully monitored for hypoglycemia. Four babies were born to diabetic mother of whom three were hypoglycemic. This suggests that, infants of diabetic mother are prone for hypoglycemia and should have their blood glucose levels monitored.
REFERENCES
1. Schaefer-Graf UM, Rossi R, Buhler C, Siebert G, Kjos SL, Dudenhausen JW, et al. Rate and risk factors of hypoglycaemia in large for gestational age newborn infants of nondiabetic mothers. Am J Obstet Gynecol. 2012;187:913-7.
2. Cole MD, Peevy K. Hypoglycaemia in normal neonates appropriate for gestational age. J Perinatol. 1994;14:118-20.
3. Heck LJ, Erenberg A. Serum glucose levels in term neonates during the first 48 hours of life. J Paediatr. 1987;110:119-22.
4. Cloherty JP, Eichenwald EC, Hansen AR, Stark AR. Hypoglycaemia and Hyperglycaemia. In:(eds): Manual of Neonatal Care. 7th Ed. Wolters Kluwer.
Philadelphia; 2017:311-325.
5. Sexson WR. Incidence of neonatal hypoglycaemia: a matter of definition. J Paediatr. 1984;105:149-50. 6. Bergmeyer HU, Deerfield B, Florida BE. Methods
of enzymatic analysis. Verlag Chemie International. 1974;321-7.
7. Singhi S. Effect of maternal intrapartum glucose therapy on neonatal blood glucose levels and neurobehavioral status of hypoglycaemic term newborn infants. J Perinat Med. 2008;16:217-24. 8. Cornblath M, Hawdon JM, Williams AF,
Aynsley-Green A, Ward-Platt MP, Schwartz R, et al. Controversies regarding definition of neonatal hypoglycaemia, suggested operational thresholds. Pediatrics. 2000;105:1141-5.
9. Kayiran SM, Gurakan B. Screening of blood glucose levels in healthy neonates. Singapore Med J. 2010;51:853-5.
10. Dashti N, Einollahi N, Abbasi S. Neonatal hypoglycaemia prevalence and clinical manifestation in Tehran children’s hospital. Pak J Med Sci. 2007;23:340-3.
Cite this article as: Eluzai ZG, Pooitha K. Study of
glucose levels in newborn with reference to