1
Module 4 ■ Implementation and Audit
2 HOURS 50 MINUTES
LEARNING OUTCOMES By the end of this module, participants will have:
Understood the significance of budget implementation reports and audit reports
Identified and analyzed the key components of a county implementation report
Discussed and understood key elements of an audit report
Module 4 Session 1: Understanding County Implementation Reports
K
EYT
AKEAWAYS COUNTY IMPLEMENTATION REPORTS ARE PRODUCED ON A QUARTERLY BASIS AND SHOULD BE AVAILABLE ON OCTOBER 31,JANUARY 31,APRIL 30, JULY 31(NEXT FY)
IMPLEMENTATION REPORTS SHOULD PROVIDE:
o PERFORMANCE OF REVENUES COMPARED TO THE PREVIOUS YEAR
o PERFORMANCE OF EXPENDITURE BY DEPARTMENT COMPARED TO THE PREVIOUS YEAR
o EXPENDITURE AND REVENUE TARGETS FOR THE QUARTER AND PERFORMANCE AGAINST TARGET
o EXPLANATIONS OF GOOD AND POOR PERFORMANCE AND SOLUTIONS TO THE CHALLENGES FACED BY DEPARTMENTS
T
ASK4.1■7
QUESTIONS ABOUT YOUR COUNTY IMPLEMENTATION REPORT1
HOUR35
MINUTEST
ASKO
BJECTIVE UNDERSTANDING BUDGET IMPLEMENTATION BY ASKING RELEVANT QUESTIONS ON COUNTY IMPLEMENTATION REPORTS
R
ESOURCESN
EEDED Baringo County Government Second Quarter 2015/16 Budget Implementation Status Report.
2
H
OW TOR
UN THIST
ASK1. Present a short introduction of what implementation reports are: which stage of the budget cycle do they correspond to, why are they important, etc. (10 minutes)
2. There are two alternative approaches to running this exercise (PM, p. 120):
Alternative one: Where copies of the county implementation reports from participant counties are available
3. Go through Q1- Q3 using the Baringo second quarter budget implementation report. (15 minutes). 4. Explain what is required to answer Q4- Q7 (Give examples from Baringo briefly). (10 minutes). 5. Ask the participants in groups of two or three to answer Q4 to Q7 using their own county
implementation report and to note down their answers and any other interesting issues that can help the public/ county assembly in their oversight roles (40 minutes)
6. Come back to plenary and allow each group to answer at least one question or present at least one interesting issue identified (20 minutes).
Alternative two: you do not have a copy of any implementation report from participants’ counties
3. Go through Q1- Q3 using the Baringo second quarter implementation report then 4. Explain what is required to answer Q4- Q7
5. Ask the participants in groups of two or three to answer Q4 to Q7 using the Baringo second quarter implementation report and to note down their answers and any other interesting issues that can help the public/ county assembly in their oversight roles (40 minutes).
6. Come back to plenary and allow each group to answer at least one question or one interesting issue identified (25 minutes).
B
ACKGROUNDI
NFORMATION Why implementation reports? The reports are useful for both the county assemblies and the public to monitor how the enacted budgeted is being implemented and as a tool to push for better and more efficient expenditures and collection of revenue.
They are required by the PFM Act
Implementation reports (also referred to as within year reports) are an international best practice document as recommended by global actors like the International Monetary Fund (IMF).1
Note: Implementation reports are a tool of communication and should be viewed as an opportunity to improve performance.
What information should implementation reports contain?
Ideally, implementation reports should give information about who spent the money, what it was spent on and what it produced.
3
Implementation reports should follow the format of the budget to make it easy to track progress.
We would expect county implementation report to give progress by department, programme and sub-programmes.
They should contain both financial and non-financial information.
Financial information includes actual and target revenue and expenditure, variances and absorption rates.
Non-financial information includes information on targets and indicators for program implementation, such as services provided, trainings held, patients treated and so on.
Good reports also have narratives that offer an explanation of performance and discuss emerging challenges and possible solutions. For example, the narrative should help explain the reasons for material differences between targets and actual performance.
Implementation reports produced in the course of the year, e.g., second and third quarter reports, should present revised expenditure plans for future quarters based on performance up to the current quarter.
When are implementation reports produced?
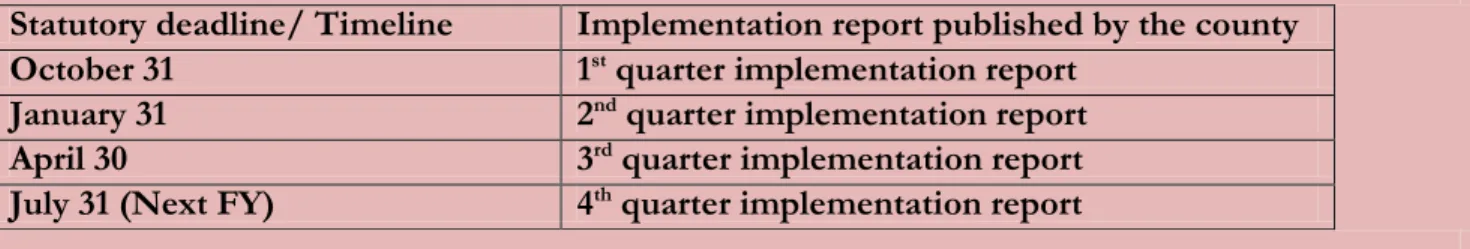
County governments produce these reports within one month of the end of each quarter. The table below shows the dates to expect these implementation reports:
Table 1: Dates to Expect County Quarterly Implementation Reports
Statutory deadline/ Timeline Implementation report published by the county October 31 1st quarter implementation report
January 31 2nd quarter implementation report
April 30 3rd quarter implementation report
July 31 (Next FY) 4th quarter implementation report
Note: Budget implementation review reports are also produced by the Office of the Controller of Budget (OCOB) for counties (and the national government). These give an analysis of counties’ total revenue and expenditure as well as the performance by departments in the relevant quarter. They are not as detailed as county reports, however.
T
ASK(
Q
UESTIONS ANDA
NSWERS)
1. Does the implementation report contain data for the quarter against the same quarter from the previous year?
4 To assess the performance of revenue and spending, it is important to look at similar periods of time each year. This is because both revenue and spending are seasonal. For example, many counties collect most revenue during the third quarter, and collect less than one quarter of the annual revenue target in the other quarters. So it is important to compare first quarter spending against first quarter from the previous year, rather than to look at 25% of the target for the year. Similarly, due to procurement policies, capital spending is often lower in the first quarter and picks up later in the year. To get a sense of performance, then, it is useful to compare the growth of revenue and spending against the same period from the previous year. The implementation report should contain a table with figures that make it easy to make such a comparison. In the case of quarters 2 to 4, cumulative performance up to that point in the year (for example, half year or annual performance) should be given and compared to the same period in previous years.
The report compares the total revenue and expenditures for the first half of FY 2014/15 to the first half of FY 2015/16. This is provided in charts on page 4. It is good practice to provide a comparison of both the specific quarter and the cumulative revenue and expenditure (Q1 and Q2). The Baringo report provides a mix of individual quarter and cumulative results, and is not totally consistent. For example, local revenue is provided for the quarter, while development expenditure is provided for the quarter and half year (and the language refers vaguely to “the period” making it hard to tell immediately if it refers to the quarter or half year).
While the recurrent expenditure increased in the half year, the development expenditure in the half year has reduced (Para. 17). Local revenues have increased slightly in Q2 for FY 2015/16 as compared to Q2 for FY 2014/15.
The comparison of the current and previous year expenditure and revenue is given at the departmental level. For example, the actual expenditure for health services in the FY 2014/15 is given on page 23. Both the recurrent and development expenditure has increased as compared to the previous year. Actual recurrent expenditure has a sharper increase of 286% (from 174 million in 2014/15 to 673 million in the Q2 of 2015/16) as compared to development expenditure that had a decent increase of 22% (from 41m million in 2014/15 to 49 million in the Q2 of 2015/16).
2. Does the report contain data on actual revenue and expenditure against targets for the quarter?
Another way to think about performance is to look at revenue and spending against target. Again, as was mentioned above, targets should be sensitive to the seasonal nature of government finances. So you would expect a lower revenue target in Q1 than in Q3. Targets can be a more refined measure of performance than comparison against the previous year, because they are based on current year expectations, which may be different due to changes in the nature of the budget from year to year. But they may also be unrealistic, as targets are sometimes manipulated to make it appear that a government will have more or less revenue than is actually expected. This may make performance look worse (or better) than it really is. Looking at both performance against last year and performance against target is therefore a good way to fully understand performance. Targets should be derived from past experience, an understanding of cash flow, departmental work plans and the overall budget. Often, there are no targets and the reports look only at the annual budget as the target.
5
In the case of total local revenues, the target for the quarter is given in the report (paragraph 55, page 17). The targeted annual local revenue was Ksh60 million and the county managed to collect a little over Ksh52 million. This is not broken down to indicate the revenue targets by revenue source. The total target expenditure for Q2 is not given in the report. The expenditure targets for the quarter for each department are also not given.
3. Do the targets for revenue and expenditure appear to be realistic?
Above, we indicated that sometime targets are not realistic. Assessing how realistic targets are is not always easy for a lay person. However, there are some clues that can be used. First, if there is data on revenue or expenditure growth over time, one can get a sense of how much these things tend to grow from year to year. If revenue tends to grow by 10% per year, a target of 2% or 20% is likely unrealistic. In the absence of data, one must try to use common sense. In most cases, revenue and expenditure growth of between 5-15% is what might be considered normal. In some circumstances, those figures might be high or low. It is hard for any government to sustain figures that are much higher than that; for example, revenue growth might be 25% in a given year, but it is unlikely to be 25% every year. Nevertheless, actual growth will vary based on economic growth, changes in tax policy and other factors and the 5-15% range should only be used in the absence of other data.
Second, if target revenue or expenditure growth for a particular source, ministry or program is very high or low compared with others, we might ask questions about this. So, for example, if revenue in general is expected to grow by 10% but property rates are expected to grow by 30%, we should ask what the basis is for this level of optimism.
Let’s look at the revenue growth of local revenues as this source of revenue helps us gauge the performance of the county itself. The county was able to collect 87% of the targeted revenue. (Paragraph 55, page 17). The target was 60.4 million and the actual collection was Ksh52.4 million. To think about a target, it is useful to compare it to the actual from the previous year. So, the target of Ksh 60.4 million was against actual collection in the quarter in 2014/15 of Ksh45.3 million. That is expected growth of 33%. That is actually quite ambitious. In the event, revenue grew by less than half that amount (15%).
It is also important to look at annual revenue growth over time to assess what is realistic. If we look at growth between 2013/14 and 2014/15, the only data the county would have had at the time of preparing the 2015/16 budget, the growth rate was just over 64%. Obviously, this is not sustainable, but it might have led to overly ambitious targets for 2015/16.
There are no expenditure targets in the report, so we cannot assess these.
4. Is it possible to identify specific sources of revenue that are performing well or poorly and why?
The last question implied that the sources of revenue are broken down so that we can see how individual sources are performing. This is good practice. At a minimum, we would want to see all major sources. Where possible, we would
6 want to see all sources. Performance for each source should also be provided against target and previous year for the same quarter.
Beyond the breakdown, we would want to have narrative explanations for particularly good and particularly poor performance. This should help us to understand why performance is below or above what was expected. For example, if performance is low due to failure to implement certain policies, lack of staff, economic changes, etc., that should be explained.
The report breaks down information relating to revenue indicating the performance of both the national (equitable share and conditional grants) transfers and local revenues. From the chart on page 4 (and table 6 on page 18), we see that there has been a decrease in the equitable share received in Q2 of 2015/16 compared to the same quarter in 2014/15. The local revenues, free maternity grant and RMFL have increased in the Q2 as compared to the previous year.
Performance for specific sources of local revenue can be seen from Table 11 (page 18), which provides the local revenue per source comparing the actual collection in the period of review (Q2 2015/16) with the same quarter in FY 2014/15. The revenue sources Koibatek ATC, single business permit and produce & other cess recorded the highest percentage increase (119%, 76 and 75% respectively) while Marigat AMS was the worst performing local revenue source, with a percentage decrease of 200% (this percentage is wrongly calculated). Some explanations are given for the improvements, such as increased game park revenue collection and Koibatek ATC, which are due to improvement of security & road networks and increased funding (though not clear what this means exactly) respectively (paragraph 56). Notably, the game park fees revenue decreased and as such the explanation given is contradictory. There is, however, no explanation for the sharp fall in the collection in other local revenues.
5. Is it possible to identify specific ministries/departments and programs that are performing well or poorly and why?
Just as for revenue, we expect to see a breakdown to at least the ministry level, and ideally the program level in terms of expenditure against target and compared to the previous year. We also expect a narrative explaining good and poor performance. For example: why is the Ministry of Health performing poorly in terms of spending its budget for medicines? Is this related to supply chain problems that require the county to rethink suppliers?
The report provides departmental budget analysis. For example, for the health services department, the half year absorption rate for both development and recurrent expenditure is given at 12% and 49% respectively. While the absorption rate for the development expenditure seems low, the actual expenditure for the department has slightly increased from the previous year’s (2014/15) expenditure of 40M to 49M in the quarter under review (Q2, 2015/16). There is, however, no explanation as to why there is a very low absorption rate in development expenditure. There is also no overall assessment of budget performance indicating whether we are on track and what programs or projects were delayed by the low absorption. In the section on non-financial indicators, there is no indication of whether these programs have been affected by slow budget implementation, for example.
7
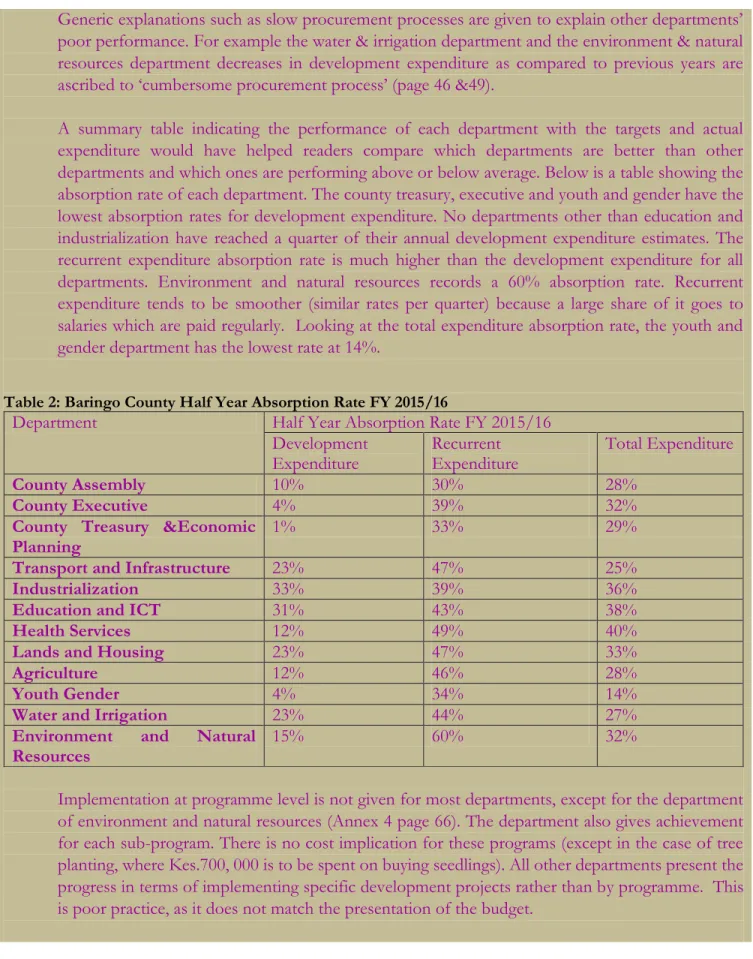
Generic explanations such as slow procurement processes are given to explain other departments’ poor performance. For example the water & irrigation department and the environment & natural resources department decreases in development expenditure as compared to previous years are ascribed to ‘cumbersome procurement process’ (page 46 &49).
A summary table indicating the performance of each department with the targets and actual expenditure would have helped readers compare which departments are better than other departments and which ones are performing above or below average. Below is a table showing the absorption rate of each department. The county treasury, executive and youth and gender have the lowest absorption rates for development expenditure. No departments other than education and industrialization have reached a quarter of their annual development expenditure estimates. The recurrent expenditure absorption rate is much higher than the development expenditure for all departments. Environment and natural resources records a 60% absorption rate. Recurrent expenditure tends to be smoother (similar rates per quarter) because a large share of it goes to salaries which are paid regularly. Looking at the total expenditure absorption rate, the youth and gender department has the lowest rate at 14%.
Table 2: Baringo County Half Year Absorption Rate FY 2015/16
Department Half Year Absorption Rate FY 2015/16
Development
Expenditure Recurrent Expenditure Total Expenditure
County Assembly 10% 30% 28%
County Executive 4% 39% 32%
County Treasury &Economic
Planning 1% 33% 29%
Transport and Infrastructure 23% 47% 25%
Industrialization 33% 39% 36%
Education and ICT 31% 43% 38%
Health Services 12% 49% 40%
Lands and Housing 23% 47% 33%
Agriculture 12% 46% 28%
Youth Gender 4% 34% 14%
Water and Irrigation 23% 44% 27%
Environment and Natural
Resources
15% 60% 32%
Implementation at programme level is not given for most departments, except for the department of environment and natural resources (Annex 4 page 66). The department also gives achievement for each sub-program. There is no cost implication for these programs (except in the case of tree planting, where Kes.700, 000 is to be spent on buying seedlings). All other departments present the progress in terms of implementing specific development projects rather than by programme. This is poor practice, as it does not match the presentation of the budget.
8 6. Does the report provide information on non-financial targets and performance by
ministry/department?
In addition to financial performance data, we also expect to see some data on indicators and targets for non-financial performance. These should be the same as, or closely related to, the indicators and targets in the program based budget approved at the start of the year. Not all indicators can be measured quarterly, but those that can be should be reported on. This would include information that allows us to link financial performance (e.g., 20% of the budget spent) to non-financial performance (20% of vaccinations delivered).
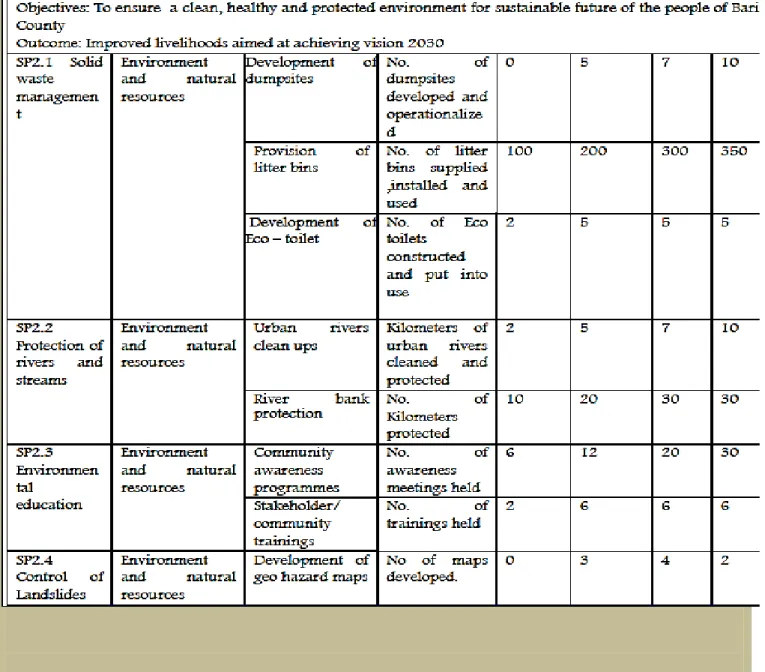
The report gives some non-financial information indicating the performance of departments. For example, under the health services department the milestones achieved are given from page 27. The department undertook more outreach services in the aggregate in Q2 than they did in Q1. The report indicates that while there was an increase in these outreach services in the aggregate across the county, there were fewer in Baringo North, East Pokot and Mogotio sub-counties than in the previous quarter. This might be due to good performance in Q1 requiring less outreach in Q2, but it is not clear from the report. This level of detail is good as it gives not only a true picture of the county’s performance but also informs its readers of performance of the department in specific county sub-units. However, more narrative is needed to understand how we should interpret the data. Another example from the county treasury department is the target for public awareness meetings per sub-county. The department recorded a 100% achievement for Q2 holding the intended 12 public awareness meetings. They also recorded a 200% achievement on collaborations with CSOs by holding two workshops as opposed to one workshop as planned (page 62). Annex 1-8provides an update on indicators and targets for each department. Some of the annual targets and indicators match those in the budget proposal for the FY 2015/16
9 Figure 1: Snippet showing the targets and indicator in the Baringo Budget proposal 2015/16 (Department of Environment and Natural Resources)
Figure 2: Snippet showing the targets and indicator in the Baringo Second Quarter Implementation Report FY 2015/16(Department of Environment and Natural Resources)
10 7. Does the report provide proposals for how to rectify challenges in implementation of either revenue
or expenditure?
Beyond simply identifying challenges in implementation, the report should provide proposals for improving performance. For example, if one of the challenges in implementation is lack of adequate staff with procurement knowledge, then a description of a staff recruitment plan for personnel with the requisite skills could be provided with timelines, etc.
The report gives the challenges and solutions for some departments, though not at the budget implementation level. Many examples relate to non-financial challenges (though these may have financial implications). For example, for the agriculture department one of the challenges identified is that pasture production procurement has been met by inadequate supply or availability of varieties of high range seed from within the county. The solution given is to scout for seeds from other counties from reputable institutions(page 39).The health services department highlights numerous department weakness and challenges but omits to give any recommendations or solutions to address these challenges(page 30).
11
FURTHER READINGS
i. IBP Kenya, “Guide to Reading Office of the Controller of Budget’s County Reports,” Companion Spreadsheet for Reading Office of the Controller of Budget’s County Reports, and Training
Exercises: Reading the COB County Report available at:
http://www.internationalbudget.org/budget-work-by-country/ibps-work-in- countries/kenya/understanding-county-budgets/reading-office-of-the-controller-of-budgets-county-reports/
ii. Open Budget Survey Guide and Questionnaire (Question 68-96) available at:
http://www.internationalbudget.org/publications/obs-2015-questionnaire-and-guidelines-english/
iii. IBP Kenya, “Guide to Reading Office of the Controller of Budget’s County Reports” (February 2015) available at: http://www.internationalbudget.org/wp-content/uploads/Guide-to-Reading-OCOB-Country-Reports.pdf