Predictive Validity of Saudi Admission Criteria
for Freshmen Students’ English Performance:
Experience of King Saud Bin Abdulaziz
University for Health Sciences
Abdulaziz Althewini
King Saud bin Abdulaziz University for Health Sciences, Kingdom of Saudi Arabia; King Abdullah International Medical Research Center, Kingdom of Saudi Arabia
Abdulmohsen Alkushi
King Saud bin Abdulaziz University for Health Sciences, Kingdom of Saudi Arabia; King Abdullah International Medical Research Center, Kingdom of Saudi Arabia
Abstract—This study examines the relationship and correlation between initial admission criteria and English performance of first year students at King Saud bin Abdulaziz University for Health Sciences. The performance of 1,595 English language students was compared to the initial academic admission criteria to determine if a correlation exists between academic achievement pre and post admission. Admission criteria include high school grades, General Aptitude Test score (GAT), and Scholastic Achievement Admission Test scores (SAAT). Deep statistical analyses, including independent t tests and multiple linear regression reveal a correlation between pre and post admission performance. For this student population, GAT score was more predictive of English performance than SAAT scores, while the high school grade had no significant relationship to performance on the course. Furthermore, GAT had a higher predictive weight of 7% when compared individually with other admission criteria. However, in a combined model, all of the admission tests cumulatively predicted 17.3% of English performance. Such power is relatively low and requires additional variables to accurately predict a student’s final English score. This study provides unique analyses of performance within the Saudi higher education system and provides insight for those teaching or studying English as a second language. This study is therefore relevant for educators in universities using English for the instruction of non-English, native students and raises questions as to the value of current admission criteria.
Index Terms—standardized tests, English competence, predictive validity, medical education, college
admission
I. INTRODUCTION
Freshmen students are required to fulfil admission criteria in order to be considered for admission to King Saud bin Abdulaziz University for Health Sciences (KSAUHS). These criteria, as for other Saudi universities, include the attainment of High School Grades and the taking of the General Aptitude Test (GAT) and the Scholastic Achievement Admission Test (SAAT), to calculate the “corrected percentage of admission.” The GAT focuses more on students’ analytical reasoning skills, irrespective of the specific major they wish to enroll in, while the SAAT focuses on students’ understanding of basic science subjects learned throughout their high school years.
Students’ high school grades, GAT, and SAAT are calculated together in the following formula to produce the corrected percentage, a score which often advises University admission. The score is calculated as follows: (high school grade × 0.30) + (GAT × 0.30) + (SAAT × 0.40). Students receive their corrected percentage and must then compete with other applicants for available spaces in the university.
Once a student attains the required corrected percentage score and meets the seats requirement of the university, the student is accepted. Health sciences courses in all Saudi universities use English as a medium language to teach the subject material in. Therefore, students start their academic study with an intensive focus on acquiring the English language and mastering essential skills (e.g. grammar, the learning of specific scientific terminology). The KSAUHS English Program is intensive, spanning over the 1st preparatory year of the university and then further extending into an additional semester in the 2nd year.
Although, it must be stated that there are existing Saudi-based studies which investigate the overall relationship between admission criteria and student college performance (Albishiri et al., 2012; Murshid, 2013; Alwan et al., 2012; Al- Rukban et al.,2010).
This study aims to contribute towards the wider discussion of the relevance of current admission criteria for medical colleges and to evaluate whether current procedures are a fair and accurate prediction of future performance. This topic is divisive amongst researchers in the field, with much disagreement surrounding the best predictors of performance (Schwartz 2004; Roberts and Prideaux 2010; McManus et al. 2011; Prideaux et al. 2011).
Currently, medical colleges use different tools to assess students’ capability prior to admission. Other research highlights that admission criteria for medical school currently focuses on cognitive achievements and other personality qualities in prospective students (Evans and Wen, 2007; McManus et al. 2003; Groves et al. 2007; Albanese et al., 2003; Benbassat et al., 2007). However, students’ high school grades are seen, in some contexts, as a more predictive and reliable tool (Ferguson et al, 2002; McManus et al, 2003; Coates, 2008; Wright and Bradley, 2010; Wilkinson et al., 2008).
Universities usually prefer to combine these admission criteria and differ in terms of which components are included, or in the weighted numerical value assigned to each component (Parry et al. 2006; Julian, 2005; Peskun et al., 2007). When these components are calculated together, they are then used to predict a students’ performance in college (Ferguson et al., 2003).
Based on this existing research, this study will attempt to understand the college admission process in Saudi Arabia and analyze the relationship between the admission criteria and students’ English performance.
II. OVERVIEW
Before elaborating on research questions and methods, it is important to provide an overview of the English Program in KSAUHS. The English Language Program aims to develop students’ general English skills. Students start at the lower-intermediate level and progress through to the advanced level in the 2nd year. The English Language Program provides students with daily practice in academic reading, vocabulary, oral communication, grammatical structures and writing.
The study focuses on the students’ performance in their first year of English courses. These courses include two courses in reading and vocabulary, two courses in grammar, and two courses in oral communication and writing, distributed over two semesters and delivered daily.
III. RESEARCH QUESTIONS The research questions for this study are:
1. Do admission criteria of GAT, SAAT, high school grade, and corrected percentage predict students’ English performance in their first year of college?
2. Are there any associations or differences between the admission criteria and English performance?
IV. METHOD
There are four samples in the study. Two samples collected in 2015 and two from 2016, of both males and females in KSAUHS. They completed their first year at the university and completed all of the English courses. Sample 1 (2015) consists of 264 female students, sample 2 (2016) 357 female students. Sample 3 (2015) consists of 481 male students, sample 4 (2016) consists of 493 male students. The total number of all participants is 1,595 students. Their English total score was extracted and used in this study. Descriptive statistics and independent samples t tests were used. Multiple linear regression was used for predictive validity.
V. RESULTS
A. Sample 1
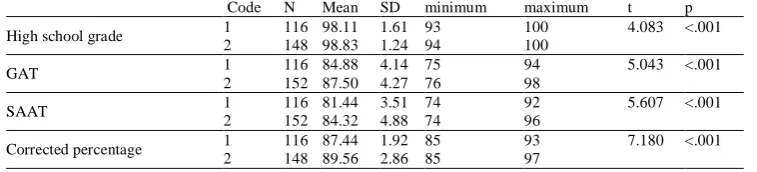
Table 1 provides descriptive statistics of high school grades, GAT, SAAT and corrected percentage in order to calculate an English total score. These total scores were categorized into two categories ranging from 0.00 – 0.99 coded as 1 (e.g. the lower range) and a second category of 1.001 – 1.999 coded as 2 (e.g. the upper range). Therefore, all students have a score which falls between 0 – 2.
Independent samples t test results indicated a significant difference in mean high school grade (t (262) = 4.083, p = <.001), GAT (t (266) = 5.043, p = <.001), and SAAT (t (266) = 5.607, p = <.001) between the two total score categories of English classes. Scores in the range of 1.001 – 2.000 reported significantly higher mean grades than those between 0.000 – 0.999.
TABLE 1
COMPARISON OF HIGH SCHOOL GRADES,GAT,SAATAND CORRECTED PERCENTAGE ACROSS ENGLISH TOTAL SCORE. Code N Mean SD minimum maximum t p
High school grade 1 116 98.11 1.61 93 100 4.083 <.001 2 148 98.83 1.24 94 100
GAT 1 116 84.88 4.14 75 94 5.043 <.001 2 152 87.50 4.27 76 98
SAAT 1 116 81.44 3.51 74 92 5.607 <.001 2 152 84.32 4.88 74 96
Corrected percentage 1 116 87.44 1.92 85 93 7.180 <.001 2 148 89.56 2.86 85 97
B. Sample 2
As shown in Table 2, there was a significant difference in mean high school grades (t (365) = 3.510, p = <.001), GAT (t (354) = 5.780, p = <.001), SAAT (t (354) = 2.887, p = .004) between two total score categories of English classes. Students’ total score in the upper range reported significantly higher mean grade than those in the lower range.
A further significant difference in the mean corrected percentages between two total score categories of English classes was also reported (t (365) = 5.228, p = <.001). Students’ total score in the range 1.001 – 2.000 reported significantly higher mean corrected percentages than those in the lower range.
TABLE 2
COMPARISON OF HIGH SCHOOL GRADES,GAT,SAAT AND CORRECTED PERCENTAGE ACROSS ENGLISH TOTAL SCORE
Code N Mean SD t p
High school grades 1 160 98.11 1.783 3.510 <.001 2 197 98.70 1.417
GAT 1 2 159 197 84.47 87.03 4.130 4.174 5.780 <.001
SAAT 1 159 87.64 3.610 2.887 .004
2 197 88.93 4.621
Corrected percentage 1 2 160 207 89.79 91.17 1.981 2.834 5.228 <.001
C. Sample 3
As indicated in Table 3, no significant difference was observed in the mean grades between two total score categories of English total score (t (479) = 1.773, p = .077).
Nevertheless, there is a significant difference in mean GAT (t (477) = 5.420, p = <.001), SAAT (t (477) = 3.552, p = <.001), and the corrected percentage scores (t (479) = 4.464, p = <.001) between two total score categories of English classes. Students’ total score in the upper range reported significantly higher mean GAT than those in the range 0.000 – 0.999.
TABLE 3
COMPARISON OF HIGH SCHOOL GRADE,GAT,SAATAND CORRECTED PERCENTAGE ACROSS ENGLISH TOTAL SCORE
Code N Mean SD t p
High School Grades 1.00 58 96.52 2.722 1.773 .077 2.00 423 97.17 2.596
GAT 1.00 58 81.24 4.740 5.420 <.001
2.00 421 85.48 5.681
SAAT 1.00 58 74.017 4.2529 3.552 <.001 2.00 421 77.409 7.0932
Corrected percentage 1.00 58 83.02 2.585 4.464 <.001 2.00 423 85.72 4.506
D. Sample 4
Table 4 illustrates the significant difference in mean high school grades (t (491) = 2.398, p = <.001), GAT (t (496) = 4.846, p = <.001), SAAT (t (496) = 4.423, p = <.001) between two total score categories of English classes. Students’ total score in the upper range had significantly higher mean grade than those in the lower range.
TABLE 4
COMPARISON OF HIGH SCHOOL GRADE,GAT,SAATAND CORRECTED PERCENTAGE ACROSS ENGLISH TOTAL SCORE
Code N Mean SD t p
High School Grades 1.00 66 96.03 2.75 2.398 <.001 2.00 427 96.86 2.58
GAT 1.00 66 81.65 5.02 4.846 <.001
2.00 432 85.13 5.49
SAAT 1.00 66 79.20 4.87 4.423 <.001 2.00 432 83.12 6.95
Corrected percentage 1.00 66 84.97 2.74 5.292 <.001 2.00 422 87.85 4.29
E. Combined Samples
As shown in Table 5, no significant differences in the mean high school grade between the two total score categories of English were observed (t (1593) = 0.145, p = .885).
However, there are significant differences between the mean GAT (t (1599) = 7.448, p = <.001) , SAAT (t (1599) = 0.565, p = .572), and the corrected percentage (t (1598) = 2.270, p = .023) between the two groups of students. The upper range students had significantly higher mean GAT, SAAT, and corrected percentage scores compared to their lower range peers.
TABLE 5
COMPARISON OF HIGH SCHOOL GRADES,GAT,SAATAND CORRECTED PERCENTAGE ACROSS ENGLISH CLASSES TOTAL SCORE
Code N Mean SD t p
High School grades 1.00 400 97.53 2.25 0.145 .885 2.00 1195 97.51 2.43
GAT 1.00 399 83.65 4.61 7.448 <.001
2.00 1202 85.86 5.30
SAAT 1.00 399 82.46 6.19 0.565 .572
2.00 1202 82.22 7.60
Corrected percentage 1.00 400 87.33 3.30 2.270 .023 2.00 1200 87.88 4.46
F. Predictive Validity of Admission Criteria
Multiple linear regression for the combined sample was performed in order to predict the total English score. The independent variables included SAAT, GAT and high school grades, while removing the corrected percentage, since it is actually a combination of all of these variables. The model could explain 17.3% of the variance (F(3, 1599)=111.599,
p< .001). Table 6 shows regression coefficients for each independent predictor:
TABLE 6
SIMPLE MULTIVARIATE REGRESSION. Coefficients a
Model Unstandardized Coefficients Standardized Coefficients t Sig B Std. Error Beta
(Constant) -.586 .147 -3.996 .000
High School Grades .001 .001 .017 .764 .445
GAT .015 .001 .287 11.279 .000
SAAT .007 .001 .196 7.666 .000
a. Dependent Variable: ENGL_total score
Preliminary regression analyses show that high school grade has no significant coefficient (Table 6), so, in order to produce valid predictors, a stepwise algorithm was used. Stepwise regression automatically chooses predictive variables that contribute the most to the dependent variable.
TABLE 7
MODEL SUMMARY FOR STEPWISE MULTIVARIATE REGRESSION. Model Summary
Model R R Square Adjusted R Square Std. Error of the Estimate
1 .377 a .142 .141 .25240
2 .416 b .173 .172 .24788
TABLE 8
STEPWISE MULTIVARIATE REGRESSION COEFFICIENTS. Coefficients a
Model Unstandardized Coefficients
Standardized
Coefficients t Sig.
B Std. Error Beta
1 (Constant) -.295 .103 -2.854 .004
GAT .020 .001 .377 16.266 .000
2 (Constant) -.508 .105 -4.837 .000
GAT .015 .001 .288 11.313 .000
SAAT .007 .001 .197 7.744 .000
a. Dependent Variable: ENGL_total score
This stepwise regression created two models – The first with GAT only and the second with GAT and SAAT. ANOVA confirmed the validity of both models with 100% significance. The first model explains only 14.2% percent of the English total score variance whilst the second model explains 17.3%, matching the preliminary model results.
According to Table 9, R-square values or explained variances for English total score are 14.1% for GAT and 10.6% for SAAT.
TABLE 9
REGRESSION COEFFICIENTS AND PERCENTAGE OF VARIANCE FOR EACH INDEPENDENT PREDICTOR
Model Unstandardized Coefficients
Standardized
Coefficients % of variances B Std. Error Beta
Stepwise with maximum R (Constant) -.508 .105
GAT .015 .001 .288 14.1 %
SAAT .007 .001 .197 10.6 %
a. Dependent Variable: ENGL_total score
Based on this, the regression equation for English total score = - 0.508 + 0.015 * GAT + 0.007 * SAAT. Therefore, General Aptitude Test (GAT) score has the highest regression coefficient and has the highest influence on English total score.
VI. DISCUSSION
Firstly, this study illustrates differences between the samples of the same gender. In the female samples, sample 1 shows that corrected percentage has the highest association with English total score than other admission criteria since its t value is 7.180, and its p = <.001. However for sample 2, the corrected percentage (t (365) = 5.228, p = <.001) and GAT (t (354) = 5.780, p = <.001) are almost equal, while the SAAT has the lowest value.
In the male samples, sample 3 shows that GAT has the highest association with English total score of the admission criteria, witha t value of 5.420 and p = <.001. Sample 4 shows that corrected percentage is the highest (t (486) = 5.292, p = <.001).
More interestingly, when all the samples are combined, GAT has more predictive and associative weight than the other variables (t (1599) = 7.448, p = <.001). Second to GAT was the corrected percentage (t (1598) = 2.270, p = .023). Clearly, the difference between GAT and corrected percentage in terms of their strength for prediction and association with English total score is high.
Such a gap illustrates that GAT could predict English performance with a high probability. The GAT codes for both categories (83.65; 85.86), as presented in Table 5, could be used as a predictive tool for predicting future performance at an English program such as KSAUHS. It could be interpreted that a student with a GAT score of 83 or below would most likely have a low total score in English at the end of the KSAUHS modules, while a student with a score of 86 or more could have a higher total score.
Additionally, as GAT and SAAT scores have a high predictive validity and together have a predictive weight of 17.3% . GAT is the best predictor since it has the most variance (14.1%) whereas SAAT has equal variance of 10.6 %. It is possible to use the regression model presented above for calculating and predicting English total score. However, such a prediction is limited to 17.3 % of the total score. In other words, this method could not to a large extent predict English total score since its variance is too low. Such a model, therefore, requires additional critical variables in order to have a stronger prediction validity.
Other studies illustrate how predictive GAT is for academic performance in health sciences’ colleges. Alwan et al. (2012) researched 87 health science students at KSAUHS and found GAT is positively correlated with their GPA over a three-year period. However, according to Alwan et al. (2012), GAT was not the best predictor of students’ GPA among other admission criteria. Albishri et al. (2012), in his study on 727 medical students from three different medical schools, found that indeed there is a positive correlation between GAT and cumulative GPA at the sixth year of medical college. Similarly to Alwan et al. (2012), GAT was not the best predictor in this case.
first year of university. This study has a higher number of participants and highlights the correlation between GAT and first-year English performance. It is noted in this study, that for even a small number of students, GAT still has sufficient weight in predicting English performance.
There are few reasons why GAT is a better predictor of English performance. Firstly, GAT primarily focuses on linguistic and mathematical skills. It also assesses higher cognitive skills by asking students to confirm their deep understanding of language, mostly Arabic, through reading texts and solving mathematical problems. Thus, it is obvious why GAT has some connection with students’ English performance since it assess linguistic level as well as their higher thinking ability, both of which are critical for learning a second language.
VII. CONCLUSION
This study explores the relationship between admission criteria and first-year English performance at University. Deep statistical analyses on a large number of participants revealedthat GAT is more predictive of English performance than SAAT, while high school grades have no significant relationship to English performance. Predictive validity analyses show that a combination of GAT with SAAT has predictive power of 17.3 %. Such power is relatively low and requires the addition of further variables in order to predict English performance. This study, as an outcome, is useful for policymakers in Saudi universities and encourages educators to rethink the value of admission criteria and how they are used to assess a student’s English ability. Educators should consider adding an English language proficiency test to the admission criteria in order to better predict how students progress in their English course and to track their progress. This study provides information which could save money, time and energy by streamlining and re-evaluating admissions criteria and presents methods to analyse the effectiveness of current and future admissions criteria.
REFERENCES
[1] Albanese, M. A., Snow, M. H., Skochelak, S. E., Huggett, K. N., & Farrell, P. M. (2003). Assessing personal qualities in medical school admissions. Academic Medicine, 78(3), 313-321.
[2] Albishri, J. A., Aly, S. M., & Alnemary, Y. (2012). Admission criteria to Saudi medical schools. Which is the best predictor for successful achievement?. Saudi medical journal, 33(11), 1222-1226.
[3] Al Alwan, I., Al Kushi, M., Tamim, H., Magzoub, M., & Elzubeir, M. (2012). Health sciences and medical college pre admission criteria and prediction of in-course academic performance: a longitudinal cohort study. Advances in Health Sciences
Education, 18(3), 427-438.
[4] Al-Rukban, M. O., Munshi, F. M., Abdulghani, H. M., & Al-Hoqail, I. (2010). The ability of the pre-admission criteria to predict performance in a Saudi medical school. Saudi medical journal, 31(5), 560-564.
[5] Benbassat, J., & Baumal, R. (2007). Uncertainties in the selection of applicants for medical school. Advances in Health
Sciences Education, 12(4), 509-521.
[6] Coates, H. (2008). Establishing the criterion validity of the graduate medical school admissions test (GAMSAT). Medical
education, 42(10), 999-1006.
[7] Evans P & Wen F. (2007) Does the medical college admission test predict global academic performance in osteopathic medical school? Journal of American Osteopathic Association, 4(107), 157–162.
[8] Ferguson, E., McManus, I. C., James, D., O'Hehir, F., & Sanders, A. (2003). Pilot study of the roles of personality, references, and personal statements in relation to performance over the five years of a medical degree. Bmj, 326(7386), 429-432.
[9] Ferguson, E., James, D., & Madeley, L. (2002). Factors associated with success in medical school: systematic review of the literature. Bmj, 324(7343), 952-957.
[10] Groves M, Gordon J, & Ryan G. (2007). Entry tests for graduate medical programmes: Is it time tore-think? Medical Journal of
Australia, 186(3), 120–123.
[11] Julian, E. R. (2005). Validity of the Medical College Admission Test for predicting medical school performance. Academic
Medicine, 80(10), 910-917.
[12] McManus, I. C., Ferguson, E., Wakeford, R., Powis, D., & James, D. (2011). Predictive validity of the Biomedical Admissions Test: an evaluation and case study. Medical teacher, 33(1), 53-57.
[13] McManus, I. C., Smithers, E., Partridge, P., Keeling, A., & Fleming, P. R. (2003). A levels and intelligence as predictors of medical careers in UK doctors: 20 year prospective study. Bmj, 327(7407), 139-142.
[14] Murshid, K. R. (2013). The predictive value of individual admission criteria on academic performance in a Saudi medical college. Journal of Taibah University Medical Sciences, 8(1), 18-23.
[15] Parry, J., Mathers, J., Stevens, A., Parsons, A., Lilford, R., Spurgeon, P., & Thomas, H. (2006). Admissions processes for five year medical courses at English schools. Bmj, 332(7548), 1005-1009.
[16] Peskun, C., Detsky, A., & Shandling, M. (2007). Effectiveness of medical school admissions criteria in predicting residency ranking four years later. Medical education, 41(1), 57-64.
[17] Prideaux, D., Roberts, C., Eva, K., Centeno, A., Mccrorie, P., Mcmanus, C., ... & Wilkinson, D. (2011). Assessment for selection for the health care professions and specialty training: consensus statement and recommendations from the Ottawa 2010 Conference. Medical teacher, 33(3), 215-223.
[18] Roberts, C., & Prideaux, D. (2010). Selection for medical schools: re‐imaging as an international discourse. Medical
education, 44(11), 1054-1056.
[19] Schwartz, S. (2004). Fair admissions to higher education: recommendations for good practice.London: Higher Education Steering Group.
education, 44(11), 1069-1076.
[21] Wilkinson, D., Zhang, J., Byrne, G. J., Luke, H., Ozolins, I. Z., Parker, M. H., & Peterson, R. F. (2008). Medical school selection criteria and the prediction of academic performance. Medical journal of Australia, 189(4), 235.
Abdulaziz Althewini (PhD): has done his master and PhD degree at Penn State University. His work was on teacher beliefs and attitude toward reading instruction in a second language. In addition, he was interested in teacher professional development and how they improve their learning and professional position. Currently, he is an assistant professor at King Saud bin Abdulaziz Uni versity for Health Sciences. He teaches regular English education courses as well as creates teacher professional development programs.