ISSN: 2501 - 1235 ISSN-L: 2501 - 1235 Available on-line at: www.oapub.org/edu
doi: 10.5281/zenodo.3786168 Volume 6 │ Issue 4 │ 2020
ASSESSMENT THE STATUS OF
PHYSICAL EDUCATION AT HCMC UNIVERSITY OF
TECHNOLOGY AND EDUCATION, VIETNAM
Nguyen Duc Thanhi PhD, Physical and Defense Education Center, Ho Chi Minh University of Technology and Education, Vietnam
Abstract:
Overall research on the current situation such as: Physical education subject program; Documents and textbooks for teaching and learning; Teaching staff; Methods for teaching; Testing and evaluation; Facilities, grounds, learning conditions; Extracurricular Activities; The concern of the university leadership towards physical education; Collaboration between physical education faculty members and departments; Satisfaction level of both lecturers and students, etc. to discover the limitations and propose effective improvement solutions.
Keywords: programs, facilities, lecturers, physical education, satisfaction, testing, extracurricular, coordination, materials
1. Introduction
Currently, the explosive development of the 4.0 science and technology revolution requires universities to constantly innovate and adapt educational thinking to survive. In Vietnam, the quality of educational training, especially at the university level, has long been a pressing issue that is deeply concerned by society not only by educational experts but also by students learning in universities.
Physical education (PE) is a subject of an educational program aimed at providing basic motor knowledge and skills for learners through exercises and active games to contribute to the achievement of a comprehensive educational goal for students.
Ho Chi Minh City University of Education and Technology is a multi-disciplinary university in the direction of career - application, in which some fields of study are oriented to research and development. The university has a reputation and a long tradition of more than 55 years, an advanced management and training program, and gradually affirms its position in domestic and international education. It is also located
in a favorable geographical location, with enough land to meet the renovation of construction of yards and gymnasiums for physical education and sport activities.
It is these activities that have contributed practically to the training of a comprehensive workforce of virtue, intellect, health and beauty. At the same time, they also have abundant physical strength, solid skills, knowledge and effective application of science and technology to be ready to meet the labor requirements of society. However, the specific effect of physical education at Ho Chi Minh City University of Technical Education by learners and professionals’ evaluation has not been studied so far. For these reasons, it is essential to conduct a research on the actual situation of physical education work at HCMC University of Education and Technology. The research results will be the basis for considering to better adjust and improve this activity for the benefit of learners and contribute to improving the quality of education here.
2. Methods
2.1. Research objects
The research objects consist of 20 staffs, lecturers of the Physical and Defense Education Center and 320 male and female students with normal physical health participating in physical education in HCMC University of Technology and Education.
2.2. Process
The study was carried out from February, 2019 to March, 2020 at the HCMC University of Technology and Education.
2.3. Measuring tools
Common methods used in the process of researching include synthesizing and analyzing relevant document methods; sociological investigation method; statistical and calculation method. Evaluation tools include:
a. Likert scale - 5 levels
Interviewing two objects (students and lecturers) with 2 questionnaires based on Likert scale - 5 levels: Completely agree (5 points); Agree (4 points); Neutral (3 points); Disagree (2 points); Strongly disagree (1 point). In particular, the average value = (maximum - minimum) / n = (5 - 1) / 5 = 0.8.
Evaluate average values by range:
Average Meaning
1,00 – 1,80 1,81 – 2,60 2,61 – 3,4 3,41 – 4,2 4,21 – 5,00
Strongly disagree Disagree
b. Reliability measurement using Cronbach’s Alpha coefficient
Cronbach’s Alpha coefficients (Cronbach, 1951) is intended to help eliminate unreliable observed variables (with the coefficient of variation and total variables less than 0.3). In other words, if a measurement variable has a correlation coefficient of total variable (Corrected Item - Total Correlation) ≥ 0.3 then that variable is satisfactory (Source: Nunnally, J. (1978), Psychometric Theory, New York, McGraw-Hill). Cronbach’s Alpha coefficient has a variable value in range [0,1].
Value of Cronbach’s Alpha coefficient:
• from 0.8 to nearly 1: very good measurement scale. • from 0.7 to nearly 0.8: good measurement scale. • from 0.6 or more: qualified measurement scale.
For this research, we accepted Cronbach’s Alpha coefficient ≥ 0.6.
Note that the value of “If Item Deleted” column in Cronbach's Alpha, this column represents Cronbach's Alpha coefficient if the variable type is under consideration. Normally, it will be evaluated with the correlation coefficient of the total Corrected Item - Total Correlation, if the value of “If Item Deleted” is greater than the Cronbach’s Alpha coefficient and Corrected Item - Total Correlation < 0.3 then the type of observed variable is considered to increase the reliability of the scale.
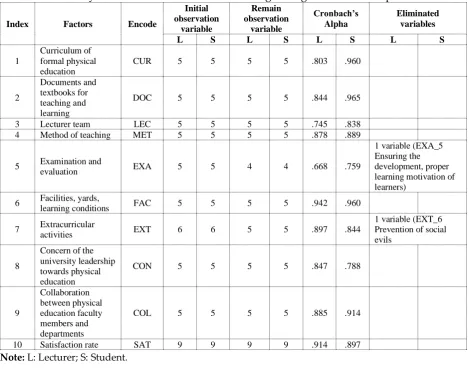
Table 1: Summary of factors and variables after testing through Cronbach’s Alpha coefficients
Index Factors Encode
Initial observation variable Remain observation variable Cronbach’s Alpha Eliminated variables
L S L S L S L S
1
Curriculum of formal physical education
CUR 5 5 5 5 .803 .960
2
Documents and textbooks for teaching and learning
DOC 5 5 5 5 .844 .965
3 Lecturer team LEC 5 5 5 5 .745 .838 4 Method of teaching MET 5 5 5 5 .878 .889
5 Examination and
evaluation EXA 5 5 4 4 .668 .759
1 variable (EXA_5 Ensuring the development, proper learning motivation of learners)
6 Facilities, yards,
learning conditions FAC 5 5 5 5 .942 .960
7 Extracurricular
activities EXT 6 6 5 5 .897 .844
1 variable (EXT_6 Prevention of social evils
8
Concern of the university leadership towards physical education
CON 5 5 5 5 .847 .788
9 Collaboration between physical education faculty members and departments
COL 5 5 5 5 .885 .914
After examining the reliability of observed variables according to the criteria for evaluating physical education by Cronbach’s Alpha coefficient, the results are shown in Table 1.
Through Table 1, after eliminating variables, Cronbach's Alpha coefficient of all scales ≥ 0.6 (from 0.668 to 0.965), the correlation coefficients of the observed variables in the scale are > 0.4, and there are two cases of eliminating observed variables. All accepted observed variables will be used in the next factor analysis.
c. Chi square Indicator - 2
The indicator is used to evaluate qualitative characteristics (identifiers, hierarchies, properties, categories ...) on frequencies that do not require standard probability distribution. In the research, we used this test to compare ideas of observing variables between students and faculty.
d. Accrediting hypothesis of the average value of two independent samples (independent samples t-test)
After surveying the observed variables tested by Cronbach's Alpha coefficient, the thesis in turn analyzes and evaluates the similarities between students and lectures by conducting hypotheses about the average value of 2 independent samples (Independent Samples T-Test).
In Independent-samples T-test, we need to rely on the test of the equality of the two general variances (Levene’s test). The variance describes the uniformity or unevenness (dispersion) of observed data.
• If value Sig. in Levene’s test (F-test) <0.05, the variance of the 2 different integers uses t-test results in Equal variances not assumed.
• If Sig. ≥ 0.05, the variance of the 2 different integers is the same, then use the test results in Equal variances assumed.
• If Sig. of t-test ≤ α (significance level), there is a significant difference in the average of the two integers and vice versa.
3. Results
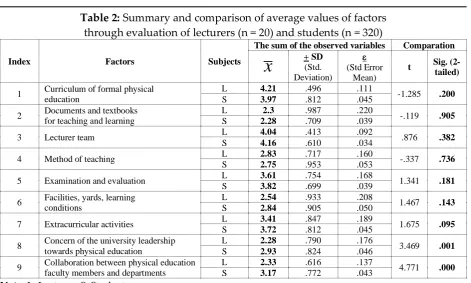
Table 2: Summary and comparison of average values of factors through evaluation of lecturers (n = 20) and students (n = 320)
Index Factors Subjects
The sum of the observed variables Comparation
x
+ SD (Std. Deviation)
(Std Error Mean)
t Sig. (2- tailed)
1 Curriculum of formal physical education
L 4.21 .496 .111
-1.285 .200
S 3.97 .812 .045 2 Documents and textbooks
for teaching and learning
L 2.3 .987 .220
-.119 .905
S 2.28 .709 .039
3 Lecturer team L 4.04 .413 .092 .876 .382
S 4.16 .610 .034
4 Method of teaching L 2.83 .717 .160 -.337 .736
S 2.75 .953 .053
5 Examination and evaluation L 3.61 .754 .168 1.341 .181
S 3.82 .699 .039 6 Facilities, yards, learning
conditions
L 2.54 .933 .208
1.467 .143
S 2.84 .905 .050
7 Extracurricular activities L 3.41 .847 .189 1.675 .095
S 3.72 .812 .045 8 Concern of the university leadership
towards physical education
L 2.28 .790 .176
3.469 .001
S 2.93 .824 .046 9 Collaboration between physical education
faculty members and departments
L 2.33 .616 .137
4.771 .000
S 3.17 .772 .043 Note: L: Lecturer; S: Student
The results also recorded, 4 factors: Curriculum of formal physical education (CUR); Lecturer team (LEC); Examination and evaluation (EXA); Extracurricular activities (EXT) have a value of mean ranging from 3.41 ~ 4.21 (range from Agree to Strongly Agree) and are all higher than the mean values of 5 factors: Documents and textbooks for teaching and learning (DOC); Method of teaching (MET); Examination and evaluation (EXA); Facilities, yards, learning conditions (FAC); Concern of the university leadership towards physical education (CON); Collaboration between physical education faculty members and departments (COL), with a value of only 2.28 ~ 3.17 (in the range from Disagree to Normal). These five factors have not yet been appreciated which means that attention should be paid to improvement measures.
3.2. Satisfaction level for physical education at Ho Chi Minh City University of Education and Technology
Survey of lecturers and students' satisfaction towards physical education conducted through 9 factors, corresponding to 9 comments in the questionnaire. The interview results are presented in Table 3 and Table 1 shows that lecturers and students’ satisfaction rates for physical education are summarized in the following sequence:
SAT8_ Satisfied because of the physical education role is properly cared for by the university (45% and 80%); SAT9_Satisfied with the coordination between physical education lecturers and professional departments (25% and 27.5%).
Thus, it can be seen that the percentage of satisfaction level of the observed factors is much different and quite dispersed. In particular, SAT2, SAT4, SAT6, SAT8 and SAT9 are underestimated by both lecturers and students, so they should be noted for improved solutions.
It is even more obvious when comparing observed variables in the same object of lectures and student. The results showed that the level of “Hesitation” and “Disagreement” was more overwhelming than the level of "Completely agree" and "Agree" in factors of SAT2, SAT4, SAT6, SAT8 and SAT9, clearly shown in the indicators
2
calculated > 2
table (the difference was statistically significant with (P <0.01 ~ 0.001). But in contrast, there were also 4 out of 9 surveyed factors that lecturers and students’ the opinions were approved at very high level; the levels of “Completely Agree” and “Agree” were more than the level of “Hesitation” and “Disagree” (P <0.01 ~ 0.001).
Matching and assessing the corresponding observed variables between lecturers and students found that, except for the variable SAT6_Satisfied for the conditions of facilities, service equipment has Sig = .042> .05 ), the remaining 8 variables belonging to the satisfaction factor of physical education have similar assessments' opinions. This is
clearly shown by the index 2calculated < 2tabletables (the difference is not significant, not statistically significant with Sig = .169 ~ .959> .05).
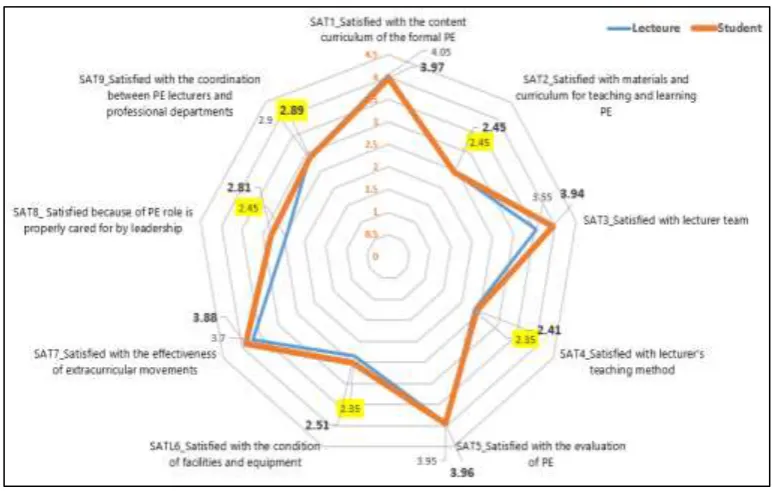
Figure 1: Compare the average value of lecturer and student's satisfaction on PE
that are properly cared for by the leadership (Sig = .049 <.05), the remaining eight factors have no statistically significant difference between lecturer and student's opinions (Sig = .086 - .984> .05). Overall, both lecturers and students appreciate toward 4 factors SAT1, SAT3, SAT5 and SAT7 (
x
= 3.55 ~ 4.05, in the range of "Agreed"), while underestimating 5 remain factors: SAT2 SAT4, SAT6, SAT8, SAT9 (x
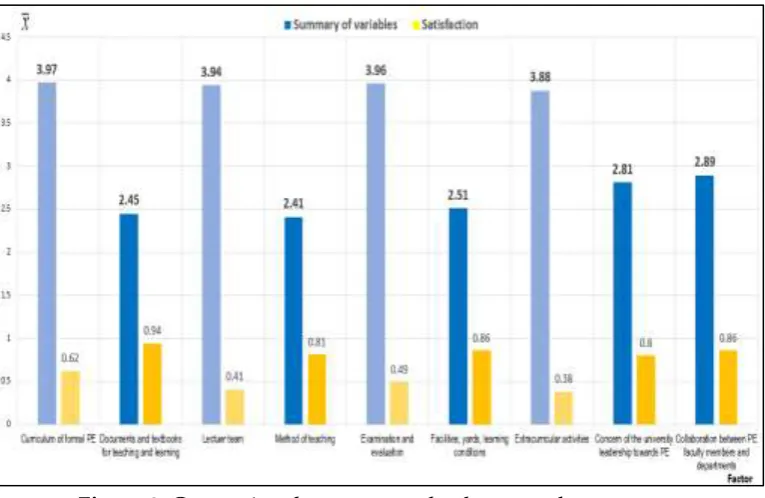
= 2.35 ~ 2.90, in the range of "Disagree" to "Normal"). Again, these five factors have not met the expectations of both learners and teachers and need to be improved.For further analysis, we have synthesized and compared the values of mean of all variables belong to survey factors along with lecturer and student's satisfaction. The results are clearly shown in Figure 2 and Figure 3. Thereby, it shows that the mean of the survey factors and the satisfaction level of 4 factors including PE curriculum, Lecturer team, PE examination and evaluation and Extracurricular movement activities are higher than the 5 remaining factors including: Documents and textbooks for teaching and learning PE, Teaching methods of PE teaching staff, Conditions of material facilities and equipment in service of PE, Attention of the leadership; Collaboration between PE faculty and professional departments.
Table 3: Assessing of lecturer and student's satisfaction level toward physical education activities
Criteria Object N
Levene's Test for Equality
of Variances (Mean)
x
+ SD (Std. Deviation) (Std Error Mean)
t Sig. (2- tailed) F Sig.
SAT1_Satisfied with the content curriculum of the formal PE
Lecturer 20
1.363 .244
4.05 .826 .185
-.445 .656
Student 320 3.97 .757 .042 SAT2_Satisfied with
materials and curriculum for teaching and learning PE
Lecturer 20
.364 .547
2.45 .759 .170
-.020 .984
Student 320 2.45 .679 .038 SAT3_Satisfied with
lecture team
Lecturer 20
1.313 .253 3.55 1.146 .256 1.724 .086
Student 320 3.94 .973 .054 SAT4_Satisfied
with lecturer's teaching method
Lecturer 20
.044 .834
2.35 .745 .167
.347 .729
Student 320 2.41 .741 .041 SAT5_Satisfied with
the evaluation of PE
Lecturer 20
.019 .890 3.95 .887 .198 .059 .953
Student 320 3.96 .923 .052 SATL6_Satisfied with
the condition of facilities and equipment
Lecturer 20
1.072 .301
2.35 .813 .182
1.043 .298
Student 320 2.51 .653 .036 SAT7_Satisfied with the
effectiveness of extracurricular movements
Lecturer 20
.354 .552
3.70 .923 .206
.851 .395
Student 320 3.88 .907 .051 SAT8_ Satisfied because of PE
role is properly cared for by leadership
Lecturer 20
3.047 .082
2.45 .510 .114
1.975 .049
Student 320 2.81 .796 .044 SAT9_Satisfied with the
coordination between PE lecturers and professional departments
Lecturer 20
.140 .709
2.90 .912 .204
-.045 .964
Student 320 2.89 .908 .051
Figure 2: Comparing the average value between the aggregate of the survey factors and lecturer's PE satisfaction (n = 20)
Figure 3: Comparing the average value between the aggregate of the survey factors and student's PE satisfaction (n = 320)
4. Conclusion
Based on the actual survey, combined with comparing of lecturer and student's satisfaction with the factors surrounding PE, our research has discovered factors that have not been appreciated and need to be considered to change. These factors consist of Documents, syllabus for teaching and learning PE; Teaching methods; Conditions of facilities, equipment; The concern of the school leaders for PE work; Collaboration between PE lecturers and professional departments. This is a reliable basis for the research step to find improved solutions later.
References
Alexander W. Astin [Nguyen Hoi Nghia et al. Translated from the original: Assessment
for excellence, American Council on Education, Series on Higher Education, Oryx
Press, 1993]
A.I.Vroeijenstijn [Nguyen Hoi Nghia et al. Translated from the original: Improvement and Accountability: Navigating between Scyla and Charybdis, 1995]
Ali Dursun Aydin (2015). Assessment of Communication Skills of Physical Education and Sport Students in Turkish Universities, Universal Journal of Educational Research 3(11): 943-948, 2015.
Ahmet Sadan Okmen (2017). Evaluation of the physical education and sports curriculum in Turkish schools, Academic Journals Vol. 12(16), pp. 811-816, 23 August, 2017. Chua, C. (2004). Perception of quality in higher education”, AUQA Occasional
Publication.
Curriculum Development Council and The Hong Kong Examinations and Assessment Authority (2014). Physical Education Curriculum and Assessment Guide, recommended for use in schools by the Education Bureau HKSARG.
Damon A., Paul Pedersen, Chad McEvoy (2011). Research Methods and Design in Sport Managment, Human Kinetics.
Kathleen de Marrais (University of Georgia) - Stephen D. Lapan (Northern Arizona University) (2004). Foundations for Research Methods of Inquiry in Education and the
Social Sciences, Lawrence Erlbaum Associates, Publishers, Mahwah, New Jersey
London.
Metzler (2005). Assessing Student Learning in Model-Based Instruction. Instructional models for physical education. Scottsdale, Holcomb Hathaway.
Mussie T. Tessema (2012). Factors Affecting College Students’ Satisfaction with Major Curriculum: Evidence from Nine Years of Data, International Journal of Humanities and Social Science, Vol. 2 No. 2 [Special Issue - January 2012]
Phil Race, Sally Brown and Brenda Smith (2006). 500 Tips on Assessment, 2ND edition, Routledge Falmer, USA.
Rebecca Cartwright, Ken Weiner, and Samantha Streamer-Veneruso (2009). Student
Reter Bramley (1997). Evaluating Training Effectiveness, 2ND edition, the McGraw - Hill Companies, UK.
Robert L. Linn - Norman E. Gronlund (1995). Measurement and Assessment in Teaching, 7TH
edition, Prentice Hall, Inc, Ohio.
SHAPE America - Society of Health and Physical Educators (2015). The Essential Components of Physical Education.
Victor C. X. Wang (2009). Assessing and Evaluating Adult Learning in Career and Technical
Creative Commons licensing terms