DETERMINATION OF TRACE OF HEAVY METALS IN WATER
SAMPLES BY ATOMIC SPECTROMETRY BY
PRECONCENTRATION WITH SOFT HUSK OF PISTACHIO
Mehdi Ghodsbin
[a], Hassan Zavvar Mousavi
[a]*and Aisan Khaligh
[a]Keywords: Preconcentration, Heavy metals, Pistachio husk, FAAS
This study uses solid phase extraction method to measure trace amount of metal ions of Cd2+, Pb2+, Cu2+, Ni2+ and Zn2+ in aqueous samples
by using herbal absorbent called soft husk of Pistachio. To do so, aqueous solution of these metal ions was passed through a column containing adsorbent. Meanwhile, existing metal ions in solution were adsorbed, and then preconcentrated via eluting by nitric acid. Finally, they were measured by Flame Atomic Absorption Spectrometry (FAAS). Effective parameters such as pH, amount of adsorbent, volume and concentration of eluent, velocity of solution and interfering ions were examined Calibration curve related to metal ions: lead, nickel, cadmium, copper and zinc in the range of 30-800, 10-400, 5-90, 10-350 and 5-90 µg L-1 was linear and the limits of detection for
metal ions lead, nickel, cadmium, copper and zinc were respectively: 2.581, 0.988, 0.139, 0.527 and 1.385 µg L-1. The proposed method
was applied to measure metal ions in real sampleswith acceptable accuracy.
Corresponding Authors Tel: +98 231 3366194 Fax: +98 231 3354110
E-Mail: [email protected]
[a] Department of Chemistry, College of Science, Semnan University, Semnan, Iran. Zip Code: 35131-19111
Introduction
Industrial sewerages resulting from different factories are among the main pollution sources of heavy metal.1-4 Due to toxicity and damaging effects of heavy metals, removing their ions is a concern for many of environmental studies.5 Lead is the most common toxic heavy element in the environment.6 Cadmium compounds in mines, galvanizing, paint making are of its polluting sources in environment.7 Over-absorption of cupper in human body causes intense mucus corrosion, extensive capillary, digestion system, and central neural system damages, and lead to depression.8 Over-absorption of zinc makes skin urticarial, vomit, nausea, and anemia.9 Nickel sources include fossil fluids burned in power plants, mines, and refineries.10,11 Due to harming effects of heavy metals, various methods are presented to remove them including chemical sedimentation, reverse osmosis ion exchange, adsorption etc.12-15 One of the most applicable methods is adsorption.16 There is a need for sample preparing methods because direct measurement of heavy metal ions in complex matrices is limited due to low concentrations and matrix disruption,17,18 which extracting method is one of the most basic methods. Specimen values are used for separating and pre-concentrate from the sample blank. Common extracting methods, such as Soxhlet, liquid-liquid extraction (LLE), are usually time consuming and require a large volume of toxic solution.19, 20 It is emphasized on limited use of these solutions because of their destroying effects on environment.21 According to these facts, SPE is a proper and effective technic in which extracting is easy and fast, and is capable of being automate.
It consumes less time and solution than other methods such as LLE.22 The aim of the present paper is to optimize
the various experimentalworking conditions in the processes of preconcentration ofanalytical ions from water samples collected from different locations followed by AAS determinations.
Materials and methods
Preparation of adsorbent
After collecting soft husk pistachio from Damghan City, we eluted it with natural water and then triple-distillated water. Then, we dried it in oven at 100 °C, and next we pulverized it with mill. The powder is used as adsorbent after sieving the powder with mesh-16 sieve. Fig. 1 shows scanning electron microscopy (SEM) images of adsorbent before adsorption.
Chemicals and apparatus
A syringe tube (58 mm × 8 mm i.d.) with a fine bore packed with cotton was used as a preconcentration column. The column loaded with adsorbent was lightly compressed with the flat end of a plastic rod so that its height would be about 18 mm.
Figure 1. scanning electron microscopy (SEM) images of adsorbent before adsorption.
Recommended procedure
Initially, for column conditioning, distilled water was passed through the column. To measure negligible amounts of heavy metal ions of lead, copper, cadmium, zinc, and nickel, an aqueous solution is prepared with volume of 50 mL and concentration of 50 μg L-1 for each ion, containing 5 mL buffer solution to stabilize pH=6. Then, this solution is passed through a column containing 0.3 g of adsorbent, which its bottom is closed by some cotton, by a pump with flow rate of 5 mL min-1. Next, the column is washed by 3 mL of nitric acid of 1.5 molar. Finally, adsorption of considered ions in recovery solution is measured by Atomic Absorption Spectrometer.
Results and Discussion
Effect of solution pH
pH is among effective factors in adsorption process.23 Particularly, pH influences adsorption capacity. Amount of ion adsorption on adsorbent’s surface is affected by adsorbent’s surface charge, which is influenced by pH of solution.24 In this study, pH of metal ions solution is adjusted by Buffer solutions, and effect of pH on adsorption of metal ions is studied in the range of pH=2 to 10. Figure 2 shows that maximum recovery is for pH=6. According to competitiveness between H+ ion and cations, more basic pH leads to more recovery in lower ranges of pH. In other hand, in basic pH range recovery reduces, due to formation of metallic cation compounds, adsorbed not very well on the surface of adsorbent.
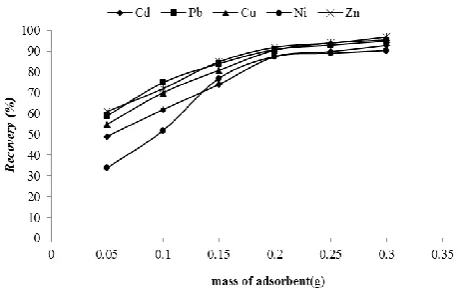
Effect of mass of adsorbent
In order to study the effect of this parameter, six solution samples with volume of 50 mL is prepared, containing 5mL of Buffer to stabilize pH in the optimum state (pH=6). They contain metal ions with concentration of 50 μg L-1. These solutions pass a pump in flow rate of 3.5 mL min-1 through
prepared columns containing different values of adsorbent (0.05 - 0.3g). After eluting it with 3 mL of nitric acid of 1.5 mol L-1 concentration, it is measured by atomic absorption spectrometer. As shown in Figure 3, adsorption and recovery increase by increasing adsorbent amount because of enhancing area of adsorbent surface and adsorption sites. Amount of 0.3g adsorbent is chosen as optimum value.
Figure 2. Effect of solution pH. Experimental conditions: 50 mL of sample containing 50 μg L−1 metal ions, sorbent, 0.2 g, eluent 3
mL of 1.5 mol L−1 HNO3 and flow rate 3.5 mL min-1.
Figure 3. Effect of mass of adsorbent. Experimental conditions: 50 mL of sample containing 50 μg L−1 metal ions, eluent 3 mL of 1.5
mol L−1 HNO3 and flow rate 3.5 mL min-1
Elution
Selecting appropriate eluent is so important, because it should have three features: efficiency, selectivity, and compatibility. To select proper eluent for desorption of metal ions from adsorbent surface, effect of 3 mL of eluents, such as nitric acid, hydrochloric acid, and sulfuric acid with concentration of 1.5 M is examined. Using nitric acid, as an eluent, leads to formation of metal cations nitrates. Nitrate has more solubility than sulfates and chlorides of metal cations, formed because of elution with hydrochloric and nitric acids. As seen in Figure 4 and Table 1, nitric acid has the most recovery extent, and so, this solvent is chosen as proper eluent for next steps.
Table 1. Effect of different eluent on recovery of analytes.
Eluent Recovery, %
Pb Zn Cu Ni Cd
HNO3 94.7989 96.0866 95.9643 91.0964 93.0643
HCl 89.7432 90.5434 88.7532 86.9653 87.8654 H2SO4 80.8542 79.7439 83.9653 85.9654 78.0755
Experimental conditions: 50 mL of sample containing 50 μg L-1
metal ions at pH 6, sorbent, 0.3 g, eluent 3 mL of 1.5 mol L−1 different eluent and flow rate 3.5 mL min-1.
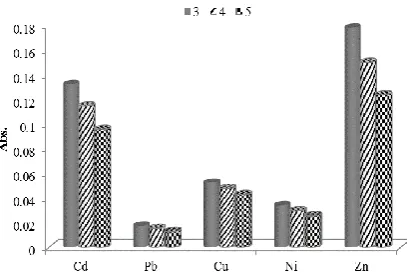
To optimize eluents’ volume, regarding to simultaneous measuring of 5 metal ions, volumes of 3, 4, and 5 mL is studied. According to Fig.5, the maximum adsorption extent is observed for 3 mL of eluent volume. However, the recovery is same for all three volumes. Hence, volume of 3 mL is used as optimum value for next stages, in a view that enhancing volume of eluent decreases the concentrate factor.
Figure 4. Effect of different eluent on recovery of analytes. Experimental conditions: 50 mL of sample containing 50 μg L−1 metal ions at pH 6, sorbent, 0.3 g, eluent 3 mL of 1.5 mol L−1 different eluent and flow rate 3.5 mL min-1
Figure 5. Effect of eluents’ volume on recovery of analytes.
Experimental conditions: 50 mL of sample containing 50 μg L−1 metal ions at pH 6, sorbent: 0.3 g, eluent: different volum of 1.5 mol L−1 HNO3 and flow rate 3.5 mL min-1
Concentration effect of nitric acid, on recovery level of metal cations, is examined. In this study, desorption is tested by 3 mL of HNO3 with different concentrations (0.5-4 M), and concentration of 1.5 M is picked out as optimum eluent concentration considering the results (Fig. 6).
Effect of flow rate of sample
In the SPE method, rate of sample solution is one of the most important parameters affecting both return efficiency of analytes and extracting time.25
Figure 6. Effect of eluent concentration. Experimental conditions: 50 mL of sample containing 50 μg L−1 metal ions at pH 6, sorbent,
0.3 g, eluent 3 mL of different concentration HNO3 and flow rate
3.5 mL min-1
Effect of sample solution rate is examined in the range of 1-8 mL min-1. To do this, solutions with size of 50 mL are passed through columns in optimum conditions with different rates. After elution and desorption of analytes by 3 mL nitric acid of 1.5 Molar, Atomic absorption spectrometer measures them.
As shown in Figure 7, rates more than 5 mL min-1 cause to reduce in recovery of considered cations. Therefore, we choose flow rate of 5 mL min-1 as optimum rate for next steps.
Figure 7. Effect of flow rate of sample. Experimental conditions: 50 mL of sample containing 50 μg L−1 metal ions at pH 6, sorbent,
0.3 g, eluent 3 mL of 1.5 mol L−1 HNO3
Effect of interfering ions
In this section, interfering effect of other ions, as well as interfering effect of considered cations extracted simultaneously, on recovery of analyte on adsorbent is examined in optimum conditions. Allowed error for ion’s concentration is determined less than ±5% for pre-concentrate and measuring analytes. Interfering ion refers to an ion that makes a change more than allowed error in recovery extent. Table 2 lists the results.
Table 2. Tolerance limits for coexisting ions in adsorption of 50 μg L-1 of Zn, Pb, Cu, Cd and Ni.
Foreign ions Interferent /ion ratio
Cu2+ Pb2+ Ni2+ Zn2+ Cd2+
Zn2+ 500 1000 500 - 500
Pb2+ 500 - 1000 500 1000
Cu2+ - 500 500 1000 500
Ni2+ 1000 1000 - 1000 1000
Cd2+ 1000 1000 500 1000 -
Ag+, Ca2+, Na+, Mn2+, Cr3+, Cl-, Li+, NO
3-, Fe2+, K+, Br-, CH3COO- 1000 1000 1000 1000 1000
S2O32- 500 250 1000 1000 1000
F- 500 1000 1000 1000 1000
Co2+ 1000 1000 500 1000 1000
Mg2+ 1000 1000 1000 500 1000
Al3+ 500 1000 250 100 100
I- 1000 500 1000 1000 1000
Table 3. Analytical characteristics of proposed method at the optimum conditions.
Ions Linear range, g L−1 Regression equation Correlation coefficient (r)
LOD, g L−1 (n = 10)
R.S.D., % (n= 10)
Ni2+ 10-400 y=0.0016x+0.0032 0.9996 0.988 1.682
Pb2+ 30-800 y=0.0006x+0.0031 0.9992 2.581 2.151
Zn2+ 5-90 y=0.0086x+0.206 0.9996 1.385 2.276
Cu2+ 10-350 y=0.0024x-0.0007 0.9995 0.527 0.928
Cd2+ 5-90 y=0.0104x+0.0045 0.9998 0.139 1.202
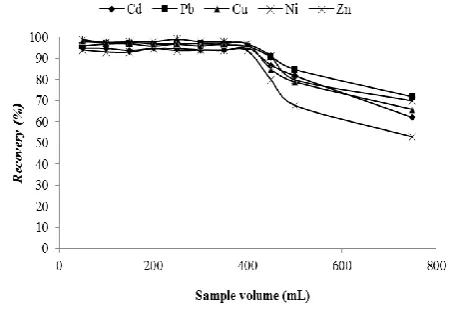
Effect of sample volume
To study concentrate capability of analyte, effect of sample volume on recovery of considered ions is examined by passing various sample volumes (50-750 mL) with optimum flow rate (5 mL) through columns containing 0.3 g of adsorbent, in which each pH of solution is stabilized by adding proper amount of Buffer in optimum condition.
According to Fig. 8, adsorption is done well, with up to 400 mL of solution containing heavy metal ions. Then, adsorbed ions are eluted by 3 mL of nitric acid 1.5 molar. The resulted pre-concentrate factor is 133.
Figure 8. Effect of sample volume. Experimental conditions:, sorbent, 0.3 g, eluent 3 mL of 1.5 mol L−1 different eluent and flow rate 5 mL min-1
Detection limit
Detection limit is the least concentration or amount, which is traceable by analytical method with a certain assurance. Based on IUPAC recommendation, signal of detection limit is average value of instance plus thrice of its standard deviation.
(1)
where,
S is standard deviation, and m is calibration curve slope.26
By this way, 10 solutions of triple-distillated water of 50 mL volume are pre-concentrated in optimum solution, and measured by atomic absorption spectrometer. Results are listed in Table 3.
Measuring metal cations in real samples
Based on obtained optimum conditions, proposed method is employed to measure considered metal cations in three real samples. To do this, columns containing 3 g of adsorbent is prepared, and 50 mL of real sample solution are passed through them with flow rate of 5 mL min-1. Pre-concentrate method is used too. That is, after passing the solution, columns are eluted by 3 mL of 1.5 molar nitric acid and atomic absorption spectrometer measures concentration of metal cations.
b 3S LOD
Table 4. Comparing results of preconcentration factor and detection limit of current work with other works.
Analytical ions Method/Instrumental Preconcentration factor
Detection limit
g L-1
References
Ir(III) SPE on naphthalene/spectrophotomety 40 20 27
Ni(II) SPE on MIP/spectrometry 72.66 0.3 28
Cd(II) SPE on naphthalene/DDP 40 70 29
Cu(II) SPE on mini column of sisal fiber/FAAS 75 0.01 30
In(III) SPE on naphthalene/DDP 25–50 200 31
Co(II) SPE on surfactant-coated alumina/AAS 100 - 32
Cr(III) SPE on activated carbon/FAAS 50 0.27 33
Cd(II), Pb(II), Cu(II), Ni(II), Zn(II)
SPE on soft husk of Pistachio/FAAS 133 0.13-2.58 Present work
SPE: solid phase extraction, MIP: molecularly imprinted polymers, DDP: differential pulse polarography, AAS: atomic absorption spectrometry
Table 5. Analytical result for determination of metal ions in tap water from Tehran city
Ions Added, μg L-1 Found, μg L-1 RSD, % Recovery, %
Cd2+
- n.d. - -
50 52.14 2.141 104.28
100 101 1.429 101.0
Pb2+
- 8.98 3.978 -
50 58.85 3.890 99.74
100 109.0 2.561 100.02
Cu2+
- 18.79 3.988 -
30 48.1 3.521 97.70
60 78.51 1.926 99.53
Ni2+
- n.d. - -
75 75.42 3.951 100.56
150 149.38 3.891 99.58
Zn2+
- 16.05 1.091 -
25 43.15 0.633 108.4
50 66.12 0.581 100.14
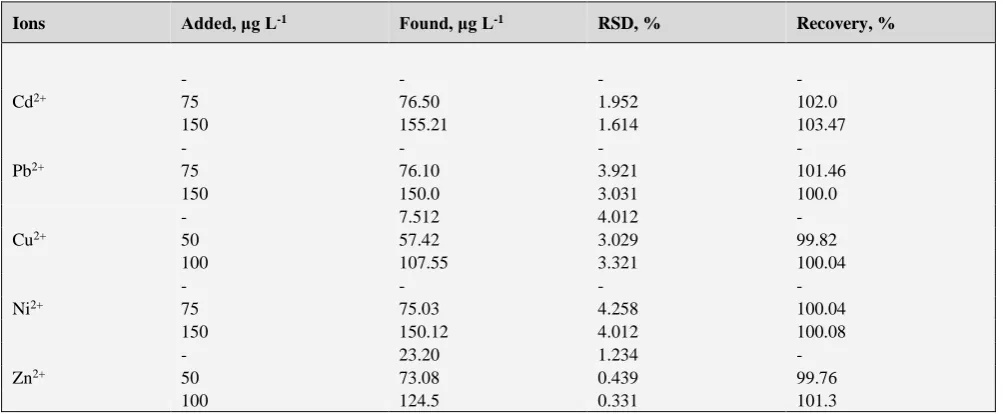
Table 6. Analytical result for determination of metal ions in mineral water
Ions Added, μg L-1 Found, μg L-1 RSD, % Recovery, %
Cd2+
- - - -
75 76.50 1.952 102.0
150 155.21 1.614 103.47
Pb2+
- - - -
75 76.10 3.921 101.46
150 150.0 3.031 100.0
Cu2+
- 7.512 4.012 -
50 57.42 3.029 99.82
100 107.55 3.321 100.04
Ni2+
- - - -
75 75.03 4.258 100.04
150 150.12 4.012 100.08
Zn2+
- 23.20 1.234 -
50 73.08 0.439 99.76
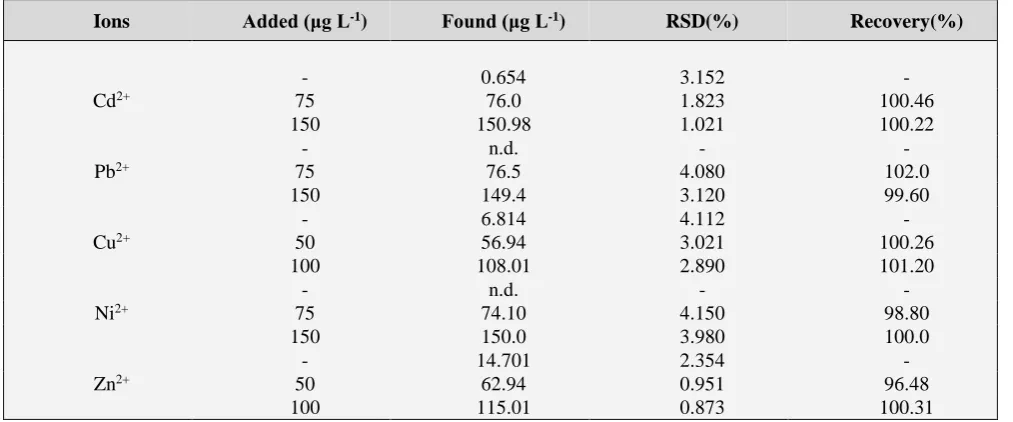
Table 7. Analytical result for determination of metal ions in well water from Semnan city
Ions Added (μg L-1) Found (μg L-1) RSD(%) Recovery(%)
Cd2+
- 0.654 3.152 -
75 76.0 1.823 100.46
150 150.98 1.021 100.22
Pb2+
- n.d. - -
75 76.5 4.080 102.0
150 149.4 3.120 99.60
Cu2+
- 6.814 4.112 -
50 56.94 3.021 100.26
100 108.01 2.890 101.20
Ni2+
- n.d. - -
75 74.10 4.150 98.80
150 150.0 3.980 100.0
Zn2+
- 14.701 2.354 -
50 62.94 0.951 96.48
100 115.01 0.873 100.31
Here, to verify results, we apply standard addition method. Hence, we add a certain amount of standard metal cations solution to sample solution, and pass it through column again. Tables 5 to 7 list the results. As results show, the observed value is almost equal to initial value of metal cation plus the added amount that demonstrates accuracy of method.
Conclusion
In this study, the wastage of soft husk of pistachio was used as an absorbent. Preparation of absorbent out of this wastage is easy and considering of the fact that the wastage of soft husk of pistachio has no function except being animals' food, its consumption is economical. Effective parameters were optimized and a high retrieval for metal ions from water solution was gained. The speed of optimal flow equaled 5 ml min; therefore we need a short time to analyze the samples. Concentration factor (133) was suitable and the result of examination of efficiency number and measurement of heavy metals in real samples approved the validity and accuracy of this method.
References
1Goksungur, Y., Uren, S., Guvence, U., Bioresour. Technol. 2005, 96, 103-109.
2Khraisheh, M. A. M., Al-degs Y. S, Meminn, W. A. M., J. Chem. Eng. 2004, 99, 177–184.
3Sekhar, K. C., Kamala, C. T., Chary, N. S., Sastry, A. R. K., J. Hazard. Mater.2004, 108, 111-117.
4Mohammadi, T., Moheb, A., Sadrzadeh, M., Razmi, A., Sep. Purif. Technol.2005, 41, 73–82.
5Mulligan, C. N., Yong, R. N., Gibbs, B. F., Eng. Geol. 2001, 60,
193–207.
6Naseem, R., Tahir, S. S., Water Res. 2001, 35, 3982-3986.
7Ahluwalia, S. S., Goyal, D., Bioresour. Technol. 2007, 98,
2243-2257.
8Habib, A., Wahiduzzaman, M., Rashid, H. O., J. Anal. Environ. Chem. 2008, 9, 6-10.
9Nriagu, J. O., Pacyna, J. M., Nature1988, 333, 134-139. 10Kersten, M., Vlasova, N., Appl. Geochem. 2009, 24, 32-43. 11Yu, Q., Kaewsam, P., Sep. Sci. Technol. 2000, 35, 689–701. 12Mellah, A., Chegrouche, S., Barkat, M., J. Colloids Interf Sci.
2006, 296, 434–441.
13Prasad, M., Saxena, S., Ind. Eng. Chem. Res. 2004, 43, 1512–
1522.
14Liu, C. C., Wang, M. K., Li, Y. S., Ind. Eng. Chem. Res. 2005, 44,
1438-1445.
15Özcan, A., Özcan, A. S., Tunali, S., J. Hazard. Mater. 2005, 124,
200-208.
16Kobya, M., Adsorpt. Sci Technol. 2004, 22, 51–64. 17Pyrzynska, K., Crit. Rev. Anal. Chem. 1999, 29, 313–321. 18Cai, Y., Q., Jiang, G., B., Liu, J. F., Zhou, Q. X., Anal. Chem.
2003, 75, 2517–2521.
19Smith, R. M., J. Chromatogr. A 2003, 1000, 3-27.
20Majors, R. E., LC-GC Int. 1991, 4, 10-14. 21Pawliszyan, J., Anal. Chem. 2003, 75, 2543-2558.
22Mahmoud, M. E., Kenawy, I. M. M., Hafez, M. M. A. H.,
Lashein, R. R. Desalination2010, 250, 62-70.
23Nie, R., Chang, X., He, Q., Hu, Z., Li, Z., J. Hazard. Mater. 2009, 169, 203-209.
24Pourreza, N., Parham, H., Kiasat, A. R., Ghanemi, K., Talanta
2009, 78, 1293-1297.
25Unuabonah, E. I., Adebowale, K. O., Olu-Owolabi, B. I., Yang, L.
Z., Kong, L. X., Hydrometallurgy2008, 93, 1-9.
26Langmuir, I., J. Am. Chem. Soc. 1918, 40, 136–403.
27Taher, M. A., Puri, S., Bansal, R. K., Puri, B. K., Talanta1997, 45, 411–416.
28Ersöz, A., Say, R., Denizli, A., Anal. Chim. Acta2004, 502, 91–
29Taher, M. A., Turk. J. Chem. 2003, 27, 529–537.
30Dias, F. D. S., Bonsucesso, J. S., Oliveira, L. C., Santos, W. N. L.
D., Talanta 2012, 89, 276– 279.
31Taher, M. A., Talanta2000, 52, 301–309.
32Manzoori, J. L., Sorouradin, M. H., Shabani, A. M. H., Microchem. J. 1999, 63, 295–301.
33Duran, C., Ozdes, D., Gundogdu, A., Imamoglu, M., Senturk, H.
B., Anal. Chim. Acta2011, 688, 75–83.