287 |
P a g e
3 0 J a n u a r y 2 0 1 5
w w w . g j a r . o r g
Statistics bankrupt companies in Poland and in the
world - the specter of last global economic crisis
Pawel Dec, PhD
Institute of Corporate Finance and Investment, Warsaw School of Economics,
Poland
ABSTRACT
The article includes case studies of research on bankrupt companies in selected countries in the last dozen years. The main part of the study refers to the recent economic crisis, in order to emphasize its negative effect on the economy, by a substantial increase in corporate bankruptcies. At the same time, only those data that were already available and, therefore, concerned mainly the first half. Consideration was most published data containing statistics quoted bankruptcy cases in different countries in the aforementioned period. In this way it was possible to illustrate the scale of this phenomenon and has shown the current trend in Poland and abroad. During the study encountered, a number of difficulties relating to the collection of data and evaluation of their reliability.
Keywords
Bankruptcy, statistics bankruptcy of enterprises, business survival indexes
1.
INTRODUCTION
Conducted by the author of the study include the quantitative analysis of cases of bankruptcy operators in selected countries and regions around the world in the years 1997-2014. Focused mainly on the period immediately after the last global crisis, in order to emphasize its negative effect on the businesses. At the same time, only those data that were already available and, therefore, concerned mainly the first half. Consideration was most published data containing statistics quoted bankruptcy cases in different countries in the aforementioned period. In this way it was possible to illustrate the scale of this phenomenon and has shown the current trend in Poland and abroad.
2.
THE NUMBER OF BANKRUPT COMPANIES IN POLAND IN THE YEARS 1997-2014
Compared to 2013, the number of business bankruptcies in Poland in 2014 decreased. Summary data publishing majors bankruptcy statistics also indicate that the increase in the number of corporate bankruptcies lasted since 2009. It can be concluded that the cause of this trend was without a doubt the economic crisis of the years 2007-2008. However, the number of bankrupt companies in recent years, is still far on record in this respect in 2002, when there were up to 1,863
cases of bankruptcy of enterprises.
Table 1. Number of bankruptcies in Poland by Euler Hermes, Coface Poland and D&B Poland in the years 1997-2014
Year Number of bankruptcies according to:
Euler Hermes Coface Poland D&B Poland
1997 - 794 794
1998 864 864 864
1999 1017 1017 1017
288 |
P a g e
3 0 J a n u a r y 2 0 1 5
w w w . g j a r . o r g
2001 1674 1674 1674
2002 1863 1863 1863
2003 1788 1798 1798
2004 1163 1116 1116
2005 727 793 793
2006 298 576 576
2007 480 447 447
2008 420 411 411
2009 673 691 691
2010 720 655 669
2011 739 723 723
2012 941 877 877
2013 926 883 bd
2014 822 823 bd
As for months, it’s definitely the most companies collapsing in 2014 in warmer months (May to June). On the other hand, in January and December 2014 years of business failure was observed after only 62. Compared to 2013, not every month there has been a decline in the number of corporate bankruptcies, as for example, in the three months of 2014 years in May, September and December increased number of insolvent companies. This is noticeable at a clear upward trend of corporate bankruptcy since July 2011, when with each successive month bankrupt companies reported more than in the same months of 2010. In November and December 2011, there were more than forty percent more cases of bankruptcy entities than in the previous year. This trend was confirmed in 2012, when there was a further increase in corporate bankruptcies.
Table 2. Comparison of the number of corporate bankruptcies in 2009-2014 in each month
Month 2009 2010 2011 2012 2013 2014
January 31 54 57 68 90 62
February 52 57 54 79 76 72
March 51 68 68 80 74 64
April 57 46 56 72 88 65
May 71 70 58 95 70 79
June 61 57 55 77 85 76
July 63 63 74 75 98 79
August 46 38 54 76 66 62
September 77 58 60 58 66 71
October 54 56 60 93 85 81
November 59 45 64 86 70 49
December 69 43 63 81 58 62
289 |
P a g e
3 0 J a n u a r y 2 0 1 5
w w w . g j a r . o r g
(147), so it was up to 22% more. The upward trend of bankruptcy in industries engaged in building equipment and real estate services is still visible in 2012, when in the first half of the number of insolvencies in both these sectors significantly exceeded 70% of the total number of bankruptcies in 2011 (70.5% in the construction industry, and real estate activities - 71.5%)
Table 3. The number of bankruptcies by industry in 2008-2012
Sector 2008 2009 2010 2011 2012
Production 168 277 250 218 111
Constructions 59 82 98 143 101
Trade 92 186 147 180 96
Transportation
and storage 15 52 40 40 11
Activities related to
the real estate market 6 14 12 28 20
Others 71 80 108 114 78
Still among the companies that advertise bankruptcy is most of these activities with the shortest history (from 0 to 5 years) - was recorded in 171 such cases in 2010, and in the first half of 2011, 87. The lowest is the case of bankruptcy of the companies that operate over 20 years - these were recorded in 2010, 64 in the first half of 2011, up 51
Table 4. Number of bankruptcy by the age of the company in the years 2009-2011
Age of the company 2009 2010 I-VI 2011
From 0 to 5 years 140 171 87
From 6 to 10 years 175 143 86
From 11 to 15 years 111 105 40
From 16 to 20 years 127 109 43
Over 20 years 84 64 51
No data 54 37 -
Source:www.dnb.com.pl
3.
STATISTICS BANKRUPTCES OF COMPANIES IN THE WORLD
Eurostat pan-European research institution being constantly monitors the number of operators who have declared bankruptcy. Eurostat also conducts research in the field of demography, setting the three following indicators:
The rate of “birth” of business entities, Survival of the business entities,
“Death” of economic operators.
The “birth” of enterprises is the ratio of the number of companies that have arisen in the year n, the population of firms operating in year n.
Table 5. The “birth” of companies in selected countries (in%)
Country
The “birth” of companies in years in %
1998 1999 2000 2001 2002 2003 2004 2005 2006 2007 2008 2009
290 |
P a g e
3 0 J a n u a r y 2 0 1 5
w w w . g j a r . o r g
Belgium - - - 6,66 6,95 5.41 4.58
Bulgaria - - - 10.46 11.89 11.92 15.12 18.17 17.62
Cyprus - - - 5.92 7.14 3.61 3.32 3.27 3.04
Czech
Republic - - - 12.45 10.03 10.13 10.00 8.71 9.26 9.48 3.81 10.93
Denmark - - - 11.89 13.13 13.45 12.94 - -
Greece - - - 6.78 8.72 9.16 8.52 - -
Estonia - - 11.20 12.97 11.49 15.51 16.31 10.98 15.75 13.22 18.20 9.94
Finland 9.26 7.99 7.53 7.49 7.68 7.97 8.54 8.64 9.11 10.08 10.82 9.24
France - - - 8.38 9.46 9.42 9.43 10.14 9.70 15.35
Spain 9.73 9.58 9.65 9.08 9.30 9.78 9.70 10.43 10.37 9.55 7.47 7.19
Holland - 9.56 9.45 9.61 9.91 8.45 8.73 9.81 10.42 13.25 14.45 12.10
Ireland - - - 5.89 6.93
Lithuania - - 11.34 11.48 10.30 9.20 19.83 27.21 25.99 24.73 20.04 14.72
Luxemburg 12.54 12.58 11.63 11.40 10.36 9.56 9.15 9.54 10.30 10.07 9.92 9.27
Latvia - - 16.20 10.20 21.76 10.20 10.59 11.45 9.89 11.08 13.95 16.42
Germany - - - 10.01 9.83 9.59 9.06 9.25 8.31
Norway - - - 10.28 9.90 9.80 10.30 9.58 8.68
Poland - - - 10.63 11.78 13.22 13.24 13.15 12.84
Portugal 9.45 8.00 - 7.46 5.96 - 13.70 13.31 14.21 13.78 10.54 11.27
Romania - - 10.92 11.45 12.59 18.74 18.96 18.29 14.56 15.62 14.65 9.48
Slovakia - - 10.07 14.93 14.97 8.83 10.55 13.42 13.29 13.28 15.51 16.34
Slovenia - - 6.41 6.50 7.14 6.59 8.11 8.82 9.72 10.21 11.72 11.33
Switzerland - - - 3,50 3,64 - - - - -
Sweden 6.57 6.31 7.03 6.58 6.09 6.07 6.49 7.02 6.71 7.37 7.10 7.09
Turkey - - - 10,45
Hungary - - 13.56 12.72 14.54 10.30 10.08 9.00 8.66 9.01 10.15 9.10
Great Britain 13.35 13.08 12.06 11.87 11.69 13.24 14.30 13.68 12.87 14.28 12.99 10.09
Italy 11.38 7.56 7.76 7.69 7.36 7.19 7.72 7.77 7.14 8.38 7.06 7.22
Source: Eurostat, http://epp.eurostat.ec.europa.eu
The “death” of enterprises according to Eurostat, the ratio of the actual number of companies that did not survive in the market in the year n, the population of firms operating in year n.
Table 6. The “death” of companies in selected countries (in%)
Country The “death” of companies in years (in%)
1997 1998 1999 2000 2001 2002 2003 2004 2005 2006 2007 2008 2009
Austria - - - 5.27 6.54 7.24 - 6.59 -
Belgium - - - 5.24 4.35 4.22 10.90 5.24
Bulgaria - - - 9.63 9.10 14.65 13.90 13.07 -
Cyprus - - - 3.06 1.71 2.20 2.38 -
Czech
Republic - - - 9.90 9.31 8.88 10.62 10.95 9.60 12.06 8.14 10.01 -
Estonia - - - 9.83 9.24 9.93 - - -
Finland - - - 12.66 11.84 7.81 10.93 12.24 10.34 7.04 - 13.21 -
291 |
P a g e
3 0 J a n u a r y 2 0 1 5
w w w . g j a r . o r g
Greece - - - 7.59 6.97 6.80 - 7.07 7.74 7.32
Spain - - - 5.43 5.02 6.04 4.61 - -
Holland 7.69 8.04 6.93 7.23 6.87 6.37 6.18 6.11 6.94 6.24 7.46 9.45 -
Ireland - - 8.11 9.21 7.94 8.28 8.03 7.65 9.32 7.39 8.08 7.11 -
Lithuania - - - 7.06 -
Luxemburg - - - 8.37 4.92 9.51 13.89 17.75 14.83 16.65 20.29 32.08 -
Latvia 8.67 8.78 9.25 8.91 9.02 8.42 8.44 8.34 7.90 7.98 7.72 7.75 -
Germany - - - 13.17 9.25 10.26 9.37 11.61 7.86 4.35 11.77 13.98 -
Norway - - - 8,32 9,47 9,13 - -
Poland - - - 8.06 7.57 6.25 5.46 6.53 -
Portugal - - - 10.71 10.11 10.74 9.52 9.59 -
Romania 6.99 6.54 6.26 4.36 4.56 4.08 - 10.76 12.83 13.80 13.88 17.04 -
Slovakia - - - 11.23 11.61 11.31 9.87 10.46 8.61 8.73 8.74 - -
Slovenia - - - 8.92 10.90 10.37 8.48 9.28 10.06 11.26 14.03 14.95 -
Switzerland - - - 6.16 6.35 7.15 6.08 7.18 5.36 6.20 5.92 6.64 -
Sweden - - - 3,55 3,54 - - - - -
Hungary 7.07 5.88 5.09 5.55 5.56 5.18 5.14 5.33 5.61 5.76 - 5.88 -
Great
Britain - - - 9.91 10.41 9.30 8.95 8.87 10.76 9.86 9.76 12.11 -
Italy 10.48 10.62 10.96 10.30 10.58 10.48 11.16 11.36 10.71 9.91 11.23 11.76 -
Austria - 6.52 7.12 6.49 6.54 7.15 6.39 6.50 6.77 6.79 6.88 7.77 -
Source: Eurostat, http://epp.eurostat.ec.europa.eu
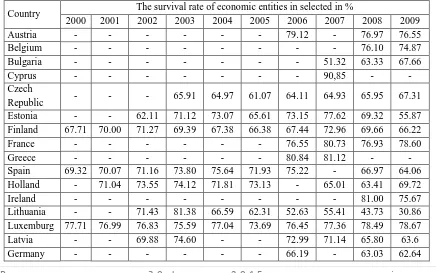
In contrast, the survival rate of enterprises according to Eurostat is the percentage of firms that have arisen in the year than still active in year n + 2 in relation to the total number of companies established in year n.
Table 7. The survival rate of economic entities in selected countries (in%)
Country The survival rate of economic entities in selected in %
2000 2001 2002 2003 2004 2005 2006 2007 2008 2009
Austria - - - 79.12 - 76.97 76.55
Belgium - - - 76.10 74.87
Bulgaria - - - 51.32 63.33 67.66
Cyprus - - - 90,85 - -
Czech
Republic - - - 65.91 64.97 61.07 64.11 64.93 65.95 67.31
Estonia - - 62.11 71.12 73.07 65.61 73.15 77.62 69.32 55.87
Finland 67.71 70.00 71.27 69.39 67.38 66.38 67.44 72.96 69.66 66.22
France - - - 76.55 80.73 76.93 78.60
Greece - - - 80.84 81.12 - -
Spain 69.32 70.07 71.16 73.80 75.64 71.93 75.22 - 66.97 64.06
Holland - 71.04 73.55 74.12 71.81 73.13 - 65.01 63.41 69.72
Ireland - - - 81.00 75.67
Lithuania - - 71.43 81.38 66.59 62.31 52.63 55.41 43.73 30.86
Luxemburg 77.71 76.99 76.83 75.59 77.04 73.69 76.45 77.36 78.49 78.67
Latvia - - 69.88 74.60 - - 72.99 71.14 65.80 63.6
292 |
P a g e
3 0 J a n u a r y 2 0 1 5
w w w . g j a r . o r g
Norway - - - 63.69 66.72 70.87 66.04
Poland - - - 66.85 67.68 71.08 74.51
Portugal - - - 53.71 60.31 56.28
Romania - - 70.96 69.62 76.87 78.60 77.61 75.93 77.23 74.02
Slovakia - - 89.33 82.79 66.49 67.68 70.67 65.89 61.15 51.76
Slovenia - - 84.06 84.61 83.18 82.51 84.21 - 83.48 81.00
Switzerland - - - 70.70 - - 69.63 -
Sweden 86.82 89.30 88.04 87.20 87.78 85.76 87.25 86.17 87.28 86.64
Hungary - - 67.62 68.66 70.44 66.20 - 61.62 63.26 61.19
Great
Britain 78.64 79.86 81.82 82.48 81.95 81.21 - - 80.52 77.64
Italy 71.31 76.65 77.74 77.48 74.88 75.40 - 74.66 74.04 75.49
Source: Eurostat, http://epp.eurostat.ec.europa.eu
Indicator developed and published by Eurostat, unfortunately, does not include entities that end activities due to mergers, acquisitions, restructuring, division, dissolution of companies or have changed the nature of its business. The company is recognized as decadent, if not resumed operations for two consecutive years after its termination. Constant feature of indicators provided by Eurostat is their constant time delay, because in August 2012 were only available indicators of 2009 (birth rate), and for the indicator “death” of enterprises were practically data from the year 2008 (except for a few figures from 2008 . An important and positive novelty of the Eurostat statistics is that for the first time among the presented countries also appeared in Poland, and in all of the categories on business demography (birth, death, survival) summarize the data provided by Eurostat are still delayed, and in addition too often updated and changed. the observed, however, presented more countries and little progress at the time of publishing data, lets hope that the statistics will be more useful and constantly improved.
Matter of statistics in the world of business failure is also involved in various research centers and international companies (Coface, Creditreform, etc.). These include, among others, Euler Hermes, which in addition reported in each year the number of corporate bankruptcies in individual countries develop a global index of bankruptcy.
Table 8. Number of bankruptcy of enterprises in selected countries, 1998-2008
Country Year
1998 1999 2000 2001 2002 2003 2004 2005 2006 2007 2008
Austria 4816 5860 5340 5178 5281 5643 6318 7056 6707 6500 6315
Belgium 6924 7163 6791 7062 7200 7593 7910 7878 7617 7800 8472
Brazil 34711 28879 20999 19956 25707 22493 17318 10026 3374 2500 2243
China 7746 5622 7219 9110 7500 6065 2923 3196 3630 4000 4555
Czech
Republic 2022 2000 2491 2473 2155 1728 1460 1282 1278 1150 1110
Denmark 1652 1636 1770 2329 2469 2506 2620 2495 1987 2300 3709
Estonia - - - 429
Finland 2939 2879 2790 2674 2807 2769 2428 2278 2285 2290 2916
France 53956 47791 43350 43278 44287 49384 49063 49480 47332 49900 57665
Greece 921 886 805 700 576 480 580 590 540 510 563
Spain 896 774 828 759 1037 1012 930 869 853 886 2528
Holland 4015 3238 3579 4330 4963 6386 6648 6780 5941 5170 4635
Hong Kong 800 795 910 1066 1292 1248 1147 849 552 480 468
293 |
P a g e
3 0 J a n u a r y 2 0 1 5
w w w . g j a r . o r g
Japan 18988 15352 18769 19164 19087 16255 13679 12998 13245 14100 15646
Canada 10780 10023 10040 10371 9458 8838 8118 7517 6742 6740 7090
South Korea 22828 6718 6693 5277 4244 5308 4445 3416 2529 2240 2735
Lithuania - - - 928
Luxemburg 399 581 581 750 682 656 663 685 586 650 583
Latvia - - - 1226
Germany 27828 26476 28235 32278 37579 39320 39213 36843 33000 28500 28500
Norway 3347 3243 3576 3562 4473 5223 4297 3540 3032 3000 3637
Poland 864 1017 1289 1674 1863 1798 1025 984 648 415 430
Portugal 1201 1395 1558 1703 1929 2412 2605 1747 1834 1870 3344
Singapore 296 370 290 255 267 231 223 161 130 120 132
Slovakia 873 1090 1212 1263 1510 1262 990 1645 1723 800 582
Switzerland 4363 4196 3842 3613 4002 4539 4955 4751 4528 4330 4221
Sweden 8799 6643 6733 7433 7930 8237 7649 6784 6160 5860 6298
Taiwan 202 196 261 239 314 405 438 514 622 700 805
Turkey 1584 1408 1887 2464 3667 5410 7660 8886 9471 9940 10310
Węgry 4032 3403 5010 5919 6204 7718 7840 7983 9447 11300 11181
Great Britain 23623 25003 24270 24811 25160 23322 21755 23732 24031 20400 29994
Italy 13740 12178 11641 10767 10683 10463 11312 12148 10900 5500 7300
USA 44367 37884 35472 40099 38540 35037 34317 39201 19695 29600 43546
Source: Euler Hermes, www.eulerhermes.com
Comparative analysis of business failure in the period 1998-20011 in Ireland, Greece, Spain, Portugal and Poland (see Figures 4 and 5) shows that, in contrast to those of Ireland, Greece and Spain and Portugal as well as the number of bankruptcies in Poland significantly increased in the first period of analysis (1998-2002), in Portugal the increase was until 2004. the turning point for these countries in terms of the number of bankruptcy was announced in 2007, when he experienced a soaring. Important note is the fact that this trend continues, both in Spain, Portugal, Ireland, Greece and Poland. Detailed data on the number of operators bankruptcy in recent years in Western Europe are presented by Creditreform.
Table 9. The number of corporate bankruptcies in selected countries of Western Europe in the years 2004-2011
Country/
Year 2003 2004 2005 2006 2007 2008 2009 2010 2011
Austria 5,643 6,328 7,136 6,854 6,362 6,500 7,076 6,657 6,194
Belgium 7,593 7,836 7,878 7,617 7,678 8,476 9,382 9,570 10,182
Denmark 2,506 2,620 2,497 1,987 2,401 3,709 5,710 6,461 5,447
Finland 2,769 2,385 2,278 2,285 2,254 2,612 3,275 2,864 3,005
France 38,296 40,776 41,930 40,360 42,532 49,723 53,547 51,060 49,506
Greece 480 577 612 532 524 359 355 355 452
Spain 646 561 869 853 880 2,528 4,984 4,845 5,752
Holland 6,386 6,648 6,780 5,941 4,602 4,635 8,040 7,211 7,000
Ireland 346 321 327 304 363 773 1.406 1,525 1,631
Luxemburg 655 665 682 634 680 590 698 918 961
Germany 39,470 39,270 36,850 34,040 29,150 29,580 32,930 32,060 30,200
294 |
P a g e
3 0 J a n u a r y 2 0 1 5
w w w . g j a r . o r g
Portugal 2,980 3,123 2,300 2,400 2,123 3,267 4,450 5,144 6,025
Switzerland 4,539 4,955 4,751 4,528 4,314 4,222 5,215 6,255 6,661
Sweden 7,099 6,588 5,865 5,243 5,791 6,298 7,892 7,546 7,177
Great
Britain 14,815 12,813 13,462 13,686 12,893 16,268 19,908 17,468 18,571
Italy 16,000 17,500 17,150 8,827 5,518 6,498 8,354 10,089 11,792
Total 129,822 157,263 154,907 139,123 130,910 149,675 178,235 174,463 174,917
Source: www.creditreform.pl
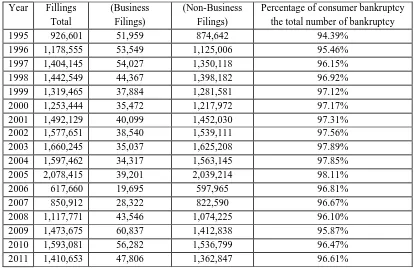
In the United States bankruptcy statistics is developed primarily by the American Bankruptcy Institute. Collected and analyzed there are very detailed information on the number of bankruptcies for operators and consumers.
Table 10. The number of bankruptcies in the United States in the years 1980-2011
Year Fillings
Total
(Business Filings)
(Non-Business Filings)
Percentage of consumer bankruptcy the total number of bankruptcy
1995 926,601 51,959 874,642 94.39%
1996 1,178,555 53,549 1,125,006 95.46%
1997 1,404,145 54,027 1,350,118 96.15%
1998 1,442,549 44,367 1,398,182 96.92%
1999 1,319,465 37,884 1,281,581 97.12%
2000 1,253,444 35,472 1,217,972 97.17%
2001 1,492,129 40,099 1,452,030 97.31%
2002 1,577,651 38,540 1,539,111 97.56%
2003 1,660,245 35,037 1,625,208 97.89%
2004 1,597,462 34,317 1,563,145 97.85%
2005 2,078,415 39,201 2,039,214 98.11%
2006 617,660 19,695 597,965 96.81%
2007 850,912 28,322 822,590 96.67%
2008 1,117,771 43,546 1,074,225 96.10%
2009 1,473,675 60,837 1,412,838 95.87%
2010 1,593,081 56,282 1,536,799 96.47%
2011 1,410,653 47,806 1,362,847 96.61%
Source: http://www.abiworld.org
In recent years, starting from 2007, the total number of insolvencies of operators in the United States has steadily increased (compared to 2006, when it recorded the lowest level of bankruptcies in the US since 1989). In 2010, there were more than eight percent of total bankruptcy than in the previous year 2009. However, in 2011, has already been noted decrease in the total number of bankruptcies in the United States, as reported are about 1.4 million cases. A positive trend is the decline in the number of bankruptcy announced by the company, both in 2010, which in 2011, there were fewer such incidents than in previous periods. In 2011, the number of bankruptcy of the company announced it was even the lowest of three years and amounted to 47 806.
4.
CONCLUSIONS
295 |
P a g e
3 0 J a n u a r y 2 0 1 5
w w w . g j a r . o r g
statistics bankrupt companies. Undoubtedly an obstacle in the collection of such data is the fact that a significant proportion of such information is published by different companies, including business intelligence, and only in a partial range by central statistical offices
5.
REFERENCES
[1] Dec P., Statystyka upadłości, 2006 „Kwartalnik Nauk o Przedsiębiorstwie", No. 1
[2] Kotańska K., Dec P., 2014, Upadłości przedsiębiorstw w Stanach Zjednoczonych, Ekonomika i Organizacja
Przedsiębiorstwa, No 1.
[3] Report on the state of small and medium-sized enterprises in Poland in the years 2002-2003, Polish Agency for Enterprise Development, Warsaw 2004.
[4] Report on the state of small and medium-sized enterprises in Poland in the years 2006-2007, Polish Agency for Enterprise Development, Warsaw 2008.
[5] Conditions for establishment and operation and development prospects Polish enterprises established in 2003-2007,
Central Statistical Office, Warsaw 2009.
[6] Conditions for establishment and operation and development prospects Polish enterprises established in 2004-2008,
Central Statistical Office, Warsaw 2010.
[7] Conditions for establishment and operation and development prospects Polish enterprises established in 2005-2009,
Central Statistical Office, Warsaw 2011.
[8] Conditions for establishment and operation and development prospects Polish enterprises established in 2006-2010,
Central Statistical Office, Warsaw 2012
[9] Structural changes of groups of entities of the national economy in the registry Regon 2011, Central Statistical Office, Warsaw 2012.
[10] www.coface.pl
[11] www.coface.com
[12] www.creditreform.pl
[13] www.eulerhermes.com
[14] www.eulerhermes.pl
[15] www.dnb.com.pl
[16] www.epp.eurostat.ec.europa.eu
[17] www.stat.org.pl