SOL-GEL PREPARATION OF NANOCRYSTALLINE TITANIA
PHOTOCATALYST USING ETHYL ACETOACETATE
MODIFIED Ti(n-BuO)4 PRECURSOR
S. Kurajica,
[a]* I. Minga
,[a]V. Mandić
[a]and K. Mužina
[a]Keywords: Nanocrystalline anatase; photocatalytic activity; bandgap; ethyl acetoacetate; chelating agent.
Sols prepared by chelation of titanium n-butoxide, Ti(OC4H9)4, with ethyl acetoacetate, C6H10O3, in various ratios were slowly hydrolyzed, and the obtained gels were investigated using Fourier transform infrared spectroscopy, X-ray diffraction, and thermogravimetric analysis. The gels were thermally treated at 350 °C, and the products were investigated using X-ray diffraction, N2 gas adsorption–desorption isotherms and diffuse reflectance UV–Vis spectroscopy. Photocatalytic activity assessment was obtained through degradation process of methylene blue under UV light. From the results obtained, the relationships between gel structure and titania crystallite size, specific surface area, bandgap, and photocatalytic activity, as the most relevant parameters, were discussed. The alkoxide modification affected the gel structure, as well as the properties of the final material. However, the sample prepared from unmodified Ti-n-butoxide yielded the most favorable properties.
* Corresponding Author E-Mail: [email protected]
[a] University of Zagreb, Faculty of Chemical Engineering and Technology, Marulicev trg 19, HR-10000 Zagreb, Croatia
Introduction
Nanocrystalline titania has been in the focus of numerous researches with respect to its potential photocatalytic, photovoltaic and optical applications.1 Titania exhibits three crystalline phases: brookite, anatase, and rutile. Among these crystalline phases, it has been reported that anatase has the highest activity in photocatalytic degradation of organic pollutants.2-4 Besides structure, it is well established that the performance of titania depends on additional parameters such as crystallinity, morphology, texture, etc.4,5 It is commonly accepted that an increase of crystallinity and specific surface area benefits the titania photocatalytic activity.2,5 Hence, the synthesis of pure anatase nanoparticles has great technological interest.
Nanocrystalline titania is often synthesized trough sol-gel processes since it has proved to be effective in controlling structural and textural properties of the obtained solids. Common precursors for the sol-gel synthesis are highly reactive alkoxides that hydrolyze rapidly in contact with water, resulting in uncontrolled precipitation.2,6 In order to slow down the rate of hydrolysis and achieve greater control of the synthesis, chemical modification of alkoxide precursors with chelating agents is often utilized.7 The structure of the modified alkoxide further affects the properties of the gel formed by its hydrolysis, which is reflected in physical properties of the final material.
Various chelating agents can be used for the chemical modification of metal alkoxides, among them β-diketones and β-ketoesters are the most commonly used due to their availability and low cost.8-10 β-diketones and β-ketoesters
are bidentate monocharged ligands capable of undergoing keto-enol tautomerism. The ketonic form most often predominates, while in the presence of alkoxide, the reactive enol form substitutes the alkoxy group of the alkoxide, forming six-membered chelate ring and strongly shifting keto-enolic equilibrium towards the enolic form.11
In the present study, a less commonly used chelating agent,9,12,13 ethyl acetoacetate has been applied for modification of titanium n-butoxide in various ratios to investigate its effect on the structure and properties of the obtained gel systematically, and the titania crystallized thereof.
Experimental
The sols were prepared using titanium n-butoxide, Tnb (Ti(OnBu)
4, 97 %, Aldrich, Great Britain), and ethyl acetoacetate, Eaa (C6H10O3, 99 %, Fluka, Germany), while isopropyl alcohol (C3H7OH, 99 %, Kemika, Croatia) was used as a solvent. All chemicals were used as received. Three sols were prepared, with Eaa/Tnb molar ratios of 0, 1 and 2, denoted 0/1, 1/1 and 2/1, respectively. Such ratios were selected bearing in mind that titanium is preferentially six coordinated, so the Eaa/Tnb ratios higher than 2 would yield no further expansion of the coordination sphere.
Drying of the samples for five more days at room temperature enabled the evaporation of the solvent and the release of alkoxy groups, resulting in a dry product. The obtained samples were subsequently ground to fine powders and stored. The measurements were done approximately 1 month after the synthesis.
IR spectra were acquired using the Fourier transform infrared spectrometer Bruker Vertex 70 in ATR (attenuated total reflectance) mode. The samples were pressed on a diamond, and the absorbance data were collected between 400 and 4000 cm–1 with the spectral resolution of 1 cm–1 and 64 scans.
The powder X–ray diffraction (XRD) was accomplished using Shimadzu diffractometer XRD 6000 with CuKα radiation. Data were collected between 10–80° 2θ, in step scan mode with steps of 0.02 ° and counting time of 0.6 s. The average crystallite size of anatase was calculated from the broadening of (100) diffraction peak using Scherrer´s equation:
𝐷 = 𝑘λ
β𝑐𝑜𝑠θ (1)
where
D is the average crystallite diameter,
k is the Scherrer’s constant (0.94), λ is the X–ray wavelength (0.15418 nm),
is full width at the half height of (100) diffraction peak corrected for instrumental broadening and θ is the diffraction angle.
The thermal evolution of the gel was characterized with DTA–TGA thermal analysis using Netsch STA 409C. For the thermal analysis, ~50 mg of the material were placed in a Pt crucible and heated at a rate of 10 °C min–1 in a synthetic air flow of 30 cm3 min–1. –alumina was used as a reference.
Surface area was determined by Brunauer–Emmet–Teller (BET) N2 gas adsorption–desorption isotherms obtained at 77 K on Micromeritics ASAP–2000 equipment. Samples were previously degassed at 100 °C under a dynamic vacuum of 1.3 × 10⁻² Pa. Pore size distributions were calculated from the desorption isotherms by the BJH model.
The UV–Vis spectrum of the prepared samples was obtained using DRS (Shimadzu UV–3101PC) equipped with an integrating sphere. The spectra were recorded at room temperature in the wavelength range of 200–800 nm. BaSO4 was used as a reference. The diffuse reflectance spectra were transformed by performing a Kubelka–Munk transformation of the measured reflectance according to:
𝐹(𝑅) =(1 − 𝑅) 2
2𝑅 (2)
where
F(R) is proportional to the extinction coefficient (α)
and
R is the reflectance of the “infinitely thick” layer of the solid.2
The bandgap energy, Eg, was determined by plotting (F(R)hν)n vs. photon energy (hν), the so–called Tauc's plot, where h is the Planck’s constant and ν is frequency, while n
is a coefficient associated with electronic transition, and it is equal to ½ for indirect and 2 for directly allowed transitions, respectively.2 Bandgap is obtained by extrapolation of the linear region of the (F(R)hν)n vs. hν curve onto the energy axis.
The photocatalytic activity of nanocrystalline anatase was determined by studying the degradation of methylene blue (MB) as a model compound. Borosilicate cylindrical glass vessel with 100 mm diameter and 120 mm height was used as a photocatalytic reactor. Quartz glass tube with a lamp inside was placed axially in the center of the vessel. Pen-Ray lamp (UVP Products Cat. No. 90–0012–01), with the radiation wavelength of 254 nm and emission intensity of 2 mW cm-2, was used as UV source. Prior to placing in the reactor, 500 ml of 10 ppm methylene blue aqueous solution containing 500 mg of catalyst were ultrasonicated for 30 min. After placing in the reactor, the mixture was stirred using a magnetic stirrer operating at 300 rpm, to maintain a homogeneous reaction mixture, and irradiated. The photodegradation experiments were carried out at room temperature (298 K). Aliquots of 4 ml were withdrawn from the mixture by a syringe at regular intervals of 30 min. The first aliquot was withdrawn from the mixture before the beginning of irradiation. The photodegradation was monitored with a UV–Vis Shimadzu UV–3101PC spectrophotometer. Spectra were acquired and intensity of main methylene blue absorption band at ~660 nm measured. The discoloration ratio was calculated as the ratio between absorbance after the measurement interval and absorbance prior to irradiation. The degradation of the substance was depicted with discoloration ratio as a function of the irradiation time.
Results and discussion
The FTIR spectra of samples 0/1, 1/1 and 2/1 are shown in Figure 1. The spectrum of sample 0/1, obtained from unmodified titanium n-butoxide precursor, shows the weakest alkoxide absorbance bands, pointing out to the advanced hydrolysis of this sample. Still, titanium n-butoxide absorbance bands are easily assignable. Set of three vibrations at 2,960, 2,930 and 2,870 cm-1 corresponds to symmetric and antisymmetric stretching vibration modes of –CH2– and –CH3 groups, while bands at 1440 and 1380 cm-1 are related to –CH
3– and –CH2– deformation vibration of the alkoxide groups.14-16 The Ti–O–C stretching can be observed at 1125 cm-1, absorption bands at 1095, and 1040 cm-1 could be attributed to the –C–O– vibration of alkoxide groups linked to Ti, while vibration at 1070 cm-1 is typical for the titanium n-butoxide.14,16
Figure 1. FTIR spectra of investigated gel samples. Spectra are shifted vertically for visualization purposes.
Very strong C=O vibrations of Eaa in the enolic form chelated to the metal alkoxide at 1580 cm−1 and 1530 cm−1 and weak bands at 1710 cm-1 and 1730 cm-1 due to the presence of free Eaa in the keto form have been observed in FTIR spectra of samples 1/1 and 2/1.17-19 Therefore, enolate in the chelate ring structure, as well as free keto tautomer, can be observed in the spectra of samples 1/1 and 2/1. As no excess keto tautomer was present in the samples,20 the observation of bands due to keto Eaa is the consequence of partial hydrolysis, causing the release of Eaa from the complex.12
The conclusion on partial hydrolysis of both groups could be, to some extent, corroborated with the presence of bandwidth between 3700-2500 cm-1, attributed to the hydroxyl groups of Ti-OH species formed during the gelation. The intensity of this band slightly increases with the increase of Eaa/Tnb ratio. However, it is obvious that increased intensity of this band is not the consequence of enhanced hydrolysis with the increased Eaa/Tnb ratio. As a matter of fact, it has been established that the rate of hydrolysis-condensation reaction is inversely proportional to the amount of chelating ligands, such as diketone and β-ketoester, including ethyl acetoacetate, added to the titanium alkoxides.9 Therefore, the hydrolysis rate of the less chelated Tnb, i.e. with lower Eaa/Tib ratio, should be faster than that of the chelate with higher Eaa/Tib ratio.
Most probably the structure of the gel obtained with chelated precursor retains more released butanol and solvent, yielding with the enhanced bandwidth between 3700-2500 cm-1. An argument for this hypothesis is a slight shift of this band from 3100 to 3200 cm-1, with respect to the unchelated sample. Indeed, according to Velasco,16 the broadband between 3600 and 3000 cm-1, corresponding to O-H vibrations, can be deconvoluted into several peaks corresponding to free or interstitial water, coordinatively bound water and rigidly bound water in the form of hydroxyls ions (Ti-OH groups), as well as the presence of OH groups from butanol. The band due to the O-H vibrations of Ti-OH groups is located at 3545 cm-1, while bands due to the retained H2O and butanol produced by Tnb hydrolysis are at 3266 cm-1.
Additionally, the bands due to CH3 and CH2 groups in samples 1/1 and 2/1 are stronger in comparison with the unchelated sample, but this could only partially be because of the presence of alcohols since Eaa contributes to this bands. An increase of the amount of Eaa in samples is also reflected in the intensity of chelate bands, which grow stronger from the sample 1/1 to sample 2/1. Besides vibrations at 1580 cm−1 to 1530 cm−1, an increase of strong band at 1280 cm-1, as well as a smaller one at 1175 cm−1, both due to Eaa could be observed.
It could be concluded that the gel contains some amount of unhydrolyzed bound ethyl acetoacetate groups and, to a certain extent, unhydrolyzed butoxy groups. Butoxy groups are more susceptible to hydrolysis than acetoacetate groups,11 but, judging by the presence of Ti–O–C stretching at 1125 cm-1, and having in mind the established presence of alkoxy groups even in sample 0/1 (without the chelating agent), the fact that some of the alkoxy groups remained unhydrolyzed is definite. This is a consequence of efficient retardation of the hydrolysis-condensation process with the chelation agent, as well as mild experimental conditions since the hydrolysis was accomplished by exposing the samples to atmospheric moisture. Further, hydroxy groups bonded to titanium, as a consequence of the replacement of butoxy groups with OH groups in the course of the hydrolysis, are present. Additionally, along with the obtained hybrid product, a small amount of n-butanol released in the course of the chelation and adsorbed water are also present in the gel.
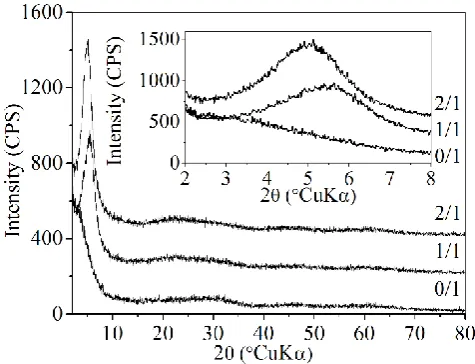
Figure 2. Powder XRD patterns of investigated gel samples. Scans are shifted vertically for visualization purposes. Inset: enlarged portion of XRD patters in 2-8 °2θ (CuKα) range.
characterized as mesostructured, and the absence of diffraction peaks at higher angles points out to the lack of a higher degree of structural order.24 Since the non-chelated sample displayed no mesostructure, it seems that the chelating agent has a key role in the nanoclusters self-assembly process, forming spacers between the nanoclusters and enabling the development of a mesostructured inorganic-organic framework.
The sharpness of the low-angle peak reflects the degree of order in the mesostructure and the observed, relatively weak and broad XRD peaks indicate the short range ordering of the mesoscale.21,25
The peak in the XRD pattern of sample 2/1 shows slightly increased intensity in comparison with the peak of sample 1/1. This is probably the consequence of a better ordering of mesostructural units. According to the Bragg equation, the
d-spacing of repeating units of the obtained mesostructured material can be estimated to be 15.8 for sample 1/1 and 17.7 Å for sample 2/1, respectively. The shift in the position of the XRD peak from sample 1/1 to sample 2/1 is probably the consequence of a slightly increased size of repeating structure units in this sample, yielding with structure expansion.
Figure 3. Powder XRD patterns of sample 1/1 a) after uniaxial pressing under pressure of 100 MPa, b) after treatment with hydrogen peroxide, c) quenched from various temperatures. Spectra are shifted vertically for visualization purposes.
It is interesting to note that uniaxial pressing of chelated samples under pressure of 100 MPa yielded a decrease of low-angle XRD peak intensity (Figure 3a), while oxidation with hydrogen peroxide resulted in complete disappearance of this peak (Figure 3b). Heating of the samples to 100 °C does not change the appearance of low-angle XRD peak. Peaks show reduced intensity after heating to 200 °C and then vanish after heating to 300 °C (Figure 3c). This result suggested that the mesostructure has collapsed during the removal of organics from the samples through oxidation or thermal treatment. All of the above confirm the key role of Eaa for the establishment and maintaining of the mesostructure.
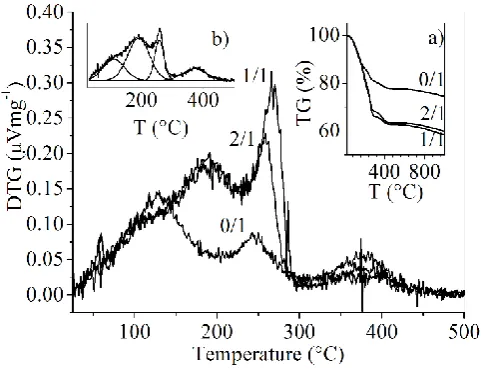
Figure 4. DTG curves of investigated gel samples. Insets: a) TGA curves of investigated samples obtained with a heating rate of 10 °C min-1 in air, b) deconvolution of the DTG curve for sample 2/1.
Figure 4 shows the thermal behavior of dried gels by depicting the TGA and DTG curves. The obtained TGA curves have several characteristic segments, which can be better observed through DTG curve analysis. DTG curve in temperature interval 25-500 °C could be fitted to four Lorentz peaks. An additional mass loss step could be observed in the temperature interval above 500 °C. The TGA curves have at least five characteristic segments. 1) Until 150 °C, the elimination of adsorbed water and butanol (and ethyl acetoacetate in chelated samples only) on the grain surface and inside composite particles could be observed.6 2) A rapid weight loss occurred around 200 °C in the chelated samples was attributed to the decomposition of the chelate and evaporation of Eaa.24 3) The decomposition of butoxy groups occurred in all samples between 200 and 300 °C.26 4) Weight loss between 300 and 400 °C in similar systems could be attributed to dehydroxylation of Ti-OH groups formed in the course of the hydrolysis,18,27 which was accompanied with anatase crystallization. 5) Weight loss above 500 °C could be attributed to the oxidation of char and tar remained within the powder grains.26
According to the TGA, sample 0/1 lost 26.3 % of its mass, while the chelated samples lost 41.4 (1/1) and 40.1 % (2/1) of their mass. One would expect a greater mass loss for 2/1 sample compared to 1/1 sample due to a greater Eaa/Tnb ratio, but this was not the case. The reason for that is most probably slight variations of adsorbed water and butanol in the samples.
Figure 5. Powder XRD patterns of investigated samples after thermal treatment at 350 °C for 2 h. Silicon was added as internal standard.
The diffraction patterns of investigated powders show certain differences in anatase peaks intensities (Figure 5). The relative intensities of anatase (101) peak in comparison to silicon (111) peak is given in Table 1. Thermal development of sample 2/1 is obviously the slowest in comparison to other samples, yielding with a smaller amount of amorphous phase transformed to anatase at 350 °C. Possible reason for this could be found in greater Eaa to Tnb ratio, inclining to slow down the crystal phase formation. Similar retardation has been observed by Kartini and Lufor acetylacetonate/Ti-isopropoxide system.28 They suggested that an excess amount of acetylacetonate makes the Ti-precursor bulkier. The chelating molecules remaining in Ti-complex restrained the interactions between clusters and caused the suspension of crystal growth.
Broad anatase diffraction peaks point out to the nanocrystalline character of anatase. Therefore, the crystallite size of anatase nanocrystals was estimated from the full-width at half maximum intensity (FWHM) of (101) diffraction peak using Scherrer’s equation and reported in Table 1. Samples are characterized by low values of the crystalline domain dimension, but without significant differences, taking into account the limitations of this method.
XRD diffraction of thermally treated samples showed that the titania gels were successfully crystallized to pure nanocrystalline anatase at a relatively low temperature. It should be noted that thermal treatment at 350 °C is not enough for a complete removal of organics, which is obvious from the grayish color of the samples. Grayish color of the samples was ascribed to carbonaceous deposits derived from the decomposition of organics and encapsulated by the titania matrix, making its decomposition difficult.25 This observation is in agreement with the TGA results showing the presence of organic residue thermal decomposition products at high temperatures.29
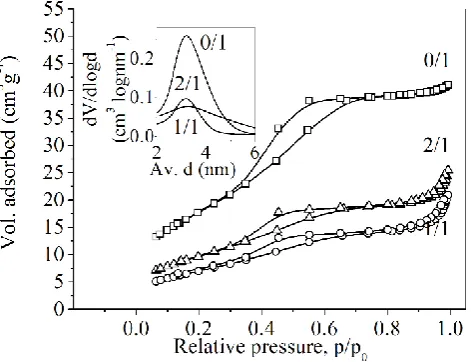
Figure 6 presents the nitrogen adsorption/desorption isotherms and pore size distribution of the samples 0/1, 1/1 and 2/1 calcined at 350 °C for 2 h. The isotherms exhibited a type IV isotherm with H2 hysteresis loops, suggesting that the material is mesoporous.30,31 Hysteresis loop of this type is believed to be associated with pores generated by
agglomerates or compacts of particles of the non-uniform size and arrangement.32 The BJH analysis for the samples yields a corresponding pore size distribution peak centered at approximately 3.2 nm (Figure 6, inset). The pore size distribution is monomodal and relatively narrow for samples 0/1 and 1/1, while sample 2/1 displays a slightly broader pore size distribution. Therefore, the obtained nitrogen absorption/desorption isotherms and pore size distributions are typical of porous aggregates of anatase nanocrystals, with a relatively narrow pore size distribution in the range of mesopores.
Figure 6. N2 adsorption – desorption isotherms. Inset: pore size distribution of samples thermally treated at 350 °C for 2 h.
The textural parameters of the obtained samples have been summarized in Table 1. As can be seen, the surface areas of the samples are relatively low, suggesting poor pore structure. Additionally, it can be concluded that the BET surface area, as well as the pore size volume of samples prepared with the addition of Eaa, is smaller with respect to the sample without Eaa. The reduced pore volume (Table 1) of samples 1/1 and 2/1 in comparison with sample 0/1, and consequently, the reduced BET surface area, could be ascribed to a partial blocking of the pores of the residual carbonaceous material. The residuals of carbonaceous material have been observed in the TGA analysis and the reduction of pore volume due to the blockage with carbonaceous material has been described in the literature.28 It seems that the crystallite size correlates with the specific surface area to a certain extent since sample 1/1 has the smallest specific surface area. As shown with X-ray diffraction, sample 2/1 shows a certain crystallization lag with respect to the other samples. Less advanced thermal evolution is usually associated with smaller and less sintered grains, which is probably the reason for the slightly increased surface area of sample 2/1 in comparison to sample 1/1.
Figure 7. UV–vis diffuse reflectance spectrum of the samples thermally treated at 350 °C for 2 h. Inset: Tauc’s plot showing band gaps.
However, it was demonstrated before that there is no evidence that the direct transition is more suitable for the investigated system, regardless of its nanocrystalline nature.34 Therefore, modified Kubelka–Munk function (F(R)hν)1/2 has been plotted against E (Tauc's plot) and the corresponding values were normalized for comparison purposes (Figure 7, inset). The bandgap was obtained from the extrapolation of the absorption edge onto the energy axis (Figure 7, inset). As can be seen, the extrapolation yields an
Eg value of 3.02 eV for sample 0/1 and 3.14 eV for samples 1/1 and 2/1. The blue shift, i.e. move of the absorption edge toward smaller wavelengths, could be observed for the chelated samples. This phenomenon is commonly explained by quantum size effects,35 which is obviously not the case here, since the sample with the smallest crystallite size (0/1) has the absorption edge at the greatest wavelength, i.e. smallest bandgap.
Figure 8. Photocatalytic discoloration of MB over TiO2 catalyst at room temperature, pH = 7, initial MB concentration = 10 ppm, catalyst concentration = 1 g L-1. The lines are introduced as guidelines for the eye. Inset: UV-Vis spectra of MB solution containing 1/1 sample measured after various photodegradation intervals.
The preliminary assessment of the photocatalytic activity of the prepared catalyst was obtained through the degradation process of 10 ppm aqueous solution of methylene blue in the presence of 1 g L–1 of the catalyst. In the spectra of MB recorded after illumination with UV light with respect to time, two peaks were initially observed, at 664 and 612 nm, which merged at higher irradiation times and the maximum absorbance was finally observed at around 636 nm. Still, absorbance change at λmax versus irradiation time was used to test the photocatalytic activity of titania qualitatively. The reduction of maximal absorbances was noted with respect to the time elapsed from the beginning of irradiation with UV light. The photocatalytic activity of the prepared catalysts has been presented as discoloration ratio in dependence on irradiation time in Figure 8.
The data clearly indicate that the MB discoloration ratio by the photocatalyst prepared without ethyl acetoacetate is greater than for the chelated samples, which implies that the photocatalytic activity of the sample without Eaa is greater than that of the samples with Eaa. When the sample prepared without Eaa was used as the photocatalyst, 99 % MB could be discolored within 150 min of irradiation, whereas 95 % and 97 % MB discoloration ratio could be obtained in the same reaction time for the samples 1/1 and 2/1, respectively.
For the chelated samples, the energy bandgap was higher than for the sample obtained without ethyl acetoacetate addition. Electron-hole pair generation is dependent on bandgap,36 influencing the intensity of light that could be absorbed. Therefore, it is expected that the sample with a lower bandgap, i.e. the one which is not chelated, will be photocatalytically more active.
Another factor having the strong influence on photoactivity is the specific surface area. The great surface area provides increased adsorption capacity, enabling better adsorption of the dye and better interactions among the formed oxidant reactive species on material particles surface with the pollutant.2 Also, the higher number of surface catalytic sites enables less recombination of electron-hole pairs, which is the rate–determining step in the photocatalytic degradation.36 Again, the sample with the greatest specific surface area was the unchelated one. Therefore, photocatalytic activity is in concordance with bandgap and specific surface area values.
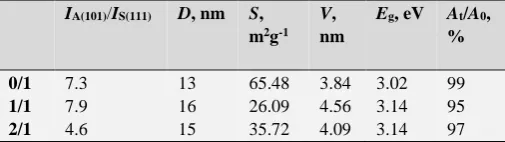
Table 1. Semiquantitative comparison of anatase (101) peak intensity with silicon (111) peak intensity, crystallite sizes of anatase nanocrystals calculated using Scherrer’s equation, surface area calculated by the BET equation, pore volume calculated from the BJH model, bandgap obtained through Tauc’s plot and photocatalytic discoloration ratio of MB after 150 min (room temperature, pH = 7, initial MB concentration = 10 ppm, catalyst concentration = 1 g L-1) for investigated samples thermally treated at 350 °C for 2 h.
IA(101)/IS(111) D, nm S, m2g-1
V, nm
Eg, eV At/A0, %
0/1 7.3 13 65.48 3.84 3.02 99
1/1 7.9 16 26.09 4.56 3.14 95
Conclusion
Titania gels were prepared by chelation of titanium n-butoxide with ethyl acetoacetate in various ratios followed by a slow hydrolysis. FTIR spectra pointed out to partial hydrolysis leaving some residual butoxy and ethyl acetoacetate groups attached to titanium. XRD patterns of the gels prepared out of modified alkoxide revealed some degree of ordering on the mesostructure scale. Sample with a higher Eaa/Tnb ratio showed better ordering and increased the size of mesostructural units. The thermal evolution of the gels is consisted of: elimination of adsorbed water and butanol in room temperature to 200 °C range, decomposition and elimination of butoxy groups between 200 and 300 °C, crystallization of anatase centered at 404 °C, transformation to rutile starting from 540 °C and oxidation of char and tar above 600 °C.
Thermal treatment at 350 °C for 2 h yielded with the formation of pure nanocrystalline anatase with the crystallite size in the range of 13 and 16 nm. The compact mesostructure most probably inhibits the removal of organic phase to a certain extent, thus repressing the growth of the anatase crystals. Nitrogen absorption/desorption isotherms and pore size distribution are typical of porous aggregates of anatase nanocrystals, with a relatively narrow pore size distribution in the range of mesopores. Relatively low specific surface area of the samples in the range between 26.09 and 65.48 m2 g-1 has been ascribed to the reduction of mesopores volume due to blockage with carbonaceous material. The bandgap has been obtained through Tauc’s plot yielding Eg values of 3.02 to 3.14 eV. The preliminary assessment of the photocatalytic activity of the prepared catalyst was obtained through the degradation process of methylene blue under UV light. The degradation of the dye between 95 and 99 % took place within 150 min.
The alkoxide modification affects the properties of the gel, as well as the final material, influencing the crystallite size and specific surface area, and consecutively influencing the photocatalytic activity. Surprisingly, the sample prepared of unmodified alkoxide yields with the smallest average crystallite size of 13 nm, the greatest specific surface area of 65.48 m2 g-1, the smallest bandgap of 3.02 eV and the greatest photocatalytic discoloration ratio of 99 %.
Acknowledgements
The support of University of Zagreb is gratefully acknowledged.
References
1Chen, X., Mao, S. S., Chem. Rev., 2007, 107, 2891-2959.
https://doi.org/10.1021/cr0500535
2López-Granada, G., Barceinas-Sánchez, J. D. O., López, R., Gómez, R., J. Hazard. Mater., 2013, 263, 84-92.
https://doi.org/10.1016/j.jhazmat.2013.07.060
3Nolan, N. T., Sol-gel synthesis and characterization of novel metal
oxide nanomaterials for photocatalytic applications, Doctoral Thesis, Dublin Institute of Technology, Dublin, 2010.
4Porkodi, K., Daisy Arokiamary, S., Mater. Charact., 2007, 58, 495–503. https://doi.org/10.1016/j.matchar.2006.04.019
5Liu, Y., Liu, C.-Y., Zhang, Z.-Y., Chem. Eng. J., 2008, 138, 596– 601.https://doi.org/10.1016/j.cej.2007.08.004
6You, J.-H., Hsu, K.-Y., J. Eur. Ceram. Soc., 2010, 30, 1307–1315.
https://doi.org/10.1016/j.jeurceramsoc.2009.10.011
7Birnie III, D. P., Bendzko, N. J., Mater. Chem. Phys., 1999, 59, 26-35.https://doi.org/10.1016/S0254-0584(99)00021-8
8Errington, R. J., Ridland, J., Clegg, W., Coxall, R. A., Sherwood, J. M., Polyhedron, 1998, 17, 659-674.
https://doi.org/10.1016/S0277-5387(97)00418-X
9Jung, M. W., Oh, H. J., Yang, J. C., Shul, Y. G., Bull. Korean
Chem. Soc., 1999, 20, 1394-1398.
10Kayan, A., Hoebbel, D., Schmidt, H., J. Appl. Polym. Sci., 2005,
95, 790–796. https://doi.org/10.1002/app.21315
11Kurajica, S., Mali, G., Gazivoda, T., Sipusic, J., Mandic, V., J.
Sol-Gel Sci. Technol., 2009, 50, 58–68.
https://doi.org/10.1007/s10971-009-1905-6
12Hoebbel, D., Reinert, T., Schmidt, H., J. Sol-Gel Sci. Technol.,
1997, 10, 115–126.
https://doi.org/10.1023/A:1018305811088
13Shalini, K., Chandrasekaran, S., Shivashankar, S. A., J. Cryst.
Growth, 2005, 284, 388–395.
https://doi.org/10.1016/j.jcrysgro.2005.06.053
14Bahloul, W., Bounor-Legare, V., Seytre, G., Cassagnau, P., J.
Sol-Gel Sci. Technol., 2011, 57, 86–94. https://doi.org/10.1007/s10971-010-2327-1
15García-Benjume, M. L., Espitia-Cabrera, M. I., Contreras-García, M. E., J. Ceram. Process. Res., 2010, 11, 198-203.
16Velasco, M. J., Rubio, F., Rubio, J., Oteo, J. L., Thermochim.
Acta, 1999, 326, 91-97. https://doi.org/10.1016/S0040-6031(98)00580-2
17Chen, H.-J., Wang, L., Chiu, W.-Y., Mater. Chem. Phys., 2007,
101, 12–19.
https://doi.org/10.1016/j.matchemphys.2006.02.007
18Chang, T. C., Wang, Y. T., Hong, Y. S., Chiu, Y. S., Thermochim.
Acta, 2002, 390, 93-102.
https://doi.org/10.1016/S0040-6031(02)00078-3
19Jung, M., J. Sol-Gel Sci. Technol., 2000, 19, 563–568.
https://doi.org/10.1023/A:1008748924836
20Kurajica, S., Skoric, I., Lozic, I., Mandic, V., Mater. Chem. Phys.,
2014, 147, 1058-1067.
https://doi.org/10.1016/j.matchemphys.2014.06.059
21Chen, W., Qiu, Y., Yan, K., Yang, S., J. Power Sources, 2011,
196, 10806-10816.
https://doi.org/10.1016/j.jpowsour.2011.09.011
22Chandra, D., Bhaumik, A., Microporous Mesoporous Mater.,
2007, 101, 348–354.
https://doi.org/10.1016/j.micromeso.2006.11.027
23Wang, Y.-D., Ma, C.-L., Sun, X.-D., Li, H.-D., J. Non-Cryst.
Solids, 2003, 319, 109–116.
https://doi.org/10.1016/S0022-3093(02)01956-7
24Kurajica, S., Minga, I., Mandić, V., Matijašić, G., J. Therm. Anal.
Calorim., 2016, 124, 645-655.
https://doi.org/10.1007/s10973-015-5188-6
25Saadoun, L., Ayllon, J. A., Jimenez-Becerril, J., Peral, J., Domenech, X., Rodriguez-Clemente, R., Mater. Res. Bull., 2000, 35, 193–202. https://doi.org/10.1016/S0025-5408(00)00204-X
26Madarasz, J., Braileanu, A., Crisan, M., Pokol, G., J. Anal. Appl.
Pyrolysis, 2009, 85, 549–556.
https://doi.org/10.1016/j.jaap.2008.10.017
27Cernea, M., Valsangiacom, C., Trusca, R., Vasiliu, F., J.
28Kartini, I., Lu, G. Q., Indo. J. Chem., 2005, 5, 15–22.
29Ying, L., Hon, L. S., White, T., Withers, R., Hai, L. B., Mater.
Trans., 2003, 44, 1328-1332.
https://doi.org/10.2320/matertrans.44.1328
30Jitputti, J., Pavasupree, S., Suzuki, Y., Yoshikawa, S., J. Solid
State Chem., 2007, 180, 1743–1749.
https://doi.org/10.1016/j.jssc.2007.03.018
31Huang, D., Luo, G., Yang, L., Wang, Y., China Part., 2005, 3, 176-180. https://doi.org/10.1016/S1672-2515(07)60082-7
32Bajunajdad, A., Zaki, M. I., Eastoe, J., Pasupulety, L., J. Colloid
Interface Sci., 2006, 302, 501-508.
https://doi.org/10.1016/j.jcis.2006.06.050
33Reddy, K., Manorama, S. V., Reddy, A. R., Mat. Chem. Phys.,
2003, 78, 239-245. https://doi.org/10.1016/S0254-0584(02)00343-7
34Minga, I., Kurajica, S., Mandić, V., Acta Graphica, 2015, 236, 11-20.
35Chen, Q., Shi, H., Shi, W., Xu, Y., Wu, D., Catal. Sci. Technol.,
2012, 2, 1213–1220. https://doi.org/10.1039/c2cy00545j
36Tayade, R. J., Surolia, P. K., Kulkarni, R. G., Jasra, R. V., Sci.
Tech. Adv. Mater., 2007, 8, 455-462.
https://doi.org/10.1016/j.stam.2007.05.006