Proceedings of the
Eighth International Workshop on
Graph Transformation and Visual Modeling Techniques
(GT-VMT 2009)
Gene Expression with General Purpose Graph Rewriting Systems
Jochen Schimmel, Tom Gelhausen and Christoph Schaefer
11 pages
Guest Editors: Artur Boronat, Reiko Heckel
Managing Editors: Tiziana Margaria, Julia Padberg, Gabriele Taentzer
Gene Expression with General Purpose Graph Rewriting Systems
Jochen Schimmel, Tom Gelhausen and Christoph Schaefer
Institute for Program Structures and Data Organization, University of Karlsruhe
Abstract:We show that a general purpose graph rewriting system (GRS) nowadays is capable of simulating gene expression, the intra-cellular synthesis of proteins. The model organism we use is one of the best-studied prokaryotic life-forms in genetics, the E. coli bacteria. Our graph representation of the E. coli DNA consists of 23 million graph elements. In our case study we correctly synthesize the proteins of 30 consecutive genes. In this paper we describe our approach as well as our observations. Further on, we discuss some potential extensions to GRSs that would support more sophisticated simulations.
Keywords:Graph Rewriting, Biology, Genetics, Gene Expression
1
Introduction
Current life science research aims at understanding the life cycle process of a human cell1. Today, highly optimized string-based approaches exist to compute gene expression products. Since more sophisticated simulations considering chemical behavior can effectively not be done with string-based representations, several authors propose graph-string-based techniques. The recently increased performance of graph rewriting systems suggests the applicability of this alternative.
In this paper, we present a case study in which we investigated the simulation of gene ex-pression using the general purpose graph rewriting system GrGen.NET [GBG+06]. Simulating the human genome is beyond the capabilities of graph rewriting on current PCs. Therefore, our subject was the (considerably smaller) DNA of E. coli – the simulation steps are similar. In comparison with the natural archetype, our simulation has several simplifications. In fact, our simulation does not outperform the string-based approaches in terms of ‘functionality’. However, the intent of this case study was to investigate whether and how such simulations are feasible us-ing graph rewritus-ing techniques. The results show that the graph-based approach is appropriate and performs sufficiently well.
2
Gene Expression Basics
All life forms are based on a large macro molecule calleddeoxyribonucleic acid (DNA). Gene expression is the biological process of creating proteins using the information stored in the DNA as a blueprint. The DNA itself is a concatenation of molecules callednucleotides. Four different types of nucleotides occur in the DNA:Adenin (A),Cytosin (C),Guanin (G) andThymin (T). DNA is double stranded: The nucleotides of two strands are kept together by a chemical binding.
1 For instance, the possibility to entirely simulate the genetic processes within a human cell is expected with the
GTGCATCTGACTCCTGAGGAGAAG
CACGTAGACTGAGGACTCCTCTTC
GUG
CAU
CUG
ACU
CCU
GAGGAG
AAG
Val
His
Leu
Thr
Pro
GluGlu
Lys
DNA
(transcription)RNA
(translation)
protein
Figure 1: Gene expression depicted5.
In opposing strands, Adenin binds to Thymin, while Cytosin binds to Guanin. Therefore, the nucleic sequence of one strand can easily be deduced from the other.
Another molecule that is involved in gene expression is theribonucleic acid(RNA). It has the same structure as DNA, except that Thymin is replaced by the nucleotideUracil (U). RNA is (usually) single-stranded.
A protein is built from molecules calledamino acids. Twenty different types of amino acids exist, which can form to large strings. Such an amino acid sequence is called a protein’sprimary structure. For the protein to be fully functional, the three-dimensional layout of the amino acid chain matters. The three-dimensional layout of a protein is called itssecondary (and tertiary) structure. In this study, we only simulate the primary structure2.
To store the primary structure, each amino acid is encoded using three nucleotides (so called triplets of A, C, G, or T). Three consecutive nucleotides enable 64 different combinations, whereas only 20 amino acids exist: Several triplets represent the same amino acid, while others are reserved as special ‘commands’3. In fact, the additional combinations are chosen in such a way that a) a possible mutation (i. e. alteration of a nucleotide) is likely to represent the original amino acid, or b) the mutation is at least likely to represent an amino acid with a similar chemical behavior, preserving the functionality of the encoded protein. A DNA subsequence that encodes a protein is called agene4.
The process of actually creating a protein from a gene is calledgene expression and is done in two steps,transcription andtranslation, as depicted in Figure1. Both will be digested in the following sections.
2.1 Transcription
In order to create a protein from a gene, the gene’s code has to be copied. This is performed by an enzyme calledpolymerase. The polymerase attaches to the start of the gene and slides along the
2 The process of bringing proteins into their correct three-dimensional order is called folding. It is not yet
thoroughly understood how this process works. A well-known research project in this area is Folding@home (http://folding.stanford.edu/).
3 Computer scientists would call them ‘escape sequences’. 4 Not all parts of the DNA are genes.
RNA
DNA
polymerase
Figure 2: A polymerase, sliding along a DNA molecule and synthesizing RNA6.
U U
U
U A
A
A
A
A A A G
G
G G
G G G C
C C
C C
C
C C
Figure 3: A hairpin structure with a stem-loop7.
DNA molecule towards the gene’s end. In this process, the polymerase creates an RNA molecule that contains the same information as the gene (see Figure2).
To enable a polymerase to find the exact starting location of a gene, each gene is preceded by a sequence calledpromoter. The promoter sequence has the chemical ability to attract polymerase enzymes and bind them to the DNA. In order to control which genes are transcribed in a cell, a multitude of proteins can attach to promoters: Some proteins enhance the binding behavior of a promoter while others disable a promoter. (However, such proteins are not part of our simula-tion.) The sequences of different promoters have a common structure, the most obvious one is a region calledTATA-Box, as its sequence is Thymin-Adenin-Thymin-Adenin. Unfortunately, each promoter differs slightly. As we will show later, this fact is important for simulation with graph rewriting.
One option to terminate the transcription process is therho-independent termination. Here, the last copied nucleotides have an ‘inverted’ palindromic order. Therefore, the corresponding nu-cleotides can form a chemical binding which leads to ahairpin structure. These nucleotides stick together to form a stem-loop as shown in Figure3. This stem-loop can slide into the polymerase enzyme and detach it from the DNA. The newly created RNA molecule is then set free.
2.2 Translation
The RNA molecule produced in the preceding transcription step serves as a blueprint for the protein. Like a polymerase attaches to DNA, aribosomeenzyme attaches to RNA during trans-lation. As soon as the ribosome detects the triplet ‘AUG’, it starts to concatenate amino acids according to the triplet pattern found on the RNA strand (c. f. Section2). The mapping from triplets to amino acids is shown in Figure4. The translation process stops as soon as the ribo-some detects one of the three stop-sequences: ‘UAG’, ‘UAA’, or ‘UGA’. Together with the start sequence AUG, these are all of the ‘special commands’ mentioned above.
Ala Arg Asn Asp Cys Gln Glu Gly His Ile Leu Lys Met Phe Pro Ser Thr Trp Tyr Val GCA CGA AAC GAC UGC CAA GAA GGA CAC AUA CUA AAA AUG UUC CCA UCA ACA UGG UAC GUA GCC CGC AAU GAU UGU CAG GAG GGC CAU AUC CUC AAG UUU CCC UCC ACC UAU GUC
GCG CGG GGG AUU CUG CCG UCG ACG GUG
GCU CGU GGU CUU CCU UCU ACU GUU
AGA UUA AGC
AGG UUG AGU
Figure 4: Mapping between amino acids and nucleotide triplets [Lew08]. Each triplet is mapped to the amino acid in the first cell of the corresponding column.
3
Implementation
In this section we describe our model of the gene expression process using the GrGen.NET graph rewriting system [GBG+06]. This section can also serve as a guide for implementations on other graph rewriting systems. Even though our simulation considerably simplifies the biological processes, it still produces the proteins found in the natural archetype.
In our graph model, nodes represent molecules or sets of molecules like enzymes. We use the hierarchical node type system of GrGen.NET to express similarities between nodes. For example, Adenin, Guanin, Cytosin, Thymin, and Uracil are represented by node types that extend the abstract node typeNucleotide.
Edges represent chemical bindings between molecules or the attachment of enzymes. In our simulation, we simplify complex chemical reactions by introducing special nodes that mark loca-tions of pending reacloca-tions. For example, we connect promoters found during our simulation with a marker node in order to abstract and simplify the process of polymerase binding. Furthermore, these promoter marker nodes contain a field that stores the associated gene’s length.
Graph rewriting rules represent chemical reactions (processing uses the SPO-approach). The rewriting rules as well as the model can be obtained fromhttp://www.grgen.net/gxb/. The rules we use in our simulation fall in three categories: promoter-identification, RNA-synthesis, and protein-synthesis.
(a) Graph representation of a single DNA strand.
(b) The first nucleotide of a gene has been marked.
(c) A polymerase attaches to the gene. The marker node is removed.
(d) In a single rewriting step, a nucleotide gets read and a corresponding RNA node created.
(e) At the end of the gene, transcription stops. (f) The polymerase is dissected from the DNA and RNA.
Figure 5: Simulation steps for transcription.
promoter sequences are rather long, we developed a tool to generate these graph rewrite rules. The tool can be used to prepare promoter rules for arbitrary genes of arbitrary species.
RNA-Synthesis (Transcription). After inserting the marker nodes, the RNA synthesis pro-cess starts and attaches a free polymerase enzyme (i. e. an isolated polymerase node) at a marked nucleotide. Furthermore, the polymerase copies and stores the gene’s length from the marker node for the termination of the transcription process. Further rewriting rules move the attached polymerase node along the DNA strand while they create enchained nucleotide nodes that rep-resent the synthesized RNA strand. Each transcription step increments an internal counter of the polymerase node. The transcription process stops as soon as this counter equals the gene’s length. The polymerase node detaches from the DNA and the newly created RNA strand. After-wards, the polymerase node may initiate further transcription processes. This implies, that the total number of available polymerase nodes determines the maximal number of genes that can be transcribed concurrently in our simulation. It is also possible, that several polymerase nodes transcribe a single gene at the same time. Multiple transcription corresponds perfectly to the biological process. The RNA-synthesis is depicted in Figure5. Listing1shows the GrGen.NET Code to detach the polymerase from a DNA strand.
(a) Graph representation of a single RNA strand.
(b) Ribosome attached to the AUG sequence.
(c) Ribosome sliding along the RNA, enchain-ing amino acids.
(d) After synthesis, the ribosome releases the RNA and the protein.
Figure 6: Simulation steps for translation.
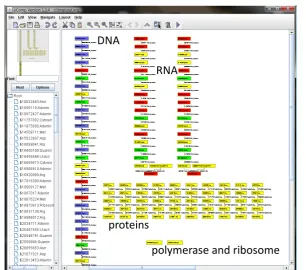
sensitive for the stop sequences ‘UAG’, ‘UAA’, and ‘UGA’. If an RNA processing rule finds a stop sequence, the process terminates and the ribosome node gets disconnected from the RNA strand and the amino acid chain (i. e. the protein). The protein-synthesis is depicted in Figure6. A sample screenshot of a simulation result can be found in Figure7.
3.1 The Sample Organism
As sample data we used the genome of Escherichia Coli (E. coli), a bacterium that is well under-stood and frequently used as model organism. The genome of E. coli has a length of 4.6 million base pairs. As each base pair is modeled as two nodes that are connected by an edge, the graph representation takes 13.8 million graph objects. The interconnections of the two strands add two more edges per base pair, summing up to a total of 23 million graph objects. Other life forms may have much larger genomes. Table1 lists some genome lengths of other organisms. The E. coli genome is available at [KRS+02].
To identify genes on the E. coli genome, we used 30 consecutive promoter sequences. The promoter sequences have been extracted using the gene data available at [KRS+02]. They have a length of 50 to 200 nucleotides.
4
Runtime Observations
For a long time, graph rewriting systems have not been an option to simulate complex biological processes, though the benefits of the formal representation of biochemical reactions are widely accepted. Performance is one of the main reasons for the lack of simulation implementations. In this section we present our experiences with GrGen.NET.
Table 1: Genomes of several viruses, bacteria and organisms.
Name Basepairs (bp) Genes
Simian virus 40 5243 6
M13 phage 6407 10
Lambda phage 48502 ca. 50
Helicobacter pylori 1667867 1590
Mycobacterium tuberculosis 4411529 3924
Escherichia coli 4639211 4288
Yeast 12 million 6240
Pinworm 97 million 18240
Fly 180 million 13600
Mouse 3000 million 25000
Human 3000 million 25000
Corn 2400 million 30 - 40000
Rice 440 million 30 - 40000
common PC. GrGen.NET took about 8 seconds on the same PC. The execution time shrinks to 3.5 seconds on an 8-core PC using a preliminary multi threaded implementation of GrGen.NET. Although being slower, this is still fast enough to use graph rewriting approaches.
The generated graph rewriting rules for promoter search are rather large. GrGen.NET trans-lates each rewriting rule into C# source code. The generated C# file for all 30 promoter patterns has a size of about 700 megabytes. This is unwieldy, even for generated code. A solution to this problem could be a generation mode that optimizes code size.
A problem that still persists is memory consumption. Nodes as well as edges are represented as .NET objects. A node requires 28 bytes, while an edge requires 44 bytes. Therefore, the graph representation of the E. coli genome requires 824 megabytes. This is acceptable on current workstation PCs. For a similar graph representation of the human genome 525 gigabytes of memory would be required8. As the current representation is very coarse grained the memory consumption for advanced genetic applications will be even higher.
5
Improvements of the Simulation
Even though our simulation produces the correct proteins from the real genes, our simulation relies on several simplifications. In this section, we discuss these simplifications in an attempt to give an outline for the next steps required to reach a more realistic simulation.
A major simplification is the omission of spacial relations. In a real environment, an unbound enzyme and the availability of reactants is not sufficient for most reactions to happen: All reac-tants need to be physically close to each other and in a certain angle for the reaction to happen. Unfortunately, graph elements do not provide a notion of locality. Locality could be simulated by connecting the nodes of our graph to a three-dimensional grid of nodes representing
tions in an euclidean space. The resulting effort would be immense. However, if the GRS itself had a notion of spatial positioning, internal data representation could possibly benefit from op-timizing data structures such as octrees [YKFT84]. An octree is a tree data structure that stores hierarchical three-dimensional data in a compact way.
Another simplification concerns timely relations. No known graph rewriting system imple-ments time constraints, although theoretical approaches exist [GHV02]. The synthesis of an RNA strand in E. coli proceeds with 50 to 100 polymerisation steps per second. Molecules lo-cated on the DNA may slow down the process. The speed of current graph rewriting systems depends on the processing speed of software and hardware. For a realtime simulation graph rewriting rules have to be extended by timely relations.
During implementation of the study, we realized that not all details of the gene expression pro-cess can be simulated using GrGen.NET. As stated in Section3, a graph rewriting system needs to know the specific sequence of a promoter in order to attach a polymerase to the corresponding gene. Unfortunately, in reality, this pattern is only imprecisely known and its nucleic sequence differs slightly from instance to instance. Current graph rewriting systems are not able to detect such fuzzy patterns. A fuzzy matching mode would be a helpful extension. For instance, if a search pattern consists of fifty nodes and a match candidate has 48 correctly identified nodes, it could be considered as a valid match.
The inability to fuzzy-match also prevents a more realistic termination of the RNA synthesis: As stated in Section2, a stem-loop in the newly created RNA-strand initiates the rho-independent transcription termination. The rho-independent transcription termination requires a palindromic sequence. Current graph rewriting systems are in fact able to detect perfect palindromic se-quences, but nature is a little more tolerant in this concern.
To circumvent the following simplification, additional genetic and software engineering re-search is required. Our simulation only uses known promoters, so only known genes can be found. In real cells, polymerases react with promoters because of the chemical properties of the promoters’ nucleic sequences. Simulating such chemical reactions requires a DNA repre-sentation at molecular level and an accurate description (in terms of graph rewriting rules) of organic chemistry. This requires in-depth knowledge of chemistry and is subject to further stud-ies. In [YKS04] a first approach is presented. Nevertheless, rewriting rules could be able to identify new promoters during runtime, as the sequence of a promoter follows a certain pattern.
6
Related Work
and Valiente propose the computation of signal transduction in cells using graph transforma-tion [RV04]. One can sum up approaches like these to the goal of simulating the inner workings of biological cells as a whole. Rossell´o and Valiente give an overview on more approaches to simulate different parts of these fundamentals in [RV05]. We propose to sum up all these ap-proaches into an integrated simulation based on graph rewriting systems. Currently available tools focus on static computation or data storage rather than simulation. Gene expression prod-ucts, as they are generated in the application presented in this paper, are stored in the ecocyc database [KRS+02]. However no tool tries to simulate the genetic processes as a whole. We propose that graph rewriting may lead to such a software at some point in the future.
7
Conclusion
Even though the processing of string representations is considerably faster, we see the future of genetic simulations in graph representation and graph rewriting. String representations are in-flexible in handling multidimensional structures: A polymerase binding simulation at a detailed level involves hundreds of RNA and protein molecules and needs to consider their three dimen-sional layout and position. Graphs can easily represent multi-dimendimen-sional relations containing large numbers of objects.
All genetics simulation approaches aim at simulating the whole life cycle process of a cell at some point. As the size of the human genome does not grow, we are confronted with a fixed problem size. Therefore, we may concentrate on simulation approaches offering a good abstraction level such as graph rewriting. The loss of performance will be overcome by better computing devices in the future. The trend towards parallel computing systems can be used to advantage, as genetic processes offer ample parallelism by nature.
Listing 1: Rule to detach a polymerase from DNA
1 rule RNA_Pol_Finish {
2 pattern {
3 pol:Polymerase -cur_conn:PolymeraseToDna->cur_nuc:Nucleotide
4 -:DNA_Backbone-> next_nuc:Nucleotide;
5 pol -rna_conn:PolymeraseToRna->cur_rna_nuc:Nucleotide;
6 if { pol.MaxNucleotide > 0 &&
7 pol.CurrentNucleotide == pol.MaxNucleotide;
8 }
9 } 10 modify {
11 delete(cur_conn); delete(rna_conn);
12 eval { pol.MaxNucleotide = 0; pol.CurrentNucleotide = 0; }
Table 2: Simulation summary.
Sample organism Escherichia coli
Total number of DNA base pairs 4,639,211
Total number of DNA base pairs in simulation 4,639,211
Total number of promoters/genes 4,288
Average size of promoters 50-200 nucleotides
Genes used in benchmark 30
Graph rewriting system GrGen.NET (version 1.4)
Max. number of nodes in simulation 9.3 million
Max. number of edges in simulation 13.9 million
Number of rules 69
Total size of rewriting-rules source code 700 megabytes Total size of rewriting-rules object code (MSIL-DLL) 13 megabytes
Memory consumption of graph elements 824 megabytes
Runtime (only promoter search), string-based implementation 0.3 seconds Runtime (only promoter search), GrGen.NET 7.7 seconds Runtime (only promoter search), parallel GrGen.NET 3.5 seconds Total runtime of the simulation, GrGen.NET 7.9 seconds
Acknowledgements: We thank Alexander Knoll from the Institute for Botany II, University of Karlsruhe, for guiding us through the bio-molecular jungle.
Bibliography
[GBG+06] R. Geiß, G. V. Batz, D. Grund, S. Hack, A. M. Szalkowski. GrGen: A Fast SPO-based Graph Rewriting Tool. In Corradini et al. (eds.), Graph Transformations -ICGT 2006. Lecture Notes in Computer Science, pp. 383–397. Springer, September 2006.
http://www.info.uni-karlsruhe.de/papers/grgen icgt2006.pdf
[Gel08] P. Gelsinger. Keynote at the Intel Developer Forum (IDF), Shanghai 2008. Transcript available athttp://download.intel.com/pressroom/kits/events/idfspr 2008/ PatGelsinger keynote transcript.pdf, Apr. 2008.
[GHV02] S. Gyapay, R. Heckel, D. Varr. Graph transformation with time: Causality and logical clocks. In Proc. 1st Int. Conference on Graph Transformation (ICGT 02. Pp. 120–134. Springer-Verlag, 2002.
[KRS+02] P. D. Karp, M. Riley, M. Saier, I. T. Paulsen, J. Collado-Vides, S. M. Paley, A. Pellegrini-Toole, C. Bonavides, S. Gama-Castro. The EcoCyc Database. Vol-ume 30(1), pp. 56–58. January 2002.
http://dx.doi.org/10.1093/nar/30.1.56
[Lew08] B. Lewin.Genes IX. 2008.
http://www.biotechnews.com.au/index.php/id;84859370;fp;4194304;fpid;1
[MN01] J. S. McCaskill, U. Niemann. Graph Replacement Chemistry for DNA Processing. InDNA ’00: Revised Papers from the 6th International Workshop on DNA-Based Computers. Pp. 103–116. Springer-Verlag, London, UK, 2001.
[RV04] F. Rossell´o, G. Valiente. Analysis of Metabolic Pathways by Graph Transformation. InICGT. Pp. 70–82. 2004.
[RV05] F. Rossell´o, G. Valiente.Graph Transformation in Molecular Biology. 2005. http://www.springerlink.com/content/93ch5yly36nc1l1w
[YKFT84] K. Yamaguchi, T. Kunii, K. Fujimura, H. Toriya. Octree-Related Data Structures and Algorithms. Jan. 1984.
doi:10.1109/MCG.1984.275901

![Figure 4: Mapping between amino acids and nucleotide triplets [Lew08]. Each triplet is mappedto the amino acid in the first cell of the corresponding column.](https://thumb-us.123doks.com/thumbv2/123dok_us/7815404.2086760/5.595.90.507.281.357/figure-mapping-nucleotide-triplets-triplet-mappedto-rst-corresponding.webp)