European Journal of Physical Education and Sport Science
ISSN: 2501 - 1235 ISSN-L: 2501 - 1235 Available on-line at: www.oapub.org/edudoi: 10.5281/zenodo.3228922 Volume 5 │ Issue 9 │ 2019
ELECTROMYOGRAPHIC CHANGES FOLLOWING
SPRINT SPECIFIC PLYOMETRIC PROGRAM
IN SPRINTERS
Amrinder Singh1i,
Achal Choudhary2,
Shweta Shenoy3,
Jaspal Singh Sandhu4
1PhD, Assistant Professor,
MYAS-GNDU, Department of Sports Sciences and Medicine,
Guru Nanak Dev University, Amritsar, Punjab, India
2M.P.T (Sports), Research Scholar,
MYAS-GNDU, Department of Sports Sciences and Medicine,
Guru Nanak Dev University, Amritsar, Punjab, India
3PhD, Professor,
MYAS-GNDU, Department of Sports Sciences and Medicine,
Guru Nanak Dev University, Amritsar, Punjab, India
4M.S. (Ortho),
Professor MYAS-GNDU, Department of Sports Sciences and Medicine,
Guru Nanak Dev University, Amritsar, Punjab, India
Abstract:
Purpose: The ability to reach a high running velocity over a short period of time is
essential for sprinters. Sprinting requires appropriate muscle recruitment for an athlete to perform. The purpose of this study was to determine the effect of the sprint specific plyometric training on electromyographic (EMG) changes in sprinters. Methodology:
40 university sprinters volunteered and were randomly assigned into two groups, group 1 (G1; n=20) sprint specific plyometric training group(mean age 18.65±0.875; mean height 164.10±11.30 cm; mean mass 59.20±10.74 kg) and group 2 (G2; n= 20) control group (mean age 18.95±1.19; mean height 166.60±9.80 cm; mean mass 61.60±9.24 kg ). Both sprint specific plyometric training group and control group were assessed for
neuromuscular activity of lower limb muscles by telemetric Noraxon TELEMYO U.S.A., Inc.v3.1.10 machine. Subjects in training group performed six weeks sprint specific plyometric protocol thrice a week. The EMG activities in the tibialis anterior (TA), vastus lateralis (VL), rectus femoris (RF), medial gastrocnemius (MG) and semitendinosis muscle (ST) were assessed pre and post training. Results: The results showed significant changes (p<0.05) in the EMG activities for the mean amplitude of RF(rt), MG(lt), ST(rt) muscles and maximum periods of TA(rt), VL(rt), MG(lt) and ST(rt) muscles. Conclusion: The study demonstrates that the neuromuscular training program can increase the muscle recruitment to perform high intensity activities hence, can be recommended to coaches for athletes or individual.
Keywords: electromyographic changes, specific plyometric program, sprinters
1. Introduction
Sprinting is a running short distance event on track and field in a limited period of time. Plyometric exercises plays an integral role in strength and conditioning or in performance enhancement regardless the phase it has been used.(1) Plyometric used in the measurement of sports performance outcomes such as throwing velocity, jump height or sprint speed.(2,3,4)
Plyometric training is involved in every sports to increase strength and explosiveness of muscles.(5) Sprint running contributes in various sports for successful performances. Plyometric exercises used for training the athlete should match the characteristics of their sporting activity they are involved with. That is, to optimize the activity by the principle of specificity. For example, only jumping specific exercises will not increase the running speed.(6,7) Plyometric is a type of training which have the ability to develop force at high speed in dynamic movements. These dynamic movements include the stretch of muscle immediately followed by an explosive contraction of the muscle. This is also termed as stretch-shortening cycle (SSC).(8)
Thus, through EMG results, better training methods and facilities can be considered for athletes. Reviewing different studies, it seems that physiological activities that are influential to neuromuscular adaptations in power training and that lead to an increase in the power and strength.
2. Material and Method
A total 40 university level sprinters (mean age, height, mass) volunteerd and were randomly allocated in two groups, Group 1 (G1; n = 20) sprint specific plyometric training group and Group 2 (G2; n = 20) control group. The procedure, benefits and potential risks of study was explained to the subjects before the test started and duly signed informed consent was taken. It was insured that the subjects were free of any musculoskeletal conditions or any neurological dysfunctions. This study was approved by the Institutional Ethics Committee of MYAS-GNDU Department of Sports Sciences and Medicine, Guru Nanak Dev University, Amritsar, Punjab.
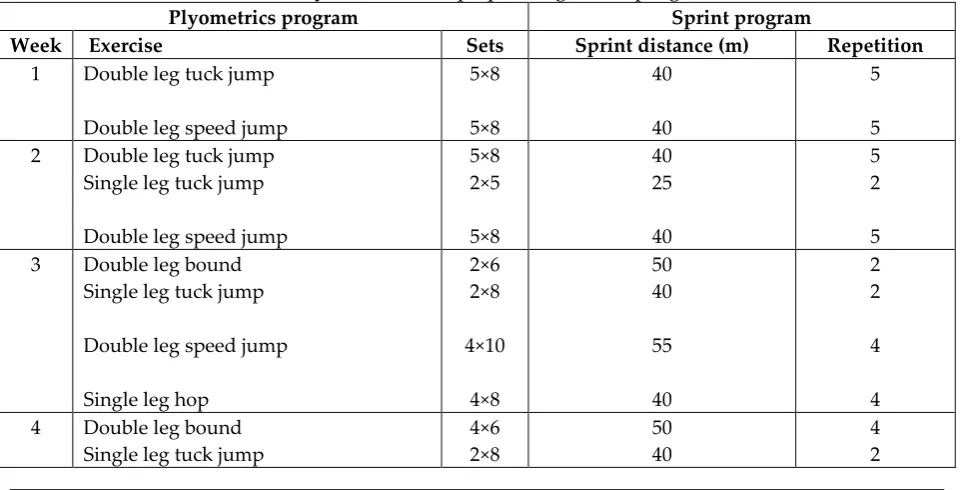
The allocated grouped participants of the study agreed not to change or increase their current exercise routine during the course of the study. The sprint specific plyometric training group participated in a six week exercise program thrice a week which included various jumping, bounding and sprinting exercises designed (table 1) where the control group continued their routine training schedule. Participants were tested before and after the six weeks training period. The procedure was conducted using telemetric Noraxon TELEMYO U.S.A., Inc.v3.1.10 machine. The readings of total 10 muscles (5 on each side was taken) which included the tibialis anterior, vastus lateralis, rectus femoris, medial gastrocnemius and semitendinosis. The readings were taken while running on treadmill on speed of 2.7m/s for 30 seconds before and after six weeks period (11).
Table 1: 6-week exercise program performed by the Subjects
in the Plyometric Group Sprinting based program
Plyometrics program Sprint program
Week Exercise Sets Sprint distance (m) Repetition
1 Double leg tuck jump
Double leg speed jump
5×8 5×8 40 40 5 5 2 Double leg tuck jump
Single leg tuck jump
Double leg speed jump
5×8 2×5 5×8 40 25 40 5 2 5 3 Double leg bound
Single leg tuck jump
Double leg speed jump
Single leg hop
2×6 2×8 4×10 4×8 50 40 55 40 2 2 4 4
Single leg hop Alternate leg bound
4×8 5×8 40 40 4 5 5 Single leg hop
Single leg speed hop
Alternate leg bound
Alternate leg stair bound
2×8 2×8 8×8 3×8 40 35 40 30 2 2 8 3 6 Single leg hop
Single leg speed hop
Alternate leg bound
Alternate leg stair bound
2×8 2×8 7×10 3×10 40 35 50 40 2 2 7 3
Source: Rimmer, E and Sleivert, G. Effects of plyometric intervention program on sprint performance. J Strength Cond Res 14: 295-301, 2000.
3. Results
3.1 Mean Amplitude
Table 2: Descriptive statistics values of EMG of
bilateral rectus femoris muscle in sprinters
Rectus femoris Experimental group Control group
Pre Post Pre Post
Right 19.44±63.80 54.93±85.55 -1.23±21.85 24.19±139.84 Left 22.98±96.17 94.45±136.64 1.76±34.11 25.79±73.95
Table 2 represents mean amplitude of vastus lateralis muscle. In between group comparison the experimental group (p<0.04 lt and p<0.16 rt) and control (p<0.86 lt and p<0.47 rt), experimental group showed significant difference on left side post training.
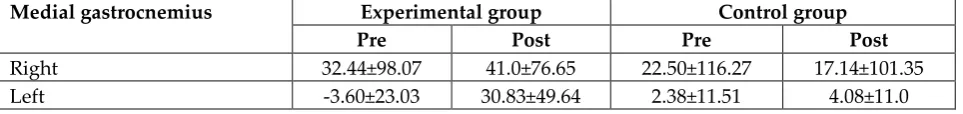
Table 3: Descriptive statistics values of EMG of
bilateral medial gastrocnemius muscle in sprinters
Medial gastrocnemius Experimental group Control group
Pre Post Pre Post
Right 32.44±98.07 41.0±76.65 22.50±116.27 17.14±101.35
Left -3.60±23.03 30.83±49.64 2.38±11.51 4.08±11.0
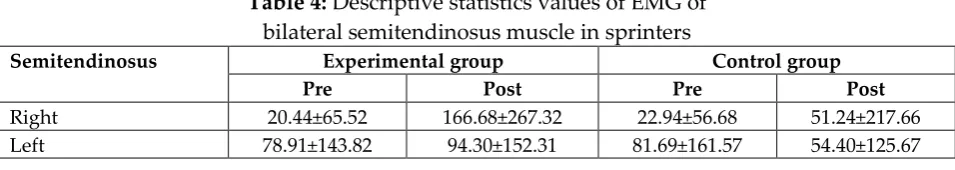
Table 4: Descriptive statistics values of EMG of bilateral semitendinosus muscle in sprinters
Semitendinosus Experimental group Control group
Pre Post Pre Post
Right 20.44±65.52 166.68±267.32 22.94±56.68 51.24±217.66 Left 78.91±143.82 94.30±152.31 81.69±161.57 54.40±125.67
Table 4 represents mean amplitude of semitendinosis muscle. In between group comparison the experimental group (p<0.70 lt and p<0.03 rt) and control (p<0.30 lt and p<0.58 rt), experimental group showed significant difference on right side post training.
3.2 Maximum Periods
Table 5: Descriptive statistics values of EMG of
bilateral anterior tibialis muscle in sprinters
Tibialis anterior Experimental group Control group
Pre Post Pre Post
Right 4405.75±3288.84 7032.8±2617.25 6309.9±2949.0 5044.6±3209.64 Left 5342.95±3634.91 6844±2884.33 6148.8±2915.38 6333.8±3442.40
Table 5 represents maximum period of tibialis anterior muscle. In between group comparison the experimental group (p<0.13 lt and p<0.00 rt) and control (p<0.81 lt and p<0.15 rt), experimental group showed significant difference on right side post training.
Table 6: Descriptive statistics values of EMG of
bilateral vastus lateralis muscle in sprinters
Vastus lateralis Experimental group Control group
Pre Post Pre Post
Right 5277.93±3264.64 7382.3±2324.81 5506.5±3112.87 5403.15±3104.81 Left 5328.45±2898.40 6332.55±3325.56 5480.9±3392.28 5201.9±3398.67
Table 6 represents maximum period of vastus lateralis muscle. In between group comparison the experimental group (p<0.23 lt and p<0.00 rt) and control (p<0.78 lt and p<0.90 rt), experimental group showed significant difference on right side post training.
Table 7: Descriptive statistics values of EMG of
bilateral medial gastrocnemius muscle in sprinters
Medial gastrocnemius Experimental group Control group
Pre Post Pre Post
Right 6037.05±3041 5853.35±3141.11 5685.9±3113.05 4911.95±3035.82 Left 4318.55±3591.15 6543.9±3060.48 4058.2±3327.13 4111.4±3328.43
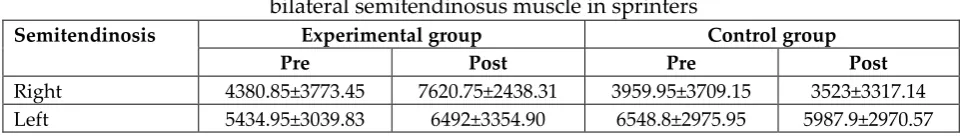
Table 8: Descriptive statistics values of EMG of bilateral semitendinosus muscle in sprinters
Semitendinosis Experimental group Control group
Pre Post Pre Post
Right 4380.85±3773.45 7620.75±2438.31 3959.95±3709.15 3523±3317.14 Left 5434.95±3039.83 6492±3354.90 6548.8±2975.95 5987.9±2970.57
Table 8 represents maximum period of semitendinosis muscle. In between group comparison the experimental group (p<0.08 lt and p<0.00 rt) and control (p<0.31 lt and p<0.74 rt), experimental group showed significant difference on right side post training.
4. Discussion
5.Conclusion
The study concludes that the neuromuscular training program can increase the proprioception and explosiveness of lower extremity which increases the muscle recruitment to do high intensity physical activities in sprinters as well as other sportspersons. Hence, this type of training program can act as an adjunct to the already specified training schedule of sprinters.
Conflict of Interest
There were no conflicts of interest.
Source of Funding
The study was conducted at MYAS-GNDU Department of Sports Sciences and Medicine, Guru Nanak Dev University, Amritsar, Punjab, India. This centre is funded by Ministry of Youth Affairs and Sports Government of India.
References
1. Chmielewski T. L., Myer G. D., Kauffman D., Tillman S. M. Plyometric exercise in the rehabilitation of athletes: Physiological responses and clinical application. J Orthop Sports Phys Ther. 2006;36(5):308-319.
2. Davies G. J., Dickoff-Hoffman S. Neuromuscular testing and rehabilitation of the shoulder complex. Journal of Orthopaedic & Sports Physical Therapy. 1993 Aug;18(2):449-58.
3. Davies G. J., Heiderscheit B., Clark M. Closed Kinetic Chain Exercises-Functional Applications in Orthopaedics. Strength and Conditioning Applications in Orthopaedics. Orthopaedic Section, Home Study Course, LaCrosse, WI. 1998. 4. Goldbeck T. G., Davies G. J.. Test-retest reliability of the closed kinetic chain
upper extremity stability test: a clinical field test. Journal of Sport Rehabilitation. 2000 Feb;9(1):35-45.
5. Chu D. A. Jumping into plyometrics. Human Kinetics; 1998.
6. Chu D. A. Explosive Power and Strength. Champaign IL. L: Hilh Kiehics. 1996:11-6.
7. Ford Jr H. T., Puckett J. R., Drummond J. P., Sawyer K., Gantt K., Fussell C. Effects of three combinations of plyometric and weight training programs on selected physical fitness test items. Perceptual and Motor Skills. 1983 Jun;56(3):919-22.
9. Rezaimanesh D., Amiri-Farsani P., Saidian S. The effect of a 4 week plyometric training period on lower body muscle EMG changes in futsal players. Procedia-Social and Behavioral Sciences. 2011 Jan 1;15:3138-42.
10.Hakkinen K. Effect of explosive type strength training on isometric force and relaxation-time, electromyographic and muscle fibre characteristics of leg extensor muscles. Acta Physiol. Scand.. 1985;125:587-600.
11.Singh A., Sathe A., Sandhu J. S. Effect of a 6 week agility training program on lower body muscle electromyography changes of Indian taekwondo players. European Journal of Physical Education and Sport Science. 2018 May 16;4(6):25-36.
12.Asadi A. The effects of a 6-week of plyometric training on electromyography changes and performance. Sport Science. 2011 Dec 1;4(2):38-42.
13.Higashihara A., Ono T., Kubota J., Okuwaki T., Fukubayashi T. Functional differences in the activity of the hamstring muscles with increasing running speed. Journal of Sports Sciences. 2010 Aug 1;28(10):1085-92.
Creative Commons licensing terms