Hungarian Association of Agricultural Informatics European Federation for Information Technology in Agriculture, Food and the Environment
Journal of Agricultural Informatics. Vol. 7, No. 2 journal.magisz.org
Methods of processing and geovisualization of soil profiles
Dániel Balla1, Orsolya Gyöngyi Varga2, Norbert Barkóczi3, Tibor Novák4, Marianna Zichar5, Anita Karika6
I N F O
Received 16 Apr. 2016 Accepted 21 May. 2016 Available on-line 15 Aug. 2016 Responsible Editor: M. Herdon
Keywords:
information system, KML, spatial database, WRB
A B S T R A C T
In order to satisfy the social demand for freely obtainable and usable soil information and resources, several national and international soil databases have already been available online for those who are interested. To establish a proper infrastructure for geospatial data with online sharing systems, it is essential that their information is authentic, relevant and freely available for the general public. This paper aims to introduce the beta version of an online, community shared multi-factor soil database developed by the University of Debrecen, Institute of Earth Sciences and Faculty of Informatics. The most important functions of the online system are the acquisition, archiving and geovisualisation of soil profiles, as well as sorting them in accordance to the reference groups established by WRB (World Reference Base for Soil Resources).
1. Introduction
There are several national and global online systems (not necessarily GIS-based) which are concerned with the sorting and publishing of soil information and data, as well as soil maps. Its reason is related to the increasing demand for soil data for the last few decades (Pásztor et al. 2010). This demand met the environmental information systems and soil databases (both global and regional) found across the internet. While the data of the global systems are mostly accessible, many of the regional soil databases have limited access provided to their users (Pásztor et al. 2014).
Due to the accessibility problems mentioned above, this study aims to introduce the online, freely accessible Soil Information System developed by the University of Debrecen, Institute of Earth Sciences, as well as the technologies and freely available spatial databases that come with it. To satisfy this modern need for information, our goals also include the development of a classification
1 Dániel Balla
University of Debrecen Department of Landscape Protection and Environmental Geography [email protected]
2 Orsolya Gyöngyi Varga
University of Debrecen Department of Physical Geography and Geoinformatics [email protected]
3 Norbert Barkóczi
University of Debrecen Department of Physical Geography and Geoinformatics [email protected]
4 Tibor Novák
University of Debrecen Department of Landscape Protection and Environmental Geography [email protected]
5 Marianna Zichar
University of Debrecen Faculty of Informatics Department of Computer Graphics and Image Processing [email protected]
6 Anita Karika
University of Debrecen Department of Physical Geography and Geoinformatics [email protected]
application that uses chosen soil parameter lists. The classification is based on the correlation system of the International Union of Soil Sciences, the WRB.
2. Purpose of SISCS
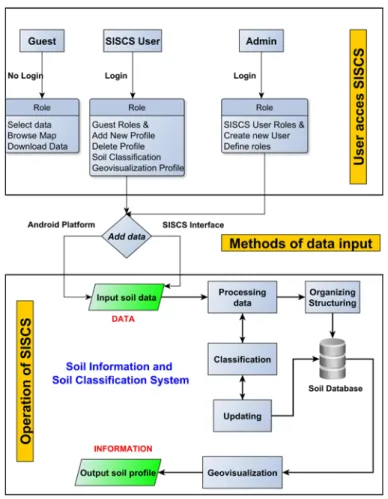
The SISCS (Soil Information and Soil Classifier System) is a free, multi-factor, online information system (Balla et al. 2015a) with three distinct features. First and foremost it can be used to store soil data from field and laboratory studies, then to determine the WRB reference group of the sample based on the gained information. The third function is to publish the findings online. It has three levels of account privileges: Administrator, SISCS User and Guest User (Figure 1).
Figure 1. User roles and operation of SISCS
The application was created using PHP (PHP Hypertext Preprocessor) and JavaScript languages, as well as HTML (Hyper Text Markup Language). The user interface was designed with the free web template of Medialoot. The database is hosted by the MySQL Databases system. The visual representation of the soil profiles is achieved via KML (Keyhole Markup Language). The applied technologies support the free access of soil profiles and databases (e.g.: ASTER GDEM, Corine CLC50, Vegetation-based landscape-regions of Hungary) and may be shared among users and geovisualized on web maps (Google Maps).
3. Geovisualization of spatial data tailored for web
Geovisualization is a special display mode where the geographical and geometric data of an object provide the base of the visualization. Because of the multidisciplinary nature of this process, both soil studies and agronomics can use it for dynamic and complex visualization of spatial data.
KML (Keyhole Markup Language) is a markup language developed by Google. It is based on XML file format and is used to store and visualize models represented by geographical features (points, lines, polygons, models and images) (Wernecke 2008). Aside from Google Earth and Google Maps, this format is used mainly by applications concerned with geospatial information. KML allows to share georelated information with other users. Google Earth processes a KML file similarly to how web browsers process HTML and XML files. Just like HTML, KML uses tags with names and attributes to store information for specific display purposes. Google Earth can be considered as a browser of kml files basically. However, Google Maps cannot display every element of a KML file unfortunately (Zichar 2012).
Creating KML files containing new data can happen in different ways. The first is to create the content with the user interface of Google Earth, then save it in KML or KMZ format. It has to be mentioned that not all the tags are available on the user interface, and the file structure will not be optimal. Next method is to write the code in a text editor by knowing the proper syntax rules, which requires more knowledge but gives more flexibility. GIS software products (e.g.: ESRI ArcGIS Explorer, Global Mapper, AutoCAD, etc.) can also create KML files by exporting data. The number of possibilities increases, as new applications (either online or offline) being capable of interpreting and handling KML files or convert data into KML format get released continuously.
Google Maps provides the user with the freedom to embed a map on their website, or even to attach their own database to it (making a distinction between corporal and personal usage, and the functions that are available to them). To make use of this feature, the provider helps with free APIs (Application Programing Interface) that only require some JavaScript coding.
3.1 Free, public databases used in SISCS
The main objective was to build a soil database that can support also the reclassification of the automated WRB RSG (Reference Soil Group) based on the stored soil profiles of data later. Input data are classified into three groups: description of soil forming processes and the environment of profile, soil chemistry, and soil physical data. The need of WRB diagnostication implied the determination of the horizons, properties and materials as well (Figure 2).
Figure 2. Description of input soil data
south latitude. The ASTER-GDEM2 is the basis for several spatial analyses. With the help of this model we can create 3D digital elevation maps and obtain height values from specific locations (Rexer & Hirt 2014). The main advantage of this model is its free accessibility. Its spatial resolution is 30 m (1’’), the vertical accuracy is 17 m. We used the second version of GDEM because of its better post-processing capabilities and higher accuracy values. The main disadvantage of this database is that it contains the height of vegetation and artefacts, therefore only displaying the height of the actual ground if it is not covered by any vegetation or buildings (Grohmann 2015). From the GDEM we generated further data e.g. slope map, aspect map, contour lines. These databases were created in ESRI ArcGIS 10.2 environment with the Surface toolbox of Spatial Analyst Tools. The output slope database measurement unit was set to degrees. The aspect map was divided into 8 parts according to the 8 main directions of the compass. In the case of the contour line map the contour interval between the lines was set to 10 m (ASTER GDEM 2011).
The first version of the map of the Hungarian vegetation-based landscape regions was prepared at the scale of 1:200,000 (1 km or higher resolution) in 2008. The primary goal of the map was to provide an exact background for the presentation and evaluation of the data of the MÉTA database. They intended to give an up-to-date and detailed vegetation-based division of Hungary with a comprehensive nomenclature of the regions. Regions were primarily defined on the basis of their present zonal vegetation, or their dominant extrazonal or edaphic vegetation (Molnár et al. 2008). The Hungarian potential vegetation map was producing in context of the MÉTA (Zólyomi 1989). The digital form of the natural vegetation database built on this potential vegetation map, fit to big rivers, and national borders. This database is suitable for visual interpretation of the natural vegetation.
The CORINE Land Cover project was initiated by the European Environmental Agency in 1985, mainly for environmental management purposes (Commission of the European Communities 1985). The aim of this project was to produce consistent and reproducible data regarding the state of environment in the Member States of the European Community and to coordinate the compilation of data and organization of information at an international level. The database is based on interpretations of Landsat and SPOT satellite imagery and represents the state of land cover (LULC) in years 2000, 2006 and 2012 through 44 LULC categories at the 3rd level of CLC nomenclature and available in form of either vector dataset, raster dataset or interactive maps (Büttner et al. 2004).
The Corine Land Cover 1:50 000 project for Hungary was implemented by the Institute of Geodesy, Cartography and Remote Sensing along the recommendations of Phare countries for mapping at the same scale. This project adapted more to domestic conditions with 79 categories (4th and 5th level) of the nomenclature and shows an enhanced categorization of LULC conditions and higher positional and thematic accuracy. On behalf of providing detailed and accurate information, SPOT-4, Landsat TM and IRS-1C imagery were also used as an amendment. In this case the minimal mapping unit was 4 hectares (1 hectare in case of lakes) and thematic reliability reached 90%. Both the CLC100 and CLC50 are freely available LULC databases which can be applied for a wide range of environmental monitoring purposes.
4. GIS process of spatial database
matching our need. The combination of placemarks and ground overlays enhances the process of visual perception but does not decrease the performance significantly. Our current experience shows, that the increasing volume of the database will not influence the overall performance of the system either (Balla et al. 2015b).
Finally, all databases were exported to KML files (by Layer to KML tool) in order to geovisualize them (Figure 3).
Figure 3. Vector and raster layers used for our research
5. Account privileges
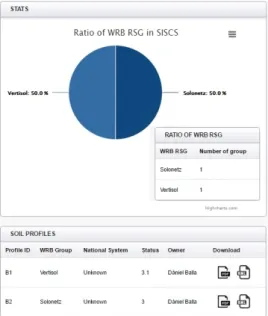
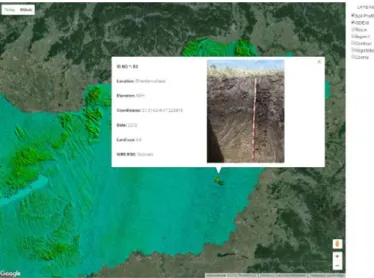
The information portal has three separate interfaces associated with the three different user privileges. The lowest level of them is the Guest account, which is assigned to users who access the system through a web browser (http://siscs.exitdebrecen.hu/SISCSv2/). All of the soil data, geovisualized soil profiles and spatial databases (GDEM, CLC50, and Vegetation-based landscape-regions of Hungary) can be browsed by such an account. A Guest user can also list the soil profile data stored in the database and can even download registry data (field and laboratory test data, diagnostic horizons, etc.). Google Maps and its integrated KML operating functions ensure that the stored data and spatial databases are represented in the proper KML format. With the available KML template, the information uploaded from a registry (Profile Id, Location, Elevation, Coordinates, Date, Land use, WRB RSG) automatically create a KML file associated with the soil profile, and is automatically displayed with other soil profiles when loaded from the web map. The actual beta version includes two soil profiles, but if the system is already available for the users, the database will be continuously expanded (Figure 4-5).
Figure 5. A geovisualized soil profile with GDEM from the beta version
The next level of hierarchy is the SISCS User. This group of users can log in via an account name and password. This level allows them to upload soil profile data (profile environment data, genetic or diagnostic data, soil profile pictures, and comments) with the use of an upload form, or to import collected/produced data by the GeoMobileApp field data collecting mobile application (Figure 6). If the user wants to share the results, then the imported and uploaded data can be saved or updated, and existing databases can be expanded (Figure 7). It is important to note that SISCS Users can only edit their own databases. The most important function however is the automated designation of data to the implemented reference groups (at the time of publishing this article, the first seven groups have been implemented). Uploading spatial data and soil profile data can be done separately. Each of the uploaded categorized reference profiles and preassigned sampling site can be searched for and can be revised and relocated in real time using the available spatial data and field site information. This provides maximized content in a consistent database that has unified methodology and is supplemented by metadata for later search-study projects.
The highest account privilege belongs to the Admin group. Aside from the functions described above, they have to oversee the maintenance of the entire database, as well as creating and handling user profiles.
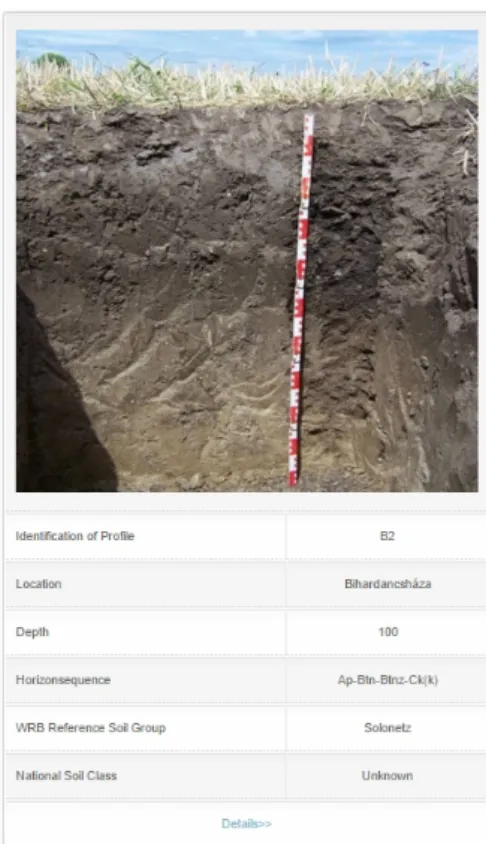
Figure 7. Main information of listed soil profile
Conclusion
The currently designed soil information system reacts to the user demands, and continuously evolves to meet them. The multi-level (Guest, SISCS User, Admin) accessibility ensures that the soil profiles stored in the database can be accessed for free. Furthermore, with the implementation of the classification function, the soil data uploaded to the system can be defined in the WRB reference groups later, because the implementation of WRB classification algorithms is still in progress. It must be emphasised that after the creation of the algorithm, a properly developed and filled out registry is essential for proper categorization. Importing previously collected data and re-classifying it into WRB is not possible if certain pieces of information are missing.
Furthermore, besides the geovisualization of soil profiles, a multi-layer data display has been achieved with the use of public spatial databases (GDEM, Corine, Vegetation-based landscape-regions of Hungary), which may provide help when choosing sampling sites. Thanks to the free accessibility of the databases used in our application, users can search for the environmental geography features of studied regions instantly. However it is worth mentioning that the spatial resolution of these databases might not be entirely trustworthy, so they should only be used for preliminary research.
Our future goals include turning the process of identifying qualifiers to WRB reference groups and associating them with a soil profile an automated operation. Furthermore, the main purpose is to make soil data more visually representable to help users understand the information provided by the system more efficiently.
References
ASTER-GDEM 2011. http://gdem.ersdac.jspacesystems.or.jp/ (2015. 10. 01.)
Balla, D, Zichar, M, Kovács, Z, Sándor, G, Szabó, Gy, Novák, T 2015a ’Open-Access Soil Information and Soil Classifier System’ International Journal of Electronics, Communication and Soft Computing Science &
Balla, D, Zichar, M, Barkóczi, N, Varga, O, Gy 2015b ’Cognitive interpretation of different spatial databases in web environment’ In: Peter Baranyi (ed.) CogInfoCom 2015:Proceedings of 6th IEEE Conference on Cognitive Infocommunications, pp. 159-162. doi:10.1109/CogInfoCom.2015.7390582
Ballagh, L, M, Raup, B, H, Duerr, R, E, Khalsa, S, J, S, Helm, C, Fowler, D, Gupte, A 2011 ’Representing scientific data sets in KML: Methods and challenges’ Computers & Geosciences, vol. 37, pp. 57-64. doi: 10.1016/j.cageo.2010.05.004
Büttner, Gy, Maucha, G, Bíró, M, Kosztra, B, Pataki, R, Petrik, O 2004 ’National land cover database at scale 1:50000 in Hungary’ EARSeL eProceedings, vol.3, no. 3, pp. 323-330.
Commission of the European Communities 1995 CORINE Land Cover. European Environmental Agency. http://www.eea.europa.eu/publications/COR0-landcover (2015. 10. 01.)
Food & Agriculture Org. Of The United Nations 2006 Guidelines for soil description, FAO, Rome.
Grohmann, C.H. 2015 ’Effects of spatial resolution on slope and aspect derivation for regional-scale analysis’ Computers & Geosciences, vol. 77, pp. 111-117. doi: 10.1016/j.cageo.2015.02.003
IUSS Working Group WRB 2014 World Reference Base For Soil Resources 2014. International Soil Classification System For Naming Soils And Creating Legends For Soil Maps (3RD ED.). FAO, Rome.
Molnár, Cs, Molnár, Zs, Barina, Z, Bauer, N, Biró, M, Bodonczi, L, Csathó, A, I, Csiky, J, Deák, J, Á, Fekete, G, Harmos, K, Horváth, A, Isépy, I, Juhász, M, Kállayné Szerényi, J, Király, G, Magos, G, Máté, A, Mesterházy, A, Molnár, A, Nagy, J, Óvári, M, Purger, D, Schmidt, D, Sramkó, G, Szénási, V, Szmorad, F, Szollát, Gy, Tóth, T, Vidra, T, Virók, V, 2008 ’Vegetation-based landscape-regions of Hungary’, Acta Botanica Hungarica, vol. 50(Suppl.), pp. 47-58. doi: 10.1556/ABot.50.2008.Suppl.4
Novák, T 2013 Talajtani praktikum (Talajok terepi vizsgálata, leírása és osztályozása), Meridián Alapítvány, Debrecen.
Pásztor, L, Szabó, J, Bakacsi, Zs 2010 ’Application of Digital Kreybig Soil Information System for the delineation of naturally handicapped areas in Hungary’ Agrokémia és Talajtan, vol. 59, no. 1, pp. 47-56. doi: 10.1556/Agrokem.59.2010.1.6
Pásztor, L, Dobos, E, Szatmári, G, Laborczi, A, Takács, K, Bakacsi, Zs, Szabó, J 2014 ’Application of legacy soil data in digital soil mapping for the elaboration of novel, countrywide maps of soil conditions’ Agrokémia és Talajtan, vol. 63, no. 1, pp. 79-88. doi: 10.1556/Agrokem.63.2014.1.9
Rexer, M & Hirt, C 2014’Comparison of free high-resolution digital elevation data sets (ASTER GDEM2, SRTM v2.1/v4.1) and validation against accurate heights from the Australian National Gravity Database’ Australian Journal of Earth Sciences, vol. 61, no. 2, pp. 213-226. doi: 10.1080/08120099.2014.884983
Wernecke, J 2008 The KML handbook: geographic visualization for the Web. Pearson Education, Addison-Wesley.
Zólyomi, B 1989 ‘Természetes növénytakaró (1:1.500.000) In: Pécsi (ed.) Magyarország nemzeti atlasza’. Kartográfiai Vállalat, Budapest, p 89.