COMPARATIVE ASPECTS AND RESULT ANALYSIS OF VARIOUS
CONTROL METHODS OF AN INVERTED PENDULUM USING MATLAB
Reena Kamboj *
ABSTRACT
Inverted pendulum control is one of the fundamental problems in the field of control theory. The
present work consists of comparative aspects and result analysis of various control methods like LQR, PID and state space analysis. State space method and LQR method is used for determining
the stability of pendulum. It is found that LQR controller has the best performance among all
these controllers. AI techniques and fuzzy logic can be applied so that a robust controller and better response can be achieved for future work.
Keywords: Inverted pendulum, Linear Quadratic regulator, MATLAB, State space method, PID controller.
I.
INTRODUCTION
The inverted pendulum offers a very good example for control engineer to verify a modern control theory. This can be explained by the facts that inverted pendulum is marginally stable, in control sense, has distinctive time variant mathematical model.
Inverted pendulum is a very good model the attitude control space booster rocket and a satellite, an automatic aircraft landing system etc. To solve these type of problems with non linear time variant System, there are alternatives such as real time computer simulation of these equations or linearization. The inverted pendulum is a non linear and open loop unstable system. This means that standard linear techniques cannot model the non linear dynamics of the system .In this method, modeling can be done with the help of LQR method and state space met hod using MATLAB.
II.
SYSTEM DYNAMICS
Now that the design process is outlined, the final system model, state space representation and controller design will now be described in detail. The actual design of the controller took afew steps. Firstly the system will need to be modeled with the desired assumptions such that the system is linear and simple enough to design a controller for. From that the model can then be converted into state space form, which can then be used to design a controller using the LQR cost equation.
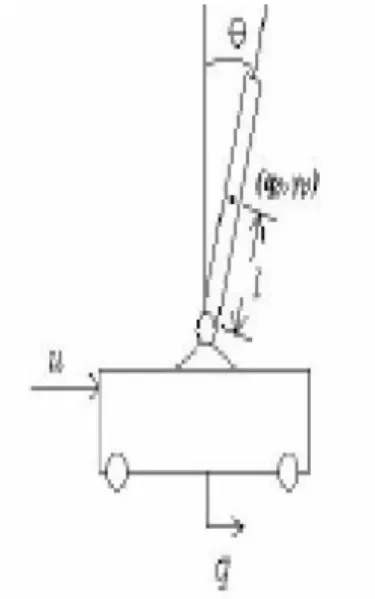
Beginning with the simplified free body diagram of the cart and pendulum controlled by a generic control effort as shown in Figure 1, the dynamics of the system can be modeled using Newton’s Laws of motion [7].
The dynamics of the pendulum can be summarized as the following two equations.
III. THE STATE SPACE MODEL
Given the system dynamics described in equation (1) and (2) ,it will be necessary to develop a state space model in order to use control design techniques for linear systems [8,9 ]. To convert the system dynamics into a space vector needs to be defined as follows.
With the performance measures defined as q and ө. The state space system can now be defined as follows.
IV.
RESULTS
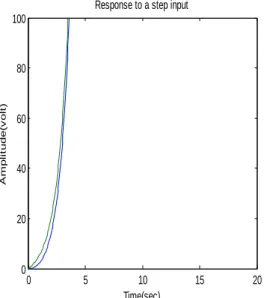
The results of an inverted pendulum by using state space method can be shown in Figure 2 with help of MATLAB.
Figure 2: Response of state space analysis at values Mp= 2.9, .M = 0.5
The second curve represents the cart’s position and the first curve represents the pendulum’s angle .It is obvious from this plot that some sort of control will have to be designed to improve the dynamics of the system. This type of response is obtained when program is made for state space analysis and written m- file, then run it. MATLAB will give the A, B, C and D matrices for the state- space model and a plot of the response of the cart’s position and pendulum angle to a step input of 0.2 m applied to the cart.
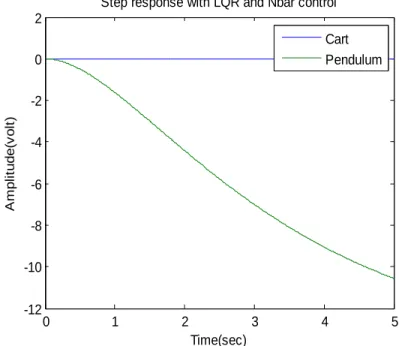
Figure 3: Response of LQR method at values of x = 8000, y = 200
0 5 10 15 20
0 20 40 60 80 100 Time(sec) A m p li tu d e (v o lt )
Response to a step input
0 1 2 3 4 5
-1.2 -1 -0.8 -0.6 -0.4 -0.2 0 0.2 Time(sec) A m p li tu d e (v o lt )
Step response with LQR and Nbar control
Now entering the program in MATLAB windows for LQR method, response of inverted pendulum is given in Figure 3.
The upper curve represents the pendulum’s angle, in radians and the lower curve represents the cart’s position in meters. The pendulum and cart’s overshoot appear fine, but their settling times need improvement and cart’s rise time needs to go down. This is also improved by changes the values of x and y in given in the MATLAB program.
Figure : Response of LQR method at values of x = 500, y = 900
Figure : Response of LQR method at values of x = 1, y = 1
0 1 2 3 4 5
-12 -10 -8 -6 -4 -2 0 2 Time(sec) A m p li tu d e (v o lt )
Step response with LQR and Nbar control
Cart Pendulum
0 1 2 3 4 5
-0.5 -0.4 -0.3 -0.2 -0.1 0 0.1 0.2 Time(sec) A m p li tu d e (v o lt )
Step response with LQR and Nbar control
From the above graphs, it can be seen that better response can be obtained if we increase the value of x and y.In these graphs the upper curve represents the pendulum’s angle ,in radians and the lower curve represents the cart’s position in meters. As can see from the above graphs at values x = 1, y = 1, the output response is not satisfactory. The pendulum and the cart’s overshoot appear fine, but their settling times need improvement and the cart’s rise time needs to go down. It can be noticed that also the cart is not clear near the desired location but has in fact moved in other direction. This error can be removed by increasing the values of x and y. By increasing the values of x and y ,it can be observed that from the graph analysis , settling time can be improved and values of K ,Nbar ca n be obtained which is different for different values of x and y. So we can say that better response can be achieved with help of using LQR method as compare to state space method. Now this can be seen by using the comparison between state space method and LQR method at same values of mass of pendulum and mass of the cart.
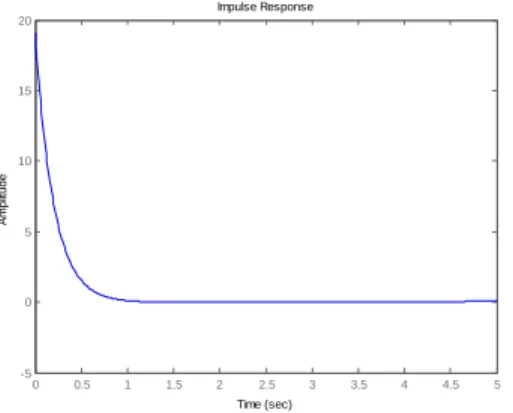
Figure : Impulse response of cart’s position for K=100, Kd=20, Ki=1 , Mp=0.5,M=0.2
Figure : Impulse response of cart’s position for K=100, Kd=20, Ki=1, Mp=0.5, M=0.5
0 0.5 1 1.5 2 2.5 3 3.5 4 4.5 5
-45 -40 -35 -30 -25 -20 -15 -10 -5 0 5 Impulse Response Time (sec) A m p lit u d e
0 0.5 1 1.5 2 2.5 3 3.5 4 4.5 5
V.
CONCLUSION
From the overall work it is to be concluded that LQR method is best method as compare to PID control method because PID control method can be used only for single input and single output (SISO) but LQR can be applicable to control multi input multi output (MIMO) system. New technique like ANN and fuzzy logic can be applied to control the inverted pendulum for further future work.
VI.
REFERENCES
1. Inverted Pendulum Tutorial: csd.newcastle.edu.au/control/simulations/pe nd_sim.html 2. Inverted Pendulum Problem: ludo.jcu.edu.au/thesis/yr4web/jc112573/ipp. htm
3. CTM Example: Inverted Pendulum Modeling
www.ee.usyd.edu.au/tutorials_online/matlab /examples/pend/invpen.html 4. Modern control engineering by Katsuhiko Ogata
5. Modern control system theory by M.Gopal
6. H W Broer, I Hoveijn, M van Noort, G. Vegter. “The Inverted Pendulum: A Singularity Theory Approach”.Journal of Differential Equations, Volume Issue 1, 1 September 1999, Pages 120-149
7. A L Hof, M G J Gazendam, W E Sinke. “The condition for dynamic stability”. Journal of Biomechanics, Volume 38, Issue 1, January 2005, Pages 1-8
8. J Sieber, B Krauskopf. “Complex balancing motions of an inverted pendulum subject to delayed feedback control”. Physical D: Nonlinear Phenomena, Volume 197, Issues 3-4, 15 October 2004, Pages 332-345