*Correspondence to Author:
Kalesanwo Olamide
School of Computing and En-gineering Sciences, Babcock University, Ilishan Remo, Ogun State, Nigeria
How to cite this article:
Awodele Oludele et al., Shoulder Surfing Resistant Graphical Au-thentication Scheme for Web Based Applications. American Journal of Computer Sciences and Applica-tions, 2017; 1:7.
eSciPub LLC, Houston, TX USA. Website: http://escipub.com/
Web Based Applications
Since the design and development of the first graphical authen -tication pioneered by Blonder in 1996, numerous research has been conducted on this area to be used in different scenario especially on the Internet. One of the major motivators is the pic-ture superiority which as studies have shown, states that image/ pictures provides higher memorability as opposed to Text based authentication. However, graphical authentication is still faced
with some challenges. In this paper, a shoulder surfing resistant
graphical authentication scheme is proposed to tackle the major issues related to the graphical authentication schemes devel-oped. In summary, the proposed scheme provides a high level of
resistance to shoulder surfing attacks, mitigating the need to up
-load pictures and aids in finding chosen objects in the scheme.
Finally, the schemes still have some vulnerabilities thus, con-cluding that there cannot be a perfect graphical authentication scheme; each scheme has its merits and demerits making it a
suitable candidate for different environment and/or event based
on its architecture.
Keywords: Authentication, Text-based Authentication,
Graphi-cal based Authentication, Security, Shoulder surfing.
1Prof. Awodele Oludele Ph.D., 2Kalesanwo Olamide, 3Kuyoro Afolashade PhD., 4Fowora
Damilola, 5Ariweriokuma Excellence.
1,2,3,4,5 School of Computing and Engineering Sciences, Babcock University, Ilishan Remo, Ogun
State, Nigeria.
ABSTRACT
Http://escipub.com/american-journal-of-computer-sciences-and-applications/ 0001
1.0 Introduction
Graphical based authentication is a type of
knowledge based authentication which uses
images/picture to assist users in generating a
more robust password (Suo, Zhu & Owen,
2005). Due to its picture superiority which
according to Paivio in 1991 claimed that pictures
are dually encoded and this is an advantage
over words. While words are merely encoded
verbally, pictures produce both a verbal code
and an image code because participants are
more likely to hold a label for pictures than to
imagine words. Having two types of codes
tagged to the pictures allow a greater chance of
retrieval during a memory task (Paivio 1991). In
addition, classic cognitive science experiment
conducted have shown that humans have a
strong memory ability for images. The
experiment showed a recognition performance
exceeding 90%, indicating retention of over
2,000 items, even when up to 3 days elapsed
between learning and testing (Standing,
Conezio, & Haber, 1970).
The challenge of users generating weak
guessable passwords in text based
authentication has been one of the major
reasons numerous research has been
conducted on Graphical based authentication
(Prakash, Infant & Shobana, 2010). The concept
of Graphical based authentication is creating a
level of abstraction whereby users do not
actually know the set of password characters
generated but a pattern used in generating the
passwords. However, over the years, Graphical
based authentication schemes have been faced
with numerous challenges including vulnerable
to shoulder surfing attacks, the size of pictures
used and browsing through an array of
images/objects without assistance (Biddle,
Chiasson & Oorschot, 2011; Wiedenbeck,
Waters, Birget, Brodskiy & Memon, 2005). The
proposed Graphical authentication schemes
reviewed in this paper tackles majorly on the
above-mentioned issues.
The rest of the paper is structured as follows:
firstly, a brief overview of Graphical based
authentication and it techniques, give examples
of the schemes that utilize the techniques of
Graphical based authentication, listing its
features, pros and cons, present the proposed
scheme and its architecture, summary and
finally conclusion.
2.0 Graphical Based Authentication
Graphical based password authentication is a
type of knowledge based authentication that
uses images or pictures in verifying the identity
of a user. It is categorized generally into the
following: recognition-based, recall-based and
cued recall techniques (Suo et al, 2005). Based
on the various techniques, the steps for both
registration and authentication varies.
2.0.1 Recognition-Based technique
This involves the recognition and selection of a
set (usually a fraction of the main set) of
pre-selected objects (usually images) from a
portfolio of objects. One scheme that utilize this
Http://escipub.com/american-journal-of-computer-sciences-and-applications/ 0002
Figure 1.0: Colorlogin Source: Gao, Liu, Wang and Dai (2009)
ColorLogin by Gao et al utilizes recognition
based technique involving choosing multiple
icons as password icons or pass-icons (Shown
in Figure 1.0). The background of every icon
belongs to one of the finite set of colors given.
Registration involves choosing a color which
then displays all the set of icons whose
background color is the same as the chosen
color. Users are required to choose 3 icons from
the set of icons displayed. During authentication,
icons of different background colors including 2 of the user’s icons will be randomly displayed on
a grid. Users only need to select the row where
the pass icon is located (no need to click on the
icon itself but any other icon on the same row
with it) and after which all the icons on that row
will be substituted with a lock icon. A user is
authenticated after getting the pass icon in one
attempt else the icons will be shuffled for the
user to try again. Using of colors and selecting
of row improves the security against shoulder
surfers. In this authentication, some icons are
frequently chosen as pass icons creating
so-called hotspots and also searching through an
array of icons can become tiring for the user.
2.0.2 Recall-based or Pure recall technique
This requires the user to reproduce something
that was created during registration; example
includes:
Http://escipub.com/american-journal-of-computer-sciences-and-applications/ 0003
Varenhorst et al developed Pass-doodles in
2004 using recall based technique. It is a
hand-written design usually drawn with stylus unto
touch sensitive screen. A doodle in this case is
an ordered set of points which is drawn (Figure
1.1 is an example of a doodle) and saved during
registration. In addition to the doodle drawn, the
speed used in drawing the doodle is also
calculated and saved. This graphical
authentication scheme provides an easy way for
users to remember the pass-doodle drawn but it
was observed that sometimes the users forget
the order in which they were drawn and also it
tends to be vulnerable to shoulder surfing.
2.0.3 Cued recall technique
Cued recall assist the user by providing a cue (a
clue or hint) to enable the user recall from
memory and reproduce the information that was
created during registration. The following ae
some examples:
Figure 1.2: Passblot login screen Source: Gupta, Sahni, Sabbu, Varma and Gangashetty (2012)
Developed by Gupta et al in 2012, Passblot is a
graphical One-Time Password (OTP) that uses
cued recall technique. The authentication
performs an inkblot test, a psychological
evaluation to get the users unique description of
an image (Carlson & Heth, 2010). Figure 1.2
describes Passblot authentication. On
registration, a given set of inkblots images are
displayed; the first and last letter of the
description of each inkblot is saved (i.e. if a user’s description for a particular inkblot is “butterfly” then “by” is saved or if the description is ”standing man” then “sn” is saved). All the
displayed inkblots images have to be described
and saved for that particular user. Upon
authentication, a fraction of randomly chosen inkblot images from the user’s set will be
displayed for the user to describe. By randomly
selecting a fraction of the users set of pictures
upon login gives a dynamic password creating a
probabilistic situation for dictionary attack and
brute force. Nevertheless, in other for the
module to be properly secured a large amount of
inkblot pictures is required which is a load for the
server and can be tiring for the user on
registration and authentication.
2.0.4 Hybrid technique
Over the years, in attempt to provide a more
secured graphical authentication system,
combinations of these techniques have been
implemented. Examples of such systems
Http://escipub.com/american-journal-of-computer-sciences-and-applications/ 0004
Figure 1.3: Graphical One Time Password Source: Alsaiari, Papadaki, Dowland and Furnell (2016)
In 2016, Alsaiari et al developed Graphical One
Time Password (GOTP) and as the name
implies implements One-Time Password (OTP)
mechanism for additional security. From Figure
1.3, this is a combination of three authentication
mechanisms which includes a 4x4 grid lock
pattern (recall-based), identification of pass
image (recognition-based) and finally inputting
an OTP corresponding to the chosen/identified
images. The right OTP will be associated with
the correct images and it is also a challenge from
the server. On registration, a lock pattern is
drawn and a set of four (4) images out of thirty
(30) are chosen. During authentication, the user
first begins by drawing the lock pattern, next to
selecting the right images (two of the previously
selected four) from the portfolio of images and
finally inputting a random number (i.e. one-time
password if the right one is chosen) associated
with the selected images. This will be sent as a
response to the server. This authentication
improves the ability to recall the pattern and
identify images more efficiently. Nevertheless, a
reasonable amount of pictures need to be stored
on the server for improved security which can be
a bottle neck for the server.
3.0 Limitations of reviewed works
From the works reviewed, many of the graphical
authentication models developed are
susceptible to shoulder attack which has been
found to be one of the major challenges. The few
which are not susceptible requires a search
through an array of objects which can be
demanding for the user and/or requires a
reasonable number of pictures (with lots of
details) to be made secured which can be
demanding in storing such unique images for
different users creating a burden for the server.
Therefore, there is a need for a shoulder surfing
resistant graphical authentication for web
Http://escipub.com/american-journal-of-computer-sciences-and-applications/ 0005
images and little time to generate the graphical
password.
4.0 Proposed Scheme
This scheme utilizes set of colored rows and
columns which may assist users in identifying
their chosen cell. The interface design
elaborates on the cued recall graphical
technique being utilized. This scheme will
involve the following;
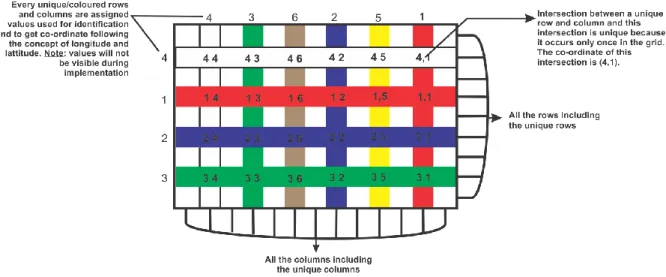
i. Rows and Columns: As shown in
Figure 1.4, the grid is made of 13
columns and 9 rows. From these rows
and columns are 6 columns and 4
rows that are assigned unique colours
and values (these are all the even
rows and columns; the odd rows and
column are not assigned any colour or
value). The values are permanently
assigned to the rows and columns.
The concept of these unique rows,
columns and their intersection is gotten from the earth’s longitude and
latitude whose intersection is unique
and are used to provide co-ordinates.
(The Editors of Encyclopedia
Britannica, 2012). Every intersection
of the coloured rows and column is
unique and its purpose is to assist in
locating a particular cell in the grid.
Figure 3.1, shows the intersection
between the white row (4) and red
column (1); the format of this
co-ordinate is written as (4,1). During
registration and authentication, these
coloured rows and columns are
randomly arranged on the grid but still
retain the values given to them.
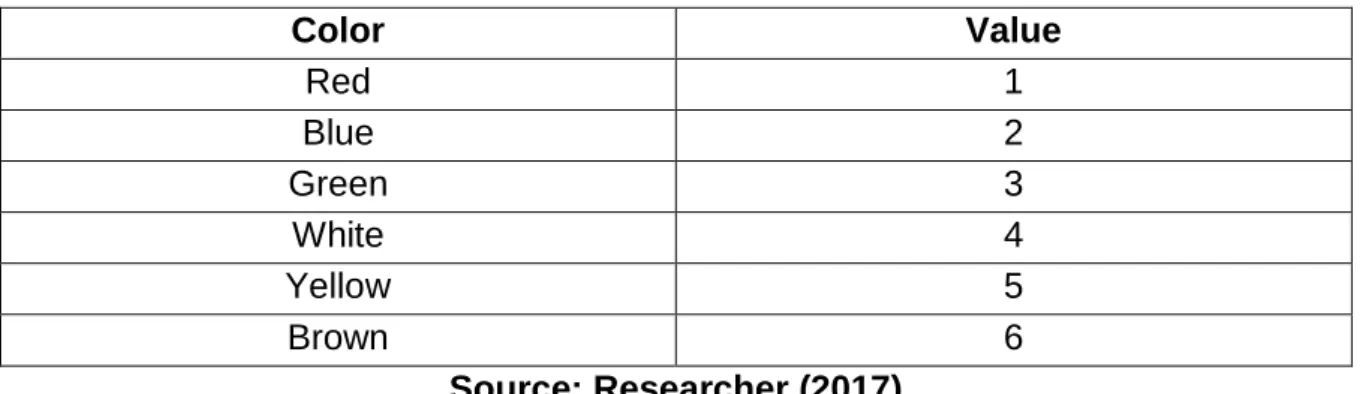
Table 1.0: Colored columns and their associative value
Color Value
Red 1
Blue 2
Green 3
White 4
Yellow 5
Brown 6
Source: Researcher (2017)
Table 1.1: Colored rows and their associative value
Color Value
Red 1
Blue 2
Green 3
White 4
Http://escipub.com/american-journal-of-computer-sciences-and-applications/ 0006
Figure 1.4: Unique rows, columns and their intersections Source: Researcher (2017)
The position/location of every cell in
the grid is relative to their
neighbouring intersection as shown in
Figure 1.5 (i.e. the cardinal points of
the intersection). Each cell contains
two values (integers between 0 and
9). The first value (or left value) and
the second value (or right value).
These values are different from the
values assigned to each line.
ii. Cells: There are a total number of 117
cells in the grid. Each cell in the grid
has a width and height of 50pixels
each giving the grid a total area of 650
by 450 pixels. The
position/co-ordinates of each cell is relative to the
individual intersections closet to them.
As shown in Figure 1.5, A cell can be
in the North, North West, North East,
East, South East, South West, South,
West or at the centre of an
intersection. All these positions are
assigned values and are used in
identifying the position/co-ordinates of
a cell based on the unique intersection
chosen.
Table 1.2: Cardinal Points and their associative values
Position Value
Centre 0
North 1
North East 2
East 3
South 4
South West 5
West 6
North West 7
Http://escipub.com/american-journal-of-computer-sciences-and-applications/ 0007
Figure 1.5: Cells and their co-ordinates Source: Researcher (2017)
Co-ordinates of several cells are
shown in Figure 1.5. One of which is
the cell at the South West (SW - 7)
position of the intersection between
the green row (3) and brown column
(6) and this co-ordinate is written as
(3,6,7).
Figure 1.6: The grid populated with pair of values in each cell Source: Researcher (2017)
Figure 1.6 shows the complete
interface used for the scheme. Each
cell contains a pair of value; a right
and a left. These pair of values are
randomly generated between 0 and 9
using JavaScript and its done during
registration and authentication. As
shown in Figure 1.6, one of the
co-ordinates of a cell and the values it
Http://escipub.com/american-journal-of-computer-sciences-and-applications/ 0008
graphical password and will be stored
in the database during registration
and be generated during
authentication.
iii. Inserting values into the cells: In
this scheme, the use of the keyboard
to insert the desired pair of values (i.e.
left and right values) is not allowed. In
other to insert values, the user makes
use of only the mouse. As shown in
Figure 1.7, values are moved about
move from one cell to another either
to the left or right position. On the
other hand, moving the mouse up or
down will affect all the left values in the
cell causing them to move from one
cell to another either upwards or
downwards. For cells located at the
edge of the grid, new randomly
generated values will be moved into
the cell.
Http://escipub.com/american-journal-of-computer-sciences-and-applications/ 0009
Both creating/setting up and generating of
password using this interface will be done as
follows;
4.1 Creating/Setting up a graphical password
This section explains the steps for
creating/setting up a graphical password. These
steps are explained as follows:
i. Select one coloured row.
ii. Select one coloured column.
iii. Select a cell whose location is relative
to the intersection of the chosen row
and column (i.e. a cell North, South,
South-East, South-West, North-East,
North West, West or East of the
intersection).
iv. Press and drag the left mouse button
up or down within the grid to move a
desired value into the first side (left
side) of the chosen cell.
v. Press and drag the left mouse button
left or right within the grid to move a
desired value into the second side
(right side) of the chosen cell.
Here the password created will be (in this order),
the value of the chosen row, the value of the
chosen column, the position (in value) of the cell
relative to the intersection, the chosen value for
the first side (left side) and second side (right
side) of the chosen cell. The format is written as
(R,C,P,Le,Ri) Where:
R = the value of the row chosen, 1<=R<=4.
C = the value of the column chosen, 1<=C<=6.
P = the position of the cell to the intersection of
the chosen R and C, 0<=P<=8.
Le = the left value of the chosen cell, 0<=Le<=9
and
Ri = the right value of the chosen cell, 0<=Ri<=9.
The co-ordinates includes (R,C,P) which
identifies the users chosen cell, while (Le,Ri) are
the pair of values found in those co-ordinates
(chosen cell). The graphical password includes
the combination of the co-ordinates and the pair
values which will be stored in the database. The
co-ordinates will also be stored in the database
to enable the authentication scheme know the
users chosen cell in other to retrieve the inputted
pair of value. The co-ordinates will be used for
authentication.
4.2 Generating a Graphical Password
This section explains the steps for generating a
graphical password after creating/setting up a
password. In this phase, the co-ordinates stored
for the registered use will be utilized in other to know the user’s chosen cell and acquire the pair
of values in that cell. Every time during this
phase, the order/arrangement of the unique
rows and columns are randomly placed, only the
user knows his/her chosen row, column, position
(co-ordinates) and the pair of values to be
inserted in to the chosen cell. This phase
includes the following:
i. By pressing and dragging the left
mouse button up or down within the
Http://escipub.com/american-journal-of-computer-sciences-and-applications/ 00010
authentication scheme only validates
the values located at the chosen cell
as the scheme already knows the
chosen cell.
4.3 System Development Tools
This comprises of the tools that will be utilized to
design the graphical authentication scheme. The
selection of these tools is required to provide a
robust, reliable and effective graphical
authentication system. These tools include.
1. HTML (Hyper Text Mark-up Language):
This is a mark-up language that is used to
create and design the structure of the
scheme. To achieve the grid system
made of 117 cells, a table tag is created
containing 9 table row tags which in turn
contains 13 table definition tags each.
Each table definition (a cell) contain a
unique identity.
2. CSS (Cascading Style Sheets): This is
used for presentation and in this scheme,
provides each selected row and column
its unique colour and styling.
3. JavaScript: It plays a major role in this
research as it is responsible for
interacting with the user. This will perform
and it is a software suite designed
specifically for Windows operating
system. This suite creates a sandbox for
the development of web based
application which provides four key
elements: An operating system,
database, web server and a scripting
software.
Apache is the web server used to execute
the different codes presented. MySQL is
the type of database used during this
project. PHP (PHP Hypertext
Pre-processor) Perform at the backend, this
will be used to connect to the database
and serve as the server scripting
language.
5. PhpMyAdmin: This is a friendly interface
used to manage the activities of the
database.
5.0 Summary
The architecture of the scheme provides
different features to tackle the issues associated
with reviewed existing graphical schemes.
These features include.
1. Shoulder surfing resistant: Firstly,
Http://escipub.com/american-journal-of-computer-sciences-and-applications/ 00011
values into the chosen cells, every other
value is affected and move
simultaneously according to the
movement of the mouse. Secondly,
during every authentication, the coloured
rows and column are randomly placed
making the scheme dynamic. These
features create a level of resistance to
shoulder surfing attacks.
2. Optimization of storage capacity: The
use of HTML (Hyper Text Mark-up
Language), CSS (Cascading Style Sheet)
and JavaScript creates a dynamic table
where are the coloured rows and columns
are rearranged during authentication.
This dynamic grid system is used as the
image for authentication thereby
mitigating the need for picture uploads
and/or storage.
3. Assistance in finding objects: The
coloured rows and columns provides
assistance for users to locate the chosen
cell for inputting the chosen pair of
objects. Rather than searching through
each cell, user focus on their chosen
coloured row and column. This
streamlines the search.
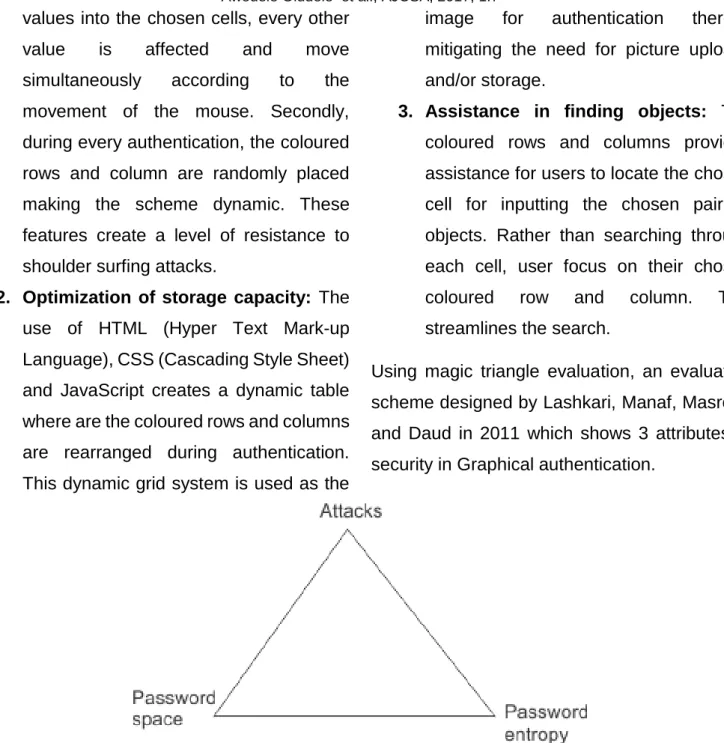
Using magic triangle evaluation, an evaluation
scheme designed by Lashkari, Manaf, Masrom,
and Daud in 2011 which shows 3 attributes of
security in Graphical authentication.
Figure 1.8: Magic triangle for Graphical Authentication security evaluation Source: Lashkari et al (2011)
The password space and entropy was
calculated using
SPACE = MN
Where:
M = is the number of characters and
N = is the length of the password (Lashkari et al,
2011).
For password space and
Entropy = Nlog2(|L||O||C|)
Where
N = the length or number of runs,
L = locus alphabet as the set of all loci
Http://escipub.com/american-journal-of-computer-sciences-and-applications/ 00012
against such attacks.
6.0 Conclusion
Several researches have been conducted on
Graphical based authentication schemes,
however, this area is still in its infancy. These
scheme tackles security issues at the expense
of creating/ignoring other issues. This may be in
the security or usability area; however,
something has always been found to be given up
in other to resolve the issue. From the different
scheme reviewed, there is no perfect Graphical
authentication scheme for all scenario.
References
1. Alsaiari, H., Papadaki, M., Dowland, P., & Furnell, S. (2016). Graphical One-Time Password (GOTPass): A usability evaluation. Information Security Journal: A Global Perspective. doi:10.1080/19393555.2016.1179374
2. Biddle, R., Chiasson, S., & Oorschot, P. (2011).
Graphical password: Learning from the first twelve years. Technical Report TR-11-01,.
3. Carlson, N. R., & Heth, D. C. (2010). Psychology--the science of behaviour. Toronto: Person.
4. Gao, H., Liu, X., Wang, S., & Dai, R. (2009). Design and Analysis of a Graphical Password Scheme. Innovative Computing, Information and
Control (ICICIC). IEEE Xplore.
doi:10.1109/ICICIC.2009.158
5. Gupta, S., Sahni, S., Sabbu, P., Varma, S., & Gangashetty, S. V. (2012). Passblot: A Highly Scalable Graphical One Time Password System.
8. Prakash, M. V., Infant, P. A., & Shobana, S. J. (2010). Eliminating Vulnerable Attacks Using One-Time Password and PassText – Analytical Study of Blended Schema. Universal Journal of Computer Science and Engineering Technology, 1 (2), 133-140.
9. Standing, L., Conezio, J., & Haber, R. N. (1970). Perception and memory for pictures: Single-trial learning of 2500 visual stimuli. Psychonomic
Science, 19(2), 73–74. doi:DOI:
10.3758/BF03337426
10. Suo, X., Zhu, Y., & Owen, S. G. (2005). Graphical Passwords: A Survey.
11. The Editors of Encyclopedia Britannica. (2012, July 3). Latitude and longitude. Retrieved April 5, 2017, from Encyclopedia Britannica: https://www.britannica.com/science/latitude
12. Varenhorst, C., Kleek, V. M., & Rudolph, L. (2004). Passdoodles; a Lightweight Authentication Method. Research Science Institute.