3
INTERIM
FINANCIAL REPORT
AVINOR
Avinor has two primary business areas, operation of a
nationwide network of airports, and the national air
navigation services for civil and military aviation. In total, this
includes 46 airports as well as control towers, control centres
and other technical infrastructure for safe air navigation.
In addition to the aviation-operative activities, commercial
earnings are facilitated through airport hotels, parking
facilities, tax-free stores, restaurants and other
services for air passengers.
Avinor is a group where the operational activities are
partly organised in divisions and in partly in legal entities
(subsidiaries). Financially, the airport operations are run as
a single aviation system. The air navigation services finance
themselves by pricing the services in accordance with
international provisions. The Group has approximately 3,300
employees and annual operating revenues of NOK 9 billion.
The shares in Avinor AS are wholly owned by the Norwegian
state as represented by the Ministry of Transport
and Communications. The Ministry of Transport and
Communications manages the Norwegian state’s ownership
of Avinor, and stipulates e.g. the tasks imposed on the Group
to safeguard the general interests of Norwegian society, the
required rate of return and dividends. In addition, the Ministry
of Transport and Communications regulates the aviation fees.
The Ministry of Transport and Communications is the highest
authority for Norwegian aviation and also stipulates the Civil
Aviation Authority’s regulations, which have consequences for
Avinor’s operations.
Avinor has issued bonds that are listed on the Oslo Stock
Exchange. The Group’s corporate governance must adhere to
the Oslo Stock Exchange’s recommendations for corporate
governance to the extent applicable. The principles
complement the government’s focus on corporate governance
in the management of the Norwegian state’s shareholdings.
Avinor’s head office is located in Oslo.
Group main figures
4
Board of directors report
5
Balance sheet
10
Income statement
11
Statement of comprehensive income 12
Statement of changes in equity
13
Statement of cash flows
14
MAIN FIGURES AVINOR GROUP
Avinor Group - Main figures
Amounts in MNOK Year
2013 2012 2013 2012 2012
794,1
755,7 Traffic income 2 238,5 2 168,0 2 860,2
310,6
246,3 Security (cost based) 857,5 726,3 948,7
1 333,3
1 191,6 Other income 3 479,4 3 141,6 4 245,5
48,1
50,8 Inter-group income 140,4 149,3 201,4
2 486,1
2 244,4 Total income airport operations 6 715,8 6 185,2 8 255,8
261,7
242,5 En route charges 704,9 718,2 947,0
183,0
198,1 Inter-group income approach and control tower services 548,5 593,9 745,9
58,6
61,3 Other income 178,1 114,4 144,2
503,3
501,9 Total income air navigation services 1 431,5 1 426,5 1 837,1
131,4
213,6 Other group income (a) 397,6 444,9 474,1
-360,3
-459,7 Elimination of inter-group income -1 083,3 -1 185,5 -1 414,9
2 760,5
2 500,2 Total group income 7 461,6 6 871,1 9 152,1
-1 375,1
-1 415,9 Operating expenses airport operations (a) -4 043,8 -3 962,8 -5 255,2
-491,9
-455,4 Operating expenses air navigation services -1 336,1 -1 239,3 -1 715,5
-198,6
-149,5 Other operating expenses group -567,8 -476,1 -678,1
360,3
459,7 Elimination of inter-group expenses 1 083,3 1 185,5 1 414,9
-1 705,3
-1 561,1 Total group expenses -4 864,4 -4 492,7 -6 233,9
1 111,0
828,5 EBITDA airport operations 2 672,0 2 222,4 3 000,6
11,4
46,5 EBITDA air navigation services 95,4 187,2 121,6
-67,2
64,1 EBITDA others -170,2 -31,2 -204,0
1 055,2
939,1 EBITDA group 2 597,2 2 378,4 2 918,2
-336,6
-322,7 Depreciation, amortisation and impairment charges -1 008,9 -991,2 -1 335,7
8,7
-1,7 Changes in value and other (losses)/gains, net 2,4 -17,2 -20,3
727,4
614,7 Operating profit/(loss) 1 590,7 1 370,0 1 562,2
-88,1
-109,3 Net finance income/(costs) -257,1 -277,7 -355,9
639,3
505,4 Profit/(loss) before income tax 1 333,6 1 092,3 1 206,3
-179,1
-141,6 Income tax expense -373,8 -306,7 -351,6
460,2
363,8 Profit/(loss) after tax 959,8 785,6 854,7
44,7 % 36,9 % EBITDA-margin airport operations 39,8 % 35,9 % 36,3 %
2,3 % 9,3 % EBITDA-margin air navigation services 6,7 % 13,1 % 6,6 %
38,2 % 37,6 % EBITDA-margin others 34,8 % 34,6 % 31,9 %
1 059,9
1 098,3 Investments airport operations 2 777,0 2 822,2 3 883,1
22,5
4,7 Investments air navigation services 71,8 37,5 78,1
52,3 14,2 Investments others 149,4 79,3 123,4 1 134,7 1 117,2 Total investments 2 998,2 2 939,0 4 084,6 -463,4 -421,8 Distributed dividends -463,4 -421,8 -421,8 -373,7
-505,6 Cash flow before borrowings -1 001,7 -1 403,1 -2 229,6 Net interest-bearing debts 13 388,6 10 761,0 11 187,8 Total assets 30 721,7 27 491,8 28 146,0
Equity ratio 38,8 % 36,7 % 36,8 %
Return on total capital after tax 5,8 %
13 293,0
12 583,6 Number of passengers (in 1000) 36 585,1 35 041,8 46 357,0
190,5
182,3 Number of aircraft departures (in 1000) 547,6 538,6 669,0
567,4
493,2 Number of service units (in 1000) 1 531,9 1 381,1 1 845,0
Punctuality (b) 86 % 87 % 89 %
Regularity (b) 98 % 98 % 98 %
(a) Exclusive of inter-group leases on land
5
HIGHLIGHTS
The Group had a financially strong third quarter with
growth in traffic measured in numbers of passengers of
5.6 per cent, and growth in operating income of 10.4 per
cent compared with the corresponding reporting period
last year. Year to date growth in traffic was 4.4 per cent
and growth in operating income was 8.6 per cent at the
end of the third quarter. The Group’s operating margin
improved by 1.4 percentage points compared with the
corresponding period last year.
At the end of September, the Group’s operating income
totalled NOK 7,462 million, and the profit after tax was
NOK 960 million. Capitalised project costs totalled
NOK 2,998 million at the end of the third quarter. Before
changes in debt, the Group had a negative cash flow of
NOK 1,002 million.
There has been a significant earnings improvement
for airport operations due to the growth in traffic and
increased commercial income per passenger. The
cost level per passenger remains unchanged from the
corresponding period last year. The largest airports
are operating beyond what is normally regarded as
full capacity for parts of the day. Beyond the ongoing
projects for establishment of the necessary capacity in
the long term, a continuous effort is made to streamline
the operations for both the airlines and the passengers.
Progress of the T2 project at Gardermoen is proceeding
as planned. Total budget is NOK 14.1 billion. New
taxiways and airside parking stands are now in use,
while extensive construction work is in progress for the
new Terminal 2 and the new North Pier. Preparatory
groundwork for a new terminal has started in Bergen.
There was underlying strong growth in the traffic for the
air navigation service measured in number of service
units, which was counteracted by reduced prices. To
facilitate adaptation to new national and international
performance requirements for the air navigation service,
it has been decided to change the Group’s legal structure
by separating the air navigation service into a limited
company that will be wholly owned by Avinor. The plan is
to implement the change during the first half of 2014.
No aviation accidents have been registered, with
or without personal injury, in which Avinor was a
participant, year to date this year. Over the last 12
months, the Group has had a lost time injury frequency
rate (H1 value) of 2.6 (internal target is 3 or less) and
absence due to illness of 4.4 per cent (internal target is
4.5 per cent or lower).
3
RDQUARTER 2013
1MNOK
Per Q3 2013
Q3 2012
Change
Operating income
2 760,5
2 500,1
10,4 %
EBIT
727,4
614,7
18,3 %
Profit for the year
460,2
363,8
26,5 %
Investments
1 134,7
1 117,2
1,6 %
Table 1: Key financial figures
In the third quarter of 2013, the Group had a profit after
tax of NOK 460 million, compared with NOK 364 million
for the corresponding accounting period last year.
This earnings improvement is primarily due to higher
operating income. A total of 13.3 million air passengers
travelled via Avinor’s airports in the third quarter,
which is an increase of 5.6 per cent compared with the
corresponding period last year.
The Group’s operating income in the third quarter
increased by 10.4 per cent to NOK 2,761 million. This
growth reflects a continued good development for the
Group’s commercial offers at the airports and a positive
trend in passenger volume.
Total operating expenses, excluding depreciation and
write-downs, totalled NOK 1,705 million in the third
quarter. This is a change of 9.2 per cent compared
with the corresponding reporting period last year. The
increase in expenses are linked to workforce growth at
the major airports, contracted security services and a
change in the invoicing routines for the air navigation
services to the Norwegian Armed Forces.
Depreciation and write-downs on the Group’s property,
plant and equipment totalled NOK 337 million in the
third quarter, compared with NOK 323 million for the
corresponding period last year.
The Group’s net finance costs in the third quarter were
NOK 88 million, compared with NOK 109 million for
the corresponding period last year. The profit is affected
by greater recognition of interest expenses related to
development projects in the balance sheet.
AS AT 3
rdQUARTER OF 2013
1The Group’s net finance costs in the second quarter were
NOK 90.1 million, compared with NOK 92.8
million for the corresponding period last year. The profit
is affected by greater recognition of interest
expenses on the balance sheet.
MNOK
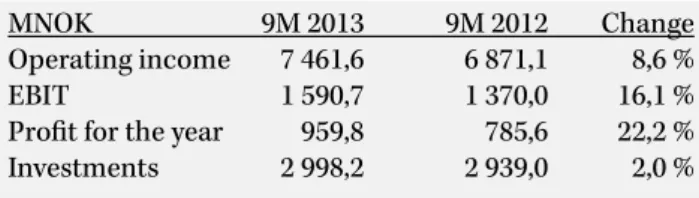
9M 2013
9M 2012
Change
Operating income
7 461,6
6 871,1
8,6 %
EBIT
1 590,7
1 370,0
16,1 %
Profit for the year
959,8
785,6
22,2 %
Investments
2 998,2
2 939,0
2,0 %
Table 2: Key financial figures
1
Investments are defined as additions to the balance sheet for property, plant and equipment.
As at third quarter of 2013, the Group had a profit after
tax of NOK 960 million, compared with NOK 786 million
for the corresponding accounting period last year.
OPERATING INCOME
Operating income during the period 1 January to
30 September 2013 totalled NOK 7,462 million. In
comparison with the same period the prior year, this
represents a growth of 8.6 per cent and a growth in
operating income per passenger of 4.0 per cent.
Airport operations reported operating income of NOK
6,716 million, which is an increase of 8.6 per cent. The
growth was caused by continued business-related
development of commercial products and services. In
comparison with the corresponding period the prior year,
commercial income per passenger increased by 6.7 per
cent, whereas aviation income per passenger (excluding
security) decreased by 1.1 per cent.
The air navigation service reported an increase in
operating income of 0.4 per cent to NOK 1,432 million.
There was underlying growth in the traffic in number of
service units for the air navigation service, which was
counteracted by reduced prices. As at the third quarter,
traffic income per service unit was approximately 11.5
per cent lower, compared with the corresponding period
last year. This is attributed to a reduction in the fee rates.
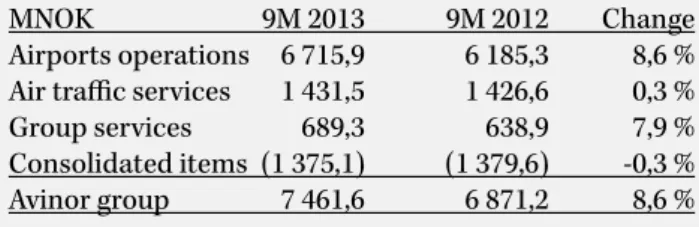
Operating income per business area is shown in table 3
below:
MNOK
9M 2013
9M 2012
Change
Airports operations 6 715,9
6 185,3
8,6 %
Air traffic services
1 431,5
1 426,6
0,3 %
Group services
689,3
638,9
7,9 %
Consolidated items (1 375,1)
(1 379,6)
-0,3 %
Avinor group
7 461,6
6 871,2
8,6 %
Table 3: Operating income
OPERATING EXPENSES AND DEPRECIATION
Operating expenses excluding depreciation and
write-downs totalled NOK 4,864 million, year to date this
year, in comparison with NOK 4,493 million last year.
Additional cost amounting to NOK 104 million related
to ensuring normal operation during construction of
Terminal 2 at Oslo Airport, have been reflected in the
accounts year to date this year. The corresponding figure
last year was NOK 111 million.
Depreciation and write-downs on the Group’s property,
plant and equipment totalled NOK 1,009 million year
to date, in comparison with NOK 991 million for the
corresponding period last year. The accounts reflect
NOK 80 million in accelerated depreciation year to
date in connection with the terminal 2 project. The
corresponding figure last year was NOK 101 million.
OPERATING PROFIT
The Group’s operating profit for the period from 1
January to 30 September 2013 totalled NOK 1,591 million,
compared with NOK 1,370 million for the corresponding
period in 2012. This results in an operating margin of
21.3 per cent this year, compared with 19.9 per cent last
year. Adjusted for the additional costs associated with
the Terminal 2 project, as well as changes in the value of
financial derivatives, the Group’s operating margin year
to date has been 23.8 per cent, in comparison with 23.0
per cent for the same period last year. This is attributed
primarily to the commercial activity that compensates
for the lower margins for the air navigation service.
FINANCIAL ITEMS AND TAX
The Group’s net financial costs for the period from
1 January to 30 September 2013 were NOK 257 million,
compared with NOK 278 million in the corresponding
period in 2012.
Increased borrowing expenses are partly compensated
for by increased capitalisation of borrowing cost on
investment projects.
Based on the expected tax rate on an annual basis, the
tax costs year to date are computed as being NOK 374
million.
INVESTMENTS
Recognised additions to property, plant and equipment
in the first nine months of the year amounted to NOK
2,998 million, compared with NOK 2,939 million for the
corresponding period last year.
The investments can be broken down into business areas
as follows:
MNOK
9M 2013
9M 2012
Change
Airports operations 2 777,0
2 822,2
-45,3
Air traffic services
71,8
37,5
34,3
Joint items, group
41,0
16,3
24,7
Consol idated items 108,4
63,0
45,4
Group
2 998,2
2 939,0
59,2
Table 4: Addition to PPE recognised in the balance sheet
A significant part of the investments undertaken year to
date this year are associated with the expansion project
for increased terminal capacity at the Oslo Airport
Gardermoen. Progress in the project is proceeding as
planned.
CASH FLOW AND FINANCING
Due to the investments exceeding the contribution
from ongoing operations, the Group had a cash flow for
the period from 1 January to 30 September 2013, prior
to changes in debt, of minus NOK 1,002 million. The
7
corresponding period last year was minus NOK 1,403
million. The Group’s total capital as at 30 September 2013
amounted to NOK 30.7 billion. Equity as a percentage of
the sum of equity and interest-bearing debt was 47.1 per
cent as at 30 September 2013. At the same point in time
last year, this ratio was 48.3 per cent.
The Group changed its assumptions for calculation
of the carrying amount of its pension obligations
as of 30 September 2013. In accordance with the
recommendation from the Norwegian Accounting
Standards Board, an interest rate based on covered
bonds has been chosen as the basis for the discount rate
that is applied to the calculation. New life expectancy
assumptions were also applied. This has had a net
positive effect of NOK 1,058 million on the book equity.
Interest-bearing debt as at 30 September 2013 totalled
NOK 13,389 million, and the debt has increased by
NOK 2,628 million since the end of the third quarter last
year.
As at 30 September 2013, the Group’s cash reserves
amounted to NOK 7,440 million, distributed between
NOK 2,540 million in bank deposits and NOK 4,900
million in unutilised bank overdrafts.
TRAFFIC DEVELOPMENT AND SERVICE GOALS
A total of 36.6 million passengers travelled through
Avinor’s airports during the first nine months of the year,
which is an increase of 4.4 per cent compared with the
corresponding period in 2012. The figure below shows the
trend in traffic on a quarterly basis for 2010–2013:
Passengers
(millions)
14
12
10
8
6
4
2
Q1 Q2 Q3 Q4
2010
2011
2012
2013
Since the financial crisis in 2008–2009, the air traffic has
experienced evenly balanced growth up to now. Traffic
volume as per third quarter has increased by 28 per cent
during the period 2009–2013.
In comparison with the corresponding period last
year, domestic traffic increased by 1.1 per cent, while
international traffic increased by 9.6 per cent. Domestic
traffic totalled 61.1 per cent of the total traffic volume as
per the third quarter. The volume of offshore helicopter
traffic increased 7.9 per cent compared with last year.
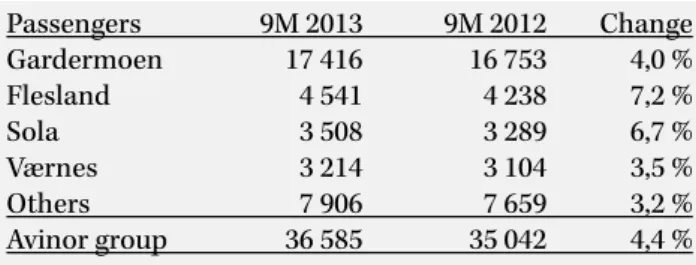
Passenger volume was distributed between the airports
as follows:
Passengers
9M 2013
9M 2012
Change
Gardermoen
17 416
16 753
4,0 %
Flesland
4 541
4 238
7,2 %
Sola
3 508
3 289
6,7 %
Værnes
3 214
3 104
3,5 %
Others
7 906
7 659
3,2 %
Avinor group
36 585
35 042
4,4 %
Table 5: No. of passengers
The number of commercial aircraft movements,
including offshore helicopters, increased by 1.6 per cent
in comparison with the corresponding period last year.
The traffic volume for the en route service measured
by the number of service units increased year to date
by 11.0 per cent in comparison with the corresponding
period for the preceding year. Punctuality for the past 12
months aggregated over all aircraft movements was 86
per cent. There is a continuous effort, in cooperation with
the airlines, to ensure a high degree of punctuality for
the passengers. The regularity was 98 per cent, which is
within the Group’s defined target. Avinor and the airlines
SAS, Norwegian and Widerøe have made provisions
for closer cooperation, and have signed an agreement
in which they have made commitments with regard to
regularity and punctuality.
AIR SAFETY AND HSE
No aviation accidents have been registered, with
or without personal injury, in which Avinor was a
participant year to date this year.
Overall, at the end of the third quarter of 2013 the Group
had an H1 value (lost time injury frequency rate) for the
past 12 months of 2.6. Avinor’s goal is to have an H1 value
of 3.0 or less.
Sick leave absences for the past 12 months for the Group
were 4.4 per cent, which is lower than the corresponding
period last year. The Group’s Inclusive Working Life target
for absence due to illness is 4.5 per cent or lower.
Through its own routines, Avinor discovered
unacceptable working conditions for a group of
construction workers working on the T2 development
project at Oslo Airport Gardermoen. Avinor has reported
this matter to the Labour Inspection Authority in
accordance with its internal routines and the current
legislation. The Labour Inspection Authority has
launched its own investigation. In addition, Avinor has
launched its own internal - survey to clarify whether it
is necessary for Avinor to prepare better routines and
guidelines in order to avoid such incidents in the future.
All known unfortunate living conditions are straightened
out with the general contractor.
RISKS
The Group’s operations are focused on safe air traffic
management with procedures and measures to minimise
both the risks and consequences of accidents and serious
incidents. In addition to aviation-related operating
conditions, the business is exposed to financial risk.
Regulatory developments are occurring continuously
in domestic and international aviation. The Group’s
continuous updating of operations to comply with new
provisions has financial consequences.
The Norwegian state has defined Avinor as a “category
4” company, i.e. a company with national sectoral policy
objectives. This entails, for example, that the Norwegian
state sets guidelines for a number of conditions,
including airport structure, emergency preparedness,
aviation fees and duties imposed by society. Depending
on the various political priorities, the scope and
organisation of sectoral policy guidelines may change
over time.
Avinor’s operations are characterised by long-term
investments in infrastructure. The management of
operations and emergency preparedness are largely
regulated by provisions and regulations. The Group
therefore has a high percentage of fixed operating costs
that vary to a limited extent with changes in traffic
volumes. The Group’s financial earnings and value
are therefore sensitive to traffic fluctuations, and for
downturns in traffic there is a risk of an impairment in
value with regard to property, plant and equipment on
the Group’s balance sheet.
Experience has shown that there is a correlation between
the general economic development and the demand
for air travel over time, while there may be significant
deviations in the short term.
Oslo Airport Gardermoen accounts for almost 50 per
cent of the Group’s operating income and is a key source
of funding for the rest of the airport network in Norway.
The airport’s earnings are exposed to economic cycles
and competition from other domestic and international
airports.
The Group’s traffic income and earnings are exposed to
future changes in the airlines’ schedules and production.
The majority of the Group’s receivables are from the
airlines and are not hedged.
Revenues from commercial offerings at the airports
are very important to the Group’s funding. Changes in
the framework conditions for these activities will have
a major impact on the Group’s earnings and financial
value.
The Group has financial risk in connection with foreign
currency, interest rates and energy prices. Financial
hedging instruments (derivatives) are used to limit risk.
The Group’s long-term debt to the Norwegian state is
exposed to changes in the interest rate on long-term
government bonds. A significant portion of the Group’s
other debt has fixed interest rates or is hedged by means
of financial derivatives.
When investing the Group’s surplus cash, emphasis
is given to the issuer’s solidity and the liquidity of the
investment. The Group’s liquid assets are deposited in a
bank on negotiated terms.
On 18 February 2011 a cooperation agreement was
signed between the Norwegian Armed Forces and Avinor,
which, with effect from 2 January 2010, will regulate the
distribution of costs and other conditions between the
parties where the Norwegian Armed Forces and Avinor
operate jointly. There continues to be disagreement
between the Norwegian Armed Forces and Avinor on the
understanding of the central points of the cooperation
agreement. In accordance with the provisions of the
cooperation agreement, disagreement may entail the
matter going to arbitration.
A petition for a discretionary court assessment to
determine the purchase price or an annual user fee for
aviation-critical areas that are owned by the Norwegian
Armed Forces at Flesland and Værnes airports has been
submitted to the court of appraisement.
Following the recommendation from the Government
(Proposition 73 S (–2011), the Storting resolved that
new fighter planes are to be based in Ørland with
the advanced base in Evenes. It has been resolved to
close down Bodø’s main air station. The change in the
Norwegian Armed Forces’ base structure alters the
present joint operations between civil and military
aviation in Bodø, and it will have considerable financial
consequences for Avinor’s future operating and
investment costs.
In connection with capacity expansions at Oslo Airport
Gardermoen, there is disagreement between the
Norwegian National Rail Administration and Avinor
regarding the development of the railway station and the
principles for the distribution of costs. Avinor is working,
in cooperation with The Ministry of Transport and
Communications, to find a solution to the disagreement.
9
In connection with the pension settlement in 2005, it was
determined that public service pensions shall be adjusted
for life expectancy and made subject to the new pension
adjustment rules. The life expectancy adjustment will
entail that employees will have to work longer in order
to achieve pension benefits corresponding to what has
been the case up until now. The rules for those who were
born after 1953 have, however, not been clarified, and are
therefore not accounted for.
The airports have discharge permits that require risk
assessments to identify potential sources of acute
pollution that represent a risk of damage to the external
environment.
Work is continuing on reducing the risk of incidents
that harm the environment occurring, while at the
same time existing pollution is being surveyed and
cleaned up. Environmentally hazardous additives in fire
extinguishing foam, which has spread to the natural
environment, have been detected at all the airports.
Work is currently being conducted to clarify the scope of
measures that will need to be implemented. As a basis for
this work, risk assessments have been conducted of the
potential harm to persons and the external environment
from these pollutants. The economic consequences of
this work depend on the extent of the localities that
require measures to be implemented, as well as the
authorities’ requirements and the measures available.
FUTURE PROSPECTS
Even though short-term incidents and traffic volume
fluctuations may arise, a continued strong demand for
air transport is expected in the long term in Norway.
For Avinor it is important to make provisions for an
infrastructure with a capacity and services that are
adapted to the needs of society so that our public
service mission is fulfilled in a satisfactory manner.
Future required investments exceed contributions from
on-going operations. To strengthen the Group’s financial
capacity and reduce financial risk, Avinor has previously
requested an equity issue. In order to ensure robust
financial conditions adapted to required investment,
Avinor will continue the dialog with The Ministry of
Transport and Communications.
Focus on customer orientation and earnings
improvement is important to Avinor. Strengthened
financial earnings are required in order to ensure a stable
basis for continuous operations.
Oslo, 21 November 2013
Board of Directors of Avinor AS
Avinor Group
Balance sheet
31 December 31 December
2012 2012 2013 All amounts in MNOK Notes 2013 2012 2012
ASSETS
Non-current assets
2 238,9
2 130,5 1 719,1 Deferred tax assets 9 1 782,6 2 342,4 2 577,4 46,4
50,1 35,1 Other intangible assets 4 35,1 50,1 46,4 10 851,3
10 325,8 11 813,0 Property, plant and equipment 4 24 807,4 22 011,5 22 807,8 22,7
12,2 - Derivative financial instruments 7,8 12,4 22,9 3 877,0
3 269,9 4 969,8 Other financial assets 130,9 64,5 79,0 17 036,3
15 788,5 18 537,0 Total non-current assets 26 763,8 24 480,9 25 533,5
Curent assets
1 255,9
983,8 1 108,3 Inventories, trade and other receivables 1 417,7 1 291,3 1 258,6 0,2
0,1 - Derivative financial instruments 0,1 0,1 1,4 1 289,3
1 694,5 2 503,2 Cash and cash equivalents 2 540,1 1 719,5 1 315,7 2 545,4
2 678,4 3 611,5 Total current assets 3 957,9 3 010,9 2 575,7 19 581,7
18 466,9 22 148,5 TOTAL ASSETS 30 721,7 27 491,8 28 109,2
EQUITY AND LIABILITIES Equity 5 400,1 5 400,1 5 400,1 Restricted equity 5 400,1 5 400,1 5 400,1 3 169,9 2 724,9 4 048,0 Retained earnings 6 533,9 4 686,2 4 956,6 8 570,0 8 125,0 9 448,1 Total equity 11 934,0 10 086,3 10 356,7 Provisions 3 315,0
3 552,7 2 256,8 Retirement benefit obligations 2 521,0 4 127,9 3 875,1 159,1 159,8 159,1 Other provisions 190,1 190,8 190,2 3 474,1 3 712,5 2 415,9 Total provisions 2 711,1 4 318,7 4 065,3 Non-current liabilities - - State loan 5 4 082,6 4 527,0 4 304,8 22,4
23,1 18,2 Derivative financial instruments 112,1 144,0 142,8 4 345,8
4 379,6 6 317,1 Other non-current liabilities 5 7 589,7 5 718,1 5 662,2 4 368,2
4 402,7 6 335,3 Total non-current liabilities 11 784,4 10 389,1 10 109,8
Current liabilities
700,0
- 1 200,0 Commercial papers 1 200,0 - 700,0 4,9
5,5 13,3 Derivative financial instruments 17,9 11,1 11,2 2 464,5
2 221,2 2 735,9 Other current liabilities 5 3 074,3 2 686,6 2 866,2 3 169,4
2 226,7 3 949,2 Total current liabilities 4 292,2 2 697,7 3 577,4 11 011,7
10 341,9 12 700,4 Total liabilities 18 787,7 17 405,5 17 752,5 19 581,7
18 466,9 22 148,5 TOTAL EQUITY AND LIABILITIES 30 721,7 27 491,8 28 109,2
Avinor Group
30 September
Avinor AS
30 September
11
Avinor Group
Income statement
Year All amounts in MNOK Notes 2013 2012 2013 2012 2012
Operating income
Traffic income 1 366,5 1 244,5 3 800,5 3 612,5 4 755,8 Other operating income 1 394,0 1 255,8 3 661,1 3 258,6 4 396,3
Total operating income 2 760,5 2 500,3 7 461,6 6 871,1 9 152,1
Operating expenses
Raw materials and consumables used 42,7 51,5 118,2 111,0 142,6 Employee benefits expense 7,8 897,1 836,2 2 470,7 2 301,1 3 172,8 Depreciation, amortisation and impairment charges 4,7 336,6 322,7 1 008,9 991,2 1 335,7 Other operating expenses 7 765,4 673,5 2 275,5 2 080,6 2 918,5
2 041,8
1 883,9 5 873,3 5 483,9 7 569,6
718,7
616,4 1 588,3 1 387,2 1 582,5 Changes in value and other (losses)/gains, net 8,7 (1,7) 2,4 (17,2) (20,3)
Operating profit/(loss) 727,4 614,7 1 590,7 1 370,0 1 562,2
Net finance income/(costs) (88,1) (109,3) (257,1) (277,7) (355,9)
Profit/(loss) before income tax 639,3 505,4 1 333,6 1 092,3 1 206,3 Income tax expense 9 179,1 141,6 373,8 306,7 351,6
Profit/(loss) for the third quarter 460,2 363,8 959,8 785,6 854,7
Avinor AS
Income statement
Year All amounts in MNOK Notes 2013 2012 2013 2012 2012
Operating income
Traffic income 858,5 784,3 2 401,9 2 305,4 3 041,9 Other operating income 725,6 651,7 1 939,0 1 691,3 2 275,8
Total operating income 1 584,1 1 436,0 4 340,9 3 996,7 5 317,7
Operating expenses
Raw materials and consumables used 29,1 41,3 82,8 76,8 96,7 Employee benefits expense 8 760,4 703,4 2 078,1 1 936,3 2 665,2 Depreciation, amortisation and impairment charges 155,3 153,6 469,7 456,2 624,1 Other operating expenses 536,9 444,8 1 556,1 1 358,3 1 946,3
1 481,7
1 343,1 4 186,7 3 827,6 5 332,3
102,4
92,9 154,2 169,1 (14,6) Changes in value and other (losses)/gains, net 5,4 (0,5) 4,5 (12,6) (13,5)
Operating profit/(loss) 107,8 92,4 158,7 156,5 (28,1)
Net finance income/(costs) (0,9) (0,3) 541,9 38,3 438,0
Profit/(loss) before income tax 106,9 92,1 700,6 194,8 409,9 Income tax expense 9 30,0 25,8 196,2 54,5 16,2
Profit/(loss) for the third quarter 76,9 66,3 504,4 140,3 393,7 Nine months ended September
Nine months ended September
Total operating expenses before changes in value and other losses/gains, net
Operating profit/(loss) before changes in value and other losses/gains, net
Total operating expenses before changes in value and other losses/gains, net
Operating profit/(loss) before changes in value and other losses/gains, net
Third quarter
Third quarter
Avinor Group
Statement of comprehensive income
Year Year
2012 2012 2013 All amounts in MNOK 2013 2012 2012 393,7
140,3 504,4 Profit/(loss) for the first quarter 959,8 785,6 854,7 (560,4)
(826,6) 1 163,0 Actuarial gains/(losses) on post employment benefit obligations 1 470,0 (957,4) (677,5) 156,9
231,4 (326,0) Tax effect (412,0) 268,1 189,7 19,3
19,3 - Cash flow hedges 31,8 (3,4) (3,7) (5,4) (5,4) - Tax effect (8,9) 0,9 1,1 (389,6) (581,2) 837,0 1 080,9 (691,8) (490,4) 4,1 (440,9) 1 341,4 2 040,7 93,8 364,3 Attributable to: 4,1
(440,9) 1 341,4 Owners of the parent 2 040,7 93,8 364,3
Avinor Group
Statement of changes in equity
Other Other
All amounts in MNOK Share capital reserves equity Total equity Balance at 1 Januar 2012 5 400,1 (828,7) 5 842,9 10 414,3
(691,8)
785,6 93,8 Dividends provided for or paid (421,8) (421,8) Balance at 30 September 2012 5 400,1 (1 520,5) 6 206,7 10 086,3
Balance at 1 Januar 2013 5 400,1 (1 319,2) 6 275,8 10 356,7 1 080,9
959,8 2 040,7 Dividends provided for or paid (463,4) (463,4) Balance at 30 September 2013 5 400,1 (238,3) 6 772,2 11 934,0
Avinor AS
Statement of changes in equity
Other Other
All amounts in MNOK Share capital reserves equity Total equity Balance at 1 Januar 2012 5 400,1 (703,4) 4 291,0 8 987,7
(581,2)
140,3 (440,9) Dividends provided for or paid (421,8) (421,8) Balance at 30 September 2012 5 400,1 (1 284,6) 4 009,5 8 125,0
Balance at 1 Januar 2013 5 400,1 (1 093,0) 4 262,9 8 570,0 837,0
504,4 1 341,4 Dividends provided for or paid (463,4) (463,4) Balance at 30 September 2013 5 400,1 (256,0) 4 303,9 9 448,1
Other comprehensive income, net of tax
Nine months ended September
Avinor Group
Other comprehensive income
Total comprehensive income
Avinor AS
Nine months ended September
Items not to be reclassified to profit or loss in subsequent
Total comprehensive income Total comprehensive income
Total comprehensive income
Total comprehensive income
13
Avinor Group
Statement of comprehensive income
Year Year
2012 2012 2013 All amounts in MNOK 2013 2012 2012 393,7
140,3 504,4 Profit/(loss) for the first quarter 959,8 785,6 854,7 (560,4)
(826,6) 1 163,0 Actuarial gains/(losses) on post employment benefit obligations 1 470,0 (957,4) (677,5) 156,9
231,4 (326,0) Tax effect (412,0) 268,1 189,7 19,3
19,3 - Cash flow hedges 31,8 (3,4) (3,7) (5,4) (5,4) - Tax effect (8,9) 0,9 1,1 (389,6) (581,2) 837,0 1 080,9 (691,8) (490,4) 4,1 (440,9) 1 341,4 2 040,7 93,8 364,3 Attributable to: 4,1
(440,9) 1 341,4 Owners of the parent 2 040,7 93,8 364,3
Avinor Group
Statement of changes in equity
Other Other
All amounts in MNOK Share capital reserves equity Total equity Balance at 1 Januar 2012 5 400,1 (828,7) 5 842,9 10 414,3
(691,8)
785,6 93,8 Dividends provided for or paid (421,8) (421,8) Balance at 30 September 2012 5 400,1 (1 520,5) 6 206,7 10 086,3
Balance at 1 Januar 2013 5 400,1 (1 319,2) 6 275,8 10 356,7 1 080,9
959,8 2 040,7 Dividends provided for or paid (463,4) (463,4) Balance at 30 September 2013 5 400,1 (238,3) 6 772,2 11 934,0
Avinor AS
Statement of changes in equity
Other Other
All amounts in MNOK Share capital reserves equity Total equity Balance at 1 Januar 2012 5 400,1 (703,4) 4 291,0 8 987,7
(581,2)
140,3 (440,9) Dividends provided for or paid (421,8) (421,8) Balance at 30 September 2012 5 400,1 (1 284,6) 4 009,5 8 125,0
Balance at 1 Januar 2013 5 400,1 (1 093,0) 4 262,9 8 570,0 837,0
504,4 1 341,4 Dividends provided for or paid (463,4) (463,4) Balance at 30 September 2013 5 400,1 (256,0) 4 303,9 9 448,1
Other comprehensive income, net of tax
Nine months ended September
Avinor Group
Other comprehensive income
Total comprehensive income
Avinor AS
Nine months ended September
Items not to be reclassified to profit or loss in subsequent
Total comprehensive income Total comprehensive income
Total comprehensive income
Total comprehensive income
Avinor Group
Statement of cash flows
Year Year
2012 2012 2013 All amounts in MNOK 2013 2012 2012
Cash flow from operating activities
409,9
194,8 700,6 Profit before income tax 1 333,6 1 092,3 1 206,3 (13,4)
(13,4) (13,5) Income tax paid (225,8) (350,0) (351,7) 57,5
43,7 50,9 Interest received 52,5 44,2 58,2 (1,5)
(2,8) (5,7) (Profit)/loss on disposals of non-current assets (4,2) (1,9) 3,5 624,1
456,2 469,7 Depreciation 1 008,9 991,2 1 335,7 (438,0)
(38,3) (541,9) Net finance income/costs 257,1 277,7 355,9 23,1
271,4 539,2 Other changes 75,4 (274,2) (25,5) 661,7
911,6 1 199,3 Net cash generated from operating activities 2 497,5 1 779,3 2 582,4
Cash flow from investing activities
(2 074,1)
(1 384,9) (1 379,9) Investments in property, plant and equipment (PPE) (2 786,3) (2 598,9) (3 914,7) 11,0
9,2 5,3 Proceeds from sale of PPE, incl assets under construction 5,5 10,0 13,2 (1 250,0)
(650,0) (1 050,0) Loans to subsidiaries - - -108,5
(6,6) 38,2 Interest received from subsidiaries - - -451,2
- 565,9 Net group contributions - - -(7,1)
- (22,2) (22,2) - (5,9) (2 760,5)
(2 032,3) (1 842,7) (2 803,0) (2 588,9) (3 907,4)
Cash flow from financing activities
2 207,8
1 540,3 3 650,0 Proceeds from borrowings 3 650,0 1 540,3 2 207,8 (254,4) (254,0) (1 158,0) Repayment of borrowings (1 423,9) (527,5) (772,2) (207,6) (113,4) (142,1) Interest paid (203,6) (171,7) (482,9) - (29,2) Borrowing costs (29,2) -(421,8)
(421,8) (463,4) Dividends paid to shareholder (463,4) (421,8) (421,8) 1 324,0 751,1 1 857,3 1 529,9 419,3 530,9 (774,8) (369,6) 1 213,9 1 224,4 (390,3) (794,1) 2 064,1 2 064,1 1 289,3 1 315,7 2 109,8 2 109,8 1 289,3 1 694,5 2 503,2 2 540,1 1 719,5 1 315,7
Net cash used in investing activities
Net cash generated/used in financing activities
Avinor Group
Nine months ended September
Avinor AS
Nine months ended September
Net (decrease)/increase in cash, cash equivalents and bank overdrafts
Cash, cash equivalents and bank overdrafts at beginning of year
Change in other investments
Cash, cash equivalents and bank overdrafts at end of the third quarter
15
Avinor Group
Notes to the interim financial statements
Note 1 - General information
Avinor AS and its subsidiaries (together 'the group') own, manage and develop aviation infrastructure and systems by facilitating safe and efficient aviation. The group also renders services within the same areas together with other activities that add to the group's main business, including commercial development.
The Avinor group's headquarters are located in Oslo.
The interim financial information was approved for issue on 21 November 2013. The interim financial information has not been audited.
Note 2 - Basis of preparation and accounting policies
The interim financial statement for Avinor AS and Avinor Group for the third quarter, ended 30 September 2013, has been prepared in accordance with International Financial Reporting Standards (IFRS) and encompasss Avinor AS and all its subsidiaries.
The interim financial information has been prepared in accordance with IAS 34 Interim financial reporting. The interim financial information should be read in conjunction with the annual financial statement for the year ended 31 December 2012.
The accounting policies are consistent with those of the annual financial statement for the year ended 31 December 2012, except for the adoption of new standards effective as of 1 January 2013.
New standards, interpretations and amendments adopted by the group:
IAS 1 Presentation of Items of Other Comprehensive Income.
The amendments to IAS 1 introduce a grouping of items presented in other comprehensive income (OCI). Items that could be reclassified (or recycled) to profit or loss at a future point in time now have to be presented separately from items that will never be reclassified. The amendment affected presentation only and had no impact on the Group's financial position or performance.
IAS 19 Employee Benefit (Revised 2011).
IAS 19R includes a number of amendments to the accounting of defined benefits plans, including actuarial gains and losses that are now recognised in other comprehensive income (OCI) and permanently excluded from profit and loss; unvested past service costs are now recognised in profit and loss at the earlier of when the amendments occurs or when related restructuring or termination costs are recognised, and; expected returns on plan assets that are no longer recognised in profit and loss instead, there is a requirement to recognise interest on the net defined liability (asset) in profit and loss, calculated using the discount rate used to measure the defined bebefit obligation.
In case of the Group , the transition to IAS 19R had an impact on the net defined benefit obligations due to the difference in accounting for interest on plan assets. The effect of the adoption of IAS 19R is explained in Note 8.
Note 3 - Segment information
Avinor Group
Other Medium Air Oslo large and small Navigation
All amounts in MNOK Airport airports airports Services Others Elimination Total
Nine months ended 30 September 2013:
Traffic income 1 398,6 1 028,4 669,0 704,9 (0,5) 3 800,5 Other income 2 127,6 917,0 434,8 178,1 3,5 3 661,1 Inter-segment income 60,0 60,3 20,1 548,5 686,3 (1 375,1) -Total income 3 586,2 2 005,8 1 123,9 1 431,5 689,3 (1 375,1) 7 461,6 Employee benefits expenses 392,6 253,4 609,9 996,8 218,1 2 470,7 Depreciation and amortisation 504,2 168,6 242,4 67,5 25,7 1 008,4 Other operating expenses 820,4 373,7 711,5 266,7 219,0 2 391,3 Inter-segment expenses 487,2 293,5 395,6 72,6 126,1 (1 375,1) -Total expenses 2 204,4 1 089,3 1 959,3 1 403,6 588,9 (1 375,1) 5 870,4
1 381,8
916,5 (835,4) 27,8 100,4 - 1 591,2
Group adjustments depreciation (a) 136,3 (49,4) (86,7) - (0,8) (0,5) Group adjustments lease (b) 291,9 (291,9)
-Operating profit/(loss) 1 810,0 867,1 (922,1) 27,8 (192,3) - 1 590,7
Assets* 8 502,4 4 407,7 5 470,6 599,0 136,5 19 116,2
Net income/(expense)
Avinor Group
Notes to the interim financial statements
Note 3 - Segment information continued
Avinor Group
Other Medium Air Oslo large and small Navigation
All amounts in MNOK Airport airports airports Services Others Elimination Total
Nine months ended 30 September 2012:
Traffic income 1 307,1 954,2 633,0 718,2 - 3 612,5 Other income 1 969,5 788,0 384,1 114,4 2,5 3 258,6 Inter-segment income 55,9 66,8 26,6 593,9 636,4 (1 379,6) 0,0 Total income 3 332,6 1 809,0 1 043,7 1 426,6 638,9 (1 379,6) 6 871,1 Employee benefits expenses 364,7 233,0 575,7 917,6 210,1 2 301,1 Depreciation and amortisation 487,4 156,6 233,3 68,6 32,0 978,0 Other operating expenses 822,6 349,5 593,0 239,9 203,9 2 208,8 Inter-segment expenses 480,6 278,4 464,0 81,8 74,9 (1 379,6) (0,0) Total expenses 2 155,3 1 017,5 1 865,9 1 307,9 520,8 (1 379,6) 5 487,9
1 177,2
791,5 (822,2) 118,7 118,1 - 1 383,2
Group adjustments depreciation (a) 123,6 (49,4) (86,7) - (0,7) (13,2) Group adjustments lease (b) 291,2 (291,2)
-Operating profit/(loss) 1 592,0 742,1 (908,9) 118,7 (173,8) - 1 370,0
Assets* 7 303,3 4 237,6 5 114,7 652,0 152,7 17 460,3 (a) Group adjustments due to assessment of the opening balance as at 1 January 2003.
(b) The lease on the land at Gardermoen is attributed to Oslo Lufthavn AS in the segment reporting. * Inclusive other intangible assets, exclusive assets under construction.
Note 4 - Property, plant and equipment, other intangible assets
Other intangible assets Property, plant and equipment Assets under construction Total Other intangible assets Property, plant and equipment Assets under construction Total At 30 September 2012
Opening net book amount 61,4 7 389,4 1 814,5 9 265,3 61,4 16 889,7 3 170,8 20 121,9
Additions - 883,1 1 573,1 2 456,2 - 1 508,4 2 939,0 4 447,4
Reclassification - - 883,1 883,1 - - 1 508,4 1 508,4
Disposals - 6,3 - 6,3 - 8,1 - 8,1
Depreciation charge 11,3 444,9 - 456,2 11,3 979,9 - 991,2
Closing net book amount 50,1 7 821,3 2 504,5 10 375,9 50,1 17 410,1 4 601,4 22 061,6 At 30 September 2013
Opening net book amount 46,4 8 589,6 2 261,7 10 897,7 46,4 18 255,5 4 552,3 22 854,2
Additions - 390,7 1 420,9 1 811,6 - 1 824,1 2 998,2 4 822,3
Reclassification - - 390,7 390,7 - - 1 824,1 1 824,1
Disposals - 0,7 - 0,7 - 0,9 - 0,9
Depreciation charge 11,3 458,5 - 469,7 11,3 997,7 - 1 008,9
Closing net book amount 35,1 8 521,1 3 291,9 11 848,2 35,1 19 081,0 5 726,4 24 842,5 Measurement of recoverable amount
There are no significant changes affecting the recoverable amount of the group's assets in 2013. All amounts in MNOK
Avinor AS Avinor Group Net income/(expense)
17
Avinor Group
Notes to the interim financial statements
Note 5 - Borrowings
All amounts in MNOK 2013 2012 2013 2012
Non-current 6 317,1 4 379,6 11 672,3 10 245,1 Current 1 203,2 2,7 1 716,3 515,9 Total 7 520,3 4 382,3 13 388,6 10 761,0
Movement in borrowings
Opening net book amount 5 053,6 3 100,7 11 187,9 9 752,9 Proceeds from borrowings 3 650,0 1 540,3 3 650,0 1 540,3 Repayment of borrowings (1 158,0) (254,0) (1 423,9) (527,5) Changes in value (25,3) (4,7) (25,3) (4,7) Closing net book amount 7 520,3 4 382,3 13 388,6 10 761,0 Avinor AS has issued bond loans noted on the Stock Exchange with a total nominal value of MNOK 2,450, lending date 22 April 2013. In connection with the issue, Avinor AS has redeemed parts of the bond loan from 2009, redemtion amount MNOK 453.
Liquidity reserves
All amounts in MNOK 2013 2012 2013 2012
Cash and cash equivalents 2 503,2 1 694,5 2 540,1 1 719,5 Unused bank overdraft 800,0 300,0 800,0 300,0 Unused credit facility 4 000,0 2 000,0 4 000,0 2 000,0 Unused drawing right (Ministry of Transport and Communication) - - 100,0 100,0 Total 7 303,2 3 994,5 7 440,1 4 119,5 The group has sufficient headroom to enable it to conform to covenants on existing borrowings and sufficient funds to service this years planned investments. 30 September Avinor AS 30 September Avinor AS 30 September Avinor Group 30 September Avinor Group
Avinor Group
Notes to the interim financial statements
Note 6 - Financial instruments Fair value estimation
The fair value of foreign exchange forward contracts and financial power forward contracts is based on market value at the balance sheet date. The fair value of all interest rate swaps is confirmed by the financial institutions which are the company's opposite party in the financial contracts entered into.
The carrying amount of cash and bank overdrafts is approximately equal to the fair value of these instruments as they fall due in a short period of time. Similarly, the carrying amount of receivables and payables is approximately equal to fair value as they are entered into under "normal" conditions. The fair value of long-term debt is based on quoted market prices or on the interest rates for debt with corresponding terms and similar credit risk. The fair value of commercial papers equals principal amount as at 30 September 2013.
Below is a comparison of the carrying amounts and fair values of Avinor AS and the group's interest-bearing debt.
All amounts in MNOK
Interest-bearing debt Fair value Fair value
State loan - - 4 527,0 4 584,8 Bonds 3 246,5 3 380,9 3 246,5 3 380,9 Bank borrowings 3 025,3 3 215,2 4 366,7 4 556,7 Commercial papers 1 200,0 1 200,0 1 200,0 1 200,0
The table below shows financial instruments at fair value by level of the following fair value measurement hierarchy: *Quoted prices (unadjusted) in active markets for identical assets or liabilities (level 1).
*Inputs other than quoted prices included within level 1 that are observable for the asset or liability, either directly (that is, as prices) or indirectly (that is, derived from prices) (level 2).
*Inputs for the asset or liability that are not based on observable market data (that is, unobservable inputs) (level 3). The following table presents the group’s assets and liabilities that are measured at fair value at 30 September 2013:
Level 1 Level 2 Level 3 Total Assets
Financial assets at fair value through profit or loss 0,0 1,3 0,0 1,3 Derivatives used for hedging 0,0 6,6 0,0 6,6
Total assets 0,0 7,9 0,0 7,9 Liabilities
Financial liabilities at fair value through profit or loss 13,4 22,7 0,0 36,1 Derivatives used for hedging 0,0 93,9 0,0 93,9
Bonds 0,0 0,0 0,0 0,0
Total liabilities 13,4 116,6 0,0 130,0
Note 7 - Impact on earnings - Terminal 2 project
As a result of the development of Gardermoen (Terminal 2 project) the income statement includes charges for extra costs related to the mainenance of normal operations during the construction period, as well as costs related to the scrapping of assets, including higher depreciation as a result of re-assessed economoc life.
Specification
Year All amounts in MNOK 2013 2012 2013 2012 2012 Employee benefits expense 12,1 10,1 32,6 26,0 35,5 Depreciation, amortisation and impairment charges 16,4 24,3 79,7 101,3 132,0 Other operating expenses 14,9 52,3 71,3 84,5 140,5 Sum 43,4 86,7 183,6 211,8 308,0
Avinor AS Avinor Group
30 September 30 September
Carrying amount Carrying amount
Nine months ended September Third quarter
19
Avinor Group
Notes to the interim financial statements
Note 8 - Employee benefits
IAS 19R has been applied retrospectively from 1 January 2012. As a result, expected returns on plan assets of defined benefit plans are not recognised in profit or loss. Instead, interest on net defined obligation is recognised in profit or loss, calculated using the discount rate used to measure the net pension obligation.
The adoption of IAS 19R results in an increased pension cost of approximately 100 MNOK for the group and 90 MNOK for the parent company in 2012.
Spesification of impact MNOK Nine months ended Nine months ended
September Year September Year
2012 2012 2012 2012
Income statement:
Employee benefits expense 67,5 90,0 75,0 100,0 Income tax expense (18,9) (25,2) (21,0) (28,0) Profit/(loss) for the first quarter/year (48,6) (64,8) (54,0) (72,0) 30 September Year 30 September Year
2012 2012 2012 2012
Equity:
Actuarial gains on post employment benefit obligations 67,5 90,0 75,0 100,0 Tax effect (18,9) (25,2) (21,0) (28,0) Net actuarial gains on post employment benefit obligations 48,6 64,8 54,0 72,0
Net impact on equity:
Other reserves 48,6 64,8 54,0 72,0 Other equity (48,6) (64,8) (54,0) (72,0) Total - - -
-at the end of the prior financial year. In this calcul-ation the discount r-ate was determined based on the interest r-ate of Norwegian St-ate oblig-ations. The Norwegian Accounting Standards Board have in their latest guidance accepted that a discount rate based on the Norwegian covered bonds market may be used as a basis for the calculation.
Based on this the Avinor group has as at 30 September 2013 used the discount rate based on the Norwegian covered bonds market in calculating the obligation. The effect of this is a reduction in the obligation. At the same time the new mortality table, called K2013, is also used in the calculation of the pension obligation. The effect of this is a increase in the obligation. The total effect is presented in the Statement of comprehensive income.
Note 9 - Income tax expense
The income tax expense is calculated using the expected annual effective tax rate.
The Norwegian Government presented on 8 November 2013 a proposal to reduce the annual tax rate from 2014. The proposal will result in a reduction of the deferred tax asset by approximately 70-80 MNOK and a an corresponding increase in the income tax expense in 2013.
Note 10 - Dividends
Dividends related to the annual financial statement for the year ended 31 December 2012 of 463,4 MNOK were disbursed in July 2013.
In accordance with IAS 34 the pension cost for the interim period is calculated at year-to-date basis by using the actuarially determined pension cost rate