[CANCER RESEARCH54, 6167—6175,December 1, 19941
ABSTRACT
Calcium (@2+) accumulates within the endoplasmic reticulum of cells through function of the sarcoplasmic reticulum and endoplasmic reticu lum Ca2@-dependent ATPase family of intracellular Ca2@-pumping ATPases. The resulting pools have important signaling functions. Thap sigargin (TG) is a sesquiterpene @‘-lactonewhich selectively inhibits the sarcoplasmic reticulum and endoplasmic reticulum Ca24-dependent ATPase pumps with a 50% inhibitory concentration of approximately 30 aM. Treatment of androgen-independent prostate cancer cells of both rat
and human origin with TG inhibits their endoplasmic reticulum Ca2'-dependent ATPase activity, resulting in a 3—4-foldelevation in the level of intracellular free Ca24 (Cat) within minutes of exposure. Due to a second ary influx ofextracellular Ca24, this increase in Ca@is sustained, resulting in morphological (cell rounding) and biochemical changes within 6—12 h (enhanced calmedulin, glucose regulated protein, and tissue transglutami nase expression, and decreased expression of the G1 cydlins). Within 24 h ofexposure, androgen-independent prostatic cancer cells stop progression through the cell cycle, arrest out of cycle in G@,and irreversibly lose their ability to proliferate with a median effective concentration value of 31 aM TG. During the next 24—48h, the genomic DNA of the G0-arrested cells undergoes double-strand fragmentation. This is followed by the loss of plasma membrane integrity and fragmentation of the cell into apoptotic bodies. During this process, there is no acidification in the intracellular pH. Using cells transfected with the avian Mr 28,000 t@*IlbifldiflD Ca2@ buffering protein, It was demonstrated that the programmed death haiti ated by TG is critically dependent upon an adequate (i.e., 3—4-fold) sustained (>1 h) elevation in Ca@and not depletion of the endoplasmic reticulum poo1s of Ca24. These results demonstrate that TG induces programmed cell death in androgen-independent prostatic cancer cells in
a dose-dependent manner and that this death does not require prolifera tion or intracellular addification but is critically dependent upon an adequate, sustained (i.e., >1 h) elevation in Ca1.
INTRODUCTION
Androgen ablation therapy is initially beneficial to nearly all men with metastatic prostatic cancer. Unfortunately, relapse to an andro gen-insensitive state is almost inevitable for essentially all patients, and additional forms of anti-androgen therapy are ineffective, no matter how aggressively given, due to the continued growth of an drogen-independent prostatic cancer cells (1, 2). Typically, chemo therapeutic agents for the treatment of cancer are toxic for dividing cells only. However, the low rate of proliferation of androgen-inde pendent prostatic cancer cells renders such agents ineffective (3). Thus, a novel cytotoxic therapy not requiring cell proliferation is urgently required for these devastating cells.
Received 4/22/94; accepted 9/28/94.
The costs of publication of this article were defrayed in part by the payment of page charges. This article must therefore be hereby marked advertisement in accordance with 18 U.S.C. Section 1734 solely to indicate this fact.
I Supported by NIH grant CA58236.
2 Present address: Section of Urology, Department of Surgery, University of Trond heim, N-7000 Trondheim, Norway.
3 To whom requests for reprints should be addressed, at Johns Hopkins Oncology
Center, 422 N. Bond Street, Baltimore, MD 21231.
Previously, we have demonstrated that both androgen-dependent normal prostatic glandular cells and androgen-dependent prostatic cancer cells can be induced to undergo apoptosis following androgen ablation and that this programmed cell death does not require entry into or progression through the cell cycle (4—6).Associated with this apoptosis is the enhanced expression of a series of genes (7, 8), resulting in a sustained elevation of Ca,4 (9, 10). This results in the activation of Ca2@IMg2tdependent endonuclease present within the cell's nucleus which double strand fragments the genomic DNA, thus committing the cell to death (9—11). Androgen ablation does not induce the changes in Ca1 required to induce programmed cell death in androgen-independent prostatic cancer cells (12); however, these cells can be induced to undergo programmed cell death if a modest (3—4-fold)elevation in Ca1 is sustained for a sufficient time (minutes to hours) (12).
TG, a sesquiterpene -y-lactone isolated from the root of the umbel liferous plant, Thapsia garganica, is highly lipophilic and irreversibly inhibits the SERCA enzymes with an IC50 value of @30nt@i(13). TG is highly selective since PMCA are not inhibited by TO, even at p.@ concentrations (13). Cytoplasmic Ca2@ levels are maintained in the order of 20—40nM by both classes of Ca2tpumping ATPases which either transport Ca2@ out of the cell across the plasma membrane (PMCA) or sequester Ca2@within internal pools such as those located in the ER (SERCA). While the absolute concentration of Ca24 within the ER is not known, it is likely to exceed 100 p.M, and it is apparent that the SERCA family of Ca2@/ATPases constantly compensate for the release of (@2±across the ER membrane, either by passive leak or by second messenger-activated Ca2@ channels (13). Interestingly, depletion of the ER Ca2@ pool results in the generation of a signal, possibly an ER-derived diffusible messenger, which induces an in creased permeability of the plasma membrane to divalent cations and a sustained elevation of Ca, (14, 15).
Previous studies have demonstrated that TO treatment rapidly stops cells from entering the S phase of the cell cycle (16). Given that TO can cause sustained elevation in Ca1 and stop entrance into S phase, we tested whether TO treatment alone may be sufficient to induce apoptosis of androgen-independent prostatic cancer cells without en trance into the S phase. These studies demonstrated that TO blocks entrance of the androgen-independent prostatic cancer cells into the S phase and induces their programmed death (17, 18). These results raised three major questions: (a) does the elevation of Ca1 induced by TO result in a secondary decrease in cellular pH? This possibility is based upon the demonstration that, in certain cell types induced by certain agents, such a secondary acidification, not the rise in Ca1, activates the endonuclease involved in the double strand DNA frag
4 The abbreviations used are: Ca', intracellular free Ca2@ concentration; TG, thapsi
gargin; SERCA, sarcoplasmic reticulum and endoplasmic reticulum Ca2'-dependent
ATPase; IC5@,,50% inhibitory concentration; PMCA, plasma membrane Ca2@-dependent ATPase; ER, endoplasmic reticulum; EC@, effective concentration of TG which causes 50% of the cells to undergo apoptosis; FITC, fluorescein isothiocyanate; PBS, phosphate buffered saline; pH1, intracellular PH; BCECF, 2',7'-bis(carboxymethyl)-5(6)-carboxy
fluorescein; CAM, calmodulin; GRP, glucose-regulated M, 78,000 protein; TTG, tissue transglutaminase; calbindin D-28Kd, avian M, 28,000 calbindin D.
6167
The Role of Calcium, pH, and Cell Proliferation in the Programmed (Apoptotic)
Death of Androgen-independent Prostatic Cancer Cells Induced
by Thapsigargin'
Yuzo Furuya, Per Lundmo,2 Alison D. Short, Donald L. Gill, and John T. Isaacs@
The Johns Hopkins Oncology Center (1'. F., P. L. J. T. I.]. James Buchanan Brady Urological Institute and the Department of Urology If. T. 1.1. Johns Hopkins School of Medicine, Baltimore, Maryland 21205. and The Department ofBiochemistry. University ofMarvland School ofMedicine. Baltimore, Maryland 21201 (A. D. S.. D. L G.J
THAPSIGARGIN AND PROGRAMMED CELL DEATh mentation characteristic of apoptotic cell death (19); (b) is the deple
tion of the Ca2@ pools, and not the elevation of Ca1, induced by TO, the critical initiator of programmed cell death in prostatic cancer cells? This possibility is based upon the demonstration that depletion of the ER pools of Ca2@ can up-regulate the expression of a series of genes encoding ER proteins without a requirement for a elevation in Ca. (20, 21); (c) is the inhibition of entrance of the cells into the S phase of the cell cycle induced by TO due to a block in progression of the cells in O@of the cycle, or do prostatic cancer cells leave the cycle and enter a O@ state from which the cells are recruited to undergo programmed cell death? This possibility is based upon the demonstration that androgen ablation recruits androgen-dependent protein cells from O@into the programmed death pathway (6, 8). The present studies were performed to evaluate these three questions using
a seriesof four distinct androgen-independent
prostatic cancercell
lines of both rat (Dunning AT-3) and human (TSU-Prl, DU-145, and PC-3) origin.
MATERIALS AND METHODS
Cell Lines. The rat AT-3, and human TSU-Prl, DU-145, and PC-3 andro gen-independent prostatic cancer cell lines were all cultured with RPM! 1640 media containing 10% fetal calf serum (Hyclone, Logan, UT) with 250 nM dexamethasone, 100 units/mI potassium penicillin 0, and 100 units/ml strep tomycin sulfate (antibiotics from M. A. Bioproducts, Walkerville, MD) as standard media in 5% C02/95% air at 37°C.The origins and characteristics of these lines have been described previously (12, 22—24).The total number of viable cells was determined by trypan blue exclusion analysis of total cell pools obtained by combining both attached and detached cells as described previously (12). The kinetics of morphological changes, using time-lapse
videomicroscopy, and the loss of clonogenic ability using total cell pools was
obtained by combining both attached and detached cells as described previ ously (12). The log of percentage clonogenic ability was plotted versus concentration of TG, and the concentration which reduced the clonogenic ability to 50% was extrapolated to determine the EC50. Cell cycle progression was examined in total cell pools by flow cytometry using the detergent-trypsin propidium iodide method of Vindelov et a!. (25). Bivariant analysis of the stained nuclei was performed on an Epics 752 flow cytometer (Coulter Corp., Hialeah, FL). DNA content was determined from the propidium iodide signal and by nuclear size forward angle light scatter. Cells were judged to be in G0-G1when they had a diploid DNA content with a small nucleus, in S when they had a diploid DNA content with a larger nucleus, and in G2-Mwhen they had a tetraploid DNA content with the largest nucleus. To determine if cells were in G0 or G1 when they had a diploid DNA content, flow cytometric immunocytochemical analysis was performed on total cell pools using the
Ki67 monoclonal antibody as described by Schwarting et al. (26). This 1067 monoclonal antibody reacts with a nuclear antigen present in all human cells
in the G@, S, G2, or M phase of the cycle, but not with cells in G0 (26). To
perform such analysis, single cell suspensions were fixed with acetone for 5
mm at room temperature and incubated with FITC-conjugated 1067 mouse monoclonal antibody (Dako, Irvine, CA) diluted 1:10 with PBS for 1 h at room temperature. To define the level of fluorescence which is nonspecific, cells
were similarly incubated with an irrelevant monoclonal antibody (FITC conjugated mouse monoclonal antibody to bromodeoxyuridine; Accurate
Chemicals, Westbury, NY). The cells were washed with PBS before flow
cytometry as described by Schwarting et a!. (26).
Determination of Microsomal Ca@2-ATPaseActivity. Microsomes, pre
pared from —5 x i07 cells, were isolated as described previously (27). Microsomes were suspended to a protein concentration of 1 mg/ml, and aliquots (50 i.@gprotein) were assayed for their Ca2@-ATPase activity using the coupled enzyme assay of Seidler Ctal. (28). These experiments were reported three independent times using microsomes isolated from three different batches of cells.
DNA Fragmentation Analysis. Double-strandDNA fragmentationwas
quantitated according to a modification of the pulse field gel electrophoresis method of Stamato and Denko (29) as described in detail previously (18). This
method involves uniformly labeling the genomic DNA with [‘4C]thymidine,
treating the labeled cells for various times with TG, and then embedding the
total cell pools (i.e., attached plus unattached cells) in agarose plugs. These agarose plugs are treated with protease and detergent as described previously (18) to release the genomic DNA without causing artificial fragmentation due to mechanical shearing. Such treated plugs are used as samples for inverted pulse gel electrophoresis as described (18), and gels were fractionated by cutting them into pieces corresponding to various kilobase sizes (i.e., 1
megabase and 300, 100, and 50 kilobases, etc.). Then the radioactivity was determined for each fraction. Qualitative analysis of the lower molecular weight (i.e., >10-kilobase) DNA fragments was performed using ethidium bromide staining of 1.5% agarose gels as described previously (18).
Ca@and pH1 Determination. AT-3 cells were grown on sealable glass coverslip tissue culture chambers (Lab-Tek; Nunc, Inc., Naperville, IL) using standard media described above. After an overnight period to attach, cells were
treated with nothing or TG for the indicated time; then the media was removed,
and the cells were loaded for 30 mm at 20°C with 2 @.tMFura-2 acetoxymeth
ylester (Fura-2/AM; Molecular Probes, Junction City, OR) in 4-(2-hydroxy ethyl)-1-piperazineethanesulfonic acid-Kreb's medium [107 mM NaC1, 6 mM KCI, 1.2 mMMgSO4, 1 nmi CaC12, 1.2 mMKH2PO4,11.5 ms@glucose, 0.1% bovine serum albumin, and 20 msi 4-(2-hydroxyethyl)-1-piperazineethanesul fonic acid-KOH (pH 7.4)J as described previously (16). The cells were then washed to remove extracellular Fura-2/AM and phenol red free RPMI 1644) media (i.e., containing 0.4 msi Ca2@added to the chambers), and the chambers were equilibrated with 5% CO2before being sealed. The sealed chambers were then placed on a 37°Cheated microscope stage, and the Ca1concentration per individual AT-3 cell was then determined using the fluorescence ratio method
[i.e., ratio of fluorescence at 505 nm induced by excitation at 340 am versus
380 nm (30)] on a Zeiss inverted microscope to which a PT! Model RF-M2010 photometer system (South Brunswick, NJ) was attached. Calibration of Fura-2 data was performed using a set of defined Ca2@buffers (calcium calibration kit I; Molecular Probes, Eugene, OR) and Fura-2 free acid (Molecular Probes) according to the manufacturer's detailed protocol. Using an Orion Ca2F spe cific ion meter, the concentration of free Ca2@in both standard media and
@2+supplemented media was determined.
For determination of pH1on a per cell basis, AT-3 cells were treated as for the Ca2@measurement, except they were loaded for 30 min at 37°Cwith 1 pM BCECF/AM (Molecular Probes) in Krebs-Ringer phosphate buffer (jH 7.4) as described previously (31). The cells were washed as mentioned above, and the ratio of fluorescence at 530 nm induced by excitation at 440 nm versus 500 nm
was measured and used to determine the pH1 per cell as described previously
(31). Calibration of the BCECF data was performed using a calibration curve of intracellular pH generated by incubating BCECF-loaded cells in varied pH buffer in the presence of the protein ionophore, nigericin, as described (31). For both the @2+and pH measurement, a minimum of 25 cells per experiment was analyzed, and the experiments were repeated 3 times.
RNA Isolation and Northern Analysis. Total RNA was prepared by the acid guanidiu.mthiocyanate-phenol-chioroform method from total cell pools
(i.e., attachedplus unattachedcells) as described previously (8). Northern blot
analysis and probes used for y-actin, tissue transglutaminase, and glucose regulated M, 78,000 protein were as described (8). The probe for cycin C, D1, E, and thymidine kinase was generously supplied by Dr. J. Carl Barrett,
National Institute of Environmental Health Sciences.
Calbindin DNA Transfections. AT-3 cells were transfected with either
the avian calbindin D-28Kd expression plasmid (i.e., pRCaBP nec plasmid
generously supplied by Dr. Diane Dowd, St. Louis University) or neomycin resistant pZipNeo control plasmid, and G418-resistant clones were isolated as described previously by Dowd et a!. (32). 0418-resistant clones were tested by Western blot analysis for expression of the calbindin D-28Kd protein as described by Dowd et a!. (32) using a commercially available mouse anti-avian calbindin D-28Kd monoclonal antibody (Sigma Chemical Co., St. Louis, MO).
Protein Synthesis Determination. Exponentially growing AT-3 cells were cultured with or without TO (500 nM) for various times in triplicate. One h before harvesting, 50 @Ciof [35S]methionine (37 TBq/mmol; Amersham, Arlington Heights, IL) was added to the media. The incubations were termi nated as follows. Media was removed, and any floating cells were harvested by centrifugation at 500 X g for 5 mm. The flask was washed three times with
Hanks' balanced salt solution, and the cells were trypsinized. Cells from the flasks were combined with the cells recovered from the media and counted
with a hematocytometer. The cells were then pelleted again and added to 2%
Table 2 Ability of TGtreatmentcellsCell to raise the Ca level in prostatic cancer lineCa1 (nsi)―No treatment500
nsiTO―
AT-3 TSU-Prl DU-145 PC-3 88± l4c100± 12c160±21c80 ±6cTable 1Response of the microsomalATPaseto TGtreatmentMicrosomal
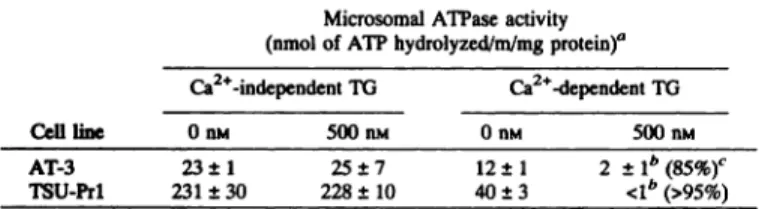
ATPase activityCell line(nmol of ATP hydrolyzed/m/mg protein)aCa2'-independent TO Ca2l@dependent TO0 nst 500 nsi 0 ns@ 500 nsiAT-3 TSU-Prl23±1 25±7 12±1 2+1b(85%)c 231±30 228±10 40 ±3 <1―(>95%)
ThAPSIGARGIN AND PROGRAMMED CELL DEATh sodium dodecyl sulfate/1% 3-mercaptoethanol.DNA was sheared by repeated
pipetting, and 50-pA aliquots were applied to glass microfiber filters (What man, Maidstone, United Kingdom). The filters were washed three times with 10% trichioroacetic acid and once with 70% ethanol, dried, and finally counted. The results were initially expressed as dpm incorporated into protein per 10@cells. These values were then normalized to the value for TO untreated control cells (i.e., 32,300 ±1,480 dpm/h/106 AT-3 cells = 100%).
CAM Radlolmmunoassay Aliquots of total cell pools (i.e., attached plus unattached) in triplicate were washed with PBS. Ten volumes of 50 msi Tris-HC1(pH 7.8), 3 mMMgSO4, 1 msi dithiothreitol, and 1 mMEOTA were added, and the tissue was homogenized with a Dounce homogenizer. The homogenate was centrifuged at 1,000 x g for 15 mm, and the resulting supernatant was further centrifuged at 100,000 X g for 1 h. The final super natant was used for determination of CAM using a radioimmunoassay kit (NEN Research Products, Boston, MA) according to the manufacturer's rec ommendation without heating.
Statistical Analysis. Values are expressed as the mean ±SE. Statistical analyses of significance were made by a one-way analysis of variance with the Newman-Keuls test for multiple comparison. Unless otherwise stated, each experiment was performed at least three independent times in triplicate for each data point.
RESULTS
Inhibition of the ER Ca2@ ATPase from Prostatic Cancer Cells by TG. Microsomes from both the rat AT-3 and human TSU-Prl cell
lines were assayed for their ER Ca24@-dependentATPase activity.
These results (Table 1) demonstrate that, while there is a 10-fold difference in the amount of Ca2@-independent ATPase activity in
these two prostatic cancer cell lines, there is only an —3-folddiffer
ence in the amount of Ca2@-dependent ATPase activity. Previous
studies of Thastrup et aL (13) reported that TO inhibits the microso
mal Ca@2-ATPasewith an IC50of —@30
fiM.Based upon these data, the
ability ofTO to inhibit the microsomal Ca2@-dependent ATPase from AT-3 and TSU-Prl cells was tested. Both lines were treated during exponential growth with 500 flM TO for 18 h, and microsomal prep
arations were made and assayed for their Ca2@-dependentand mdc
pendent ATPase activity as described in “Materialsand Methods.―As shown in Table 1, even after 18 h, TO inhibited the Ca2@-dependent activity by greater than 80% in both lines. Additionally, microsomes isolated from untreated AT-3 and TSU-Prl cells were assayed in the presence or absence of TO (500 nM). Within 1 mm of addition of TO to the assay tube, the Ca2@-dependent ATPase was completely (i.e.,
<99%)inhibited(datanotshown).
Effect of TG on Ca@and pH. The Ca. concentration in exponen
tially growing androgen-independent prostatic cancer cells of rat and human origin range between 16—40 nr@(Table 2). Following exposure to TO (500 n@i), Ca@rose rapidly (i.e., within 1 mm) to values exceeding 100 n@t,regardless of the cell line. During the next 5—10
mm, the Ca1decreasedto values in the range of 80—160
nr@i,
which
were maintained for hours, if extracellular free Ca2@ was maintainedat a valueof at least400 p@(Table2 presentsdataat 4 h of TO
exposure). If extracellular free Ca2@ was lowered to less than 50 nti
19±1 16±4
40±5 27 ±3 a Extracellular Ca2@ in 0.4 inst for all cell lines. b At 4 h after TO treatment.
C p < 0.05 difference when compared to no treatment value.
by including EDTA (5 mM) in the media, the initial TO-induced rise in Ca@remained unchanged. However, prolonged elevation of Ca@was not observed, and Ca@returned to —10—30nM. These results are consistent with TO inducing an initial elevation in Ca1 as pools of Ca2@ stored in the ER were released, followed by a sustained eleva tion due to the influx of extracellular Ca2@ across the plasma mem brane.
As pointed out by Barry et a!. (19), under certain conditions in certain cells, an increase in Ca1 can result in a secondary acidification of the cell to a pH of below 6.5. To test if this occurs following TO treatment of AT-3 cells, the pH1 was determined over the first 48 h of chronic exposure to 500 nM TO. The starting pH1 in AT-3 cells is 7.30 ±0.05. At no time point did the pH1 of the AT-3 cells ever decrease to below 7.00 (i.e., pH was 7.20 ±0.06, 7.18 ±0.05, 7.21 ±0.07, 7.27 ±0.15, 7.10 ±0.15, and 7.05. ±0.10 at 1, 2, 4, 24, 36, and 48 h of TO treatment, respectively). These results dem onstrate that a secondary acidification to a pH of below 7.0 following TO treatment of the AT-3 cells does not occur.
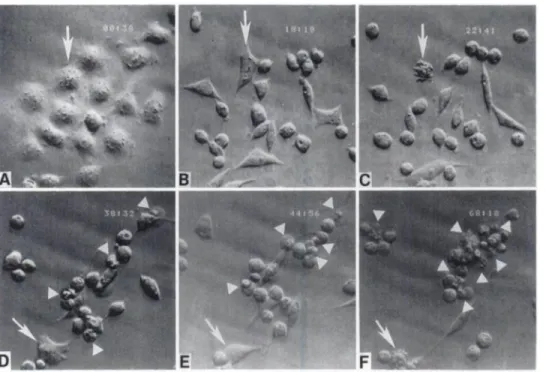
Effect of TG on the Morphology of Prostatic Cancer Cells. Time-lapse videomicroscopy demonstrated that no morphological changes occur during the first several hours of TO treatment. By 3—6 h of initial exposure to TO (500 nM), however, morphological changes began to occur in all of the androgen-independent prostatic cancer lines tested (AT-3, TSU-Prl, DU-145, and PC-3). By 12—24h of treatment, all cells are smaller and more rounded (compare Fig. 1, a and b; note that all six of the panels of Fig. 1 are from the exact same field over a 68-h observation period). After 24 h of treatment, the cells undergo periods of plasma membrane hyperactivity characterized by plasma membrane blebbing (Fig. 1, c and f, arrows). These surface blebs are highly dynamic, giving the appearance of membrane boiling, which is characteristic of programmed cell death as reported previ ously (12). Episodes of such blebbing continued until the cell lysed into membrane-bound apoptotic bodies (Fig. 1, d, e, and 1' arrow heads), which eventually detach from the plate. The time required before apoptotic lysis began varied between 36 and 72 h after initia tion ofTO treatment, depending on the different cell lines used. Times for morphological lysis of 50% of the rodent AT-3 cells was “60h, while @90h was required for morphological lysis of 50% of the human cells into apoptotic bodies.
Effect of TG on Cell Cycle Progression. Bivariant flow cytomet nc analysis was used to determine whether TO treatment affects the progression of androgen-independent prostatic cancer cells through the cell cycle. These analyses demonstrated that, within 24 h of exposure to TO (500 nM), prostatic cancer cells arrested in the G@,-O@ compartment of the cell cycle, (Fig. 2 presents data for AT-3 cells; TSU-Prl, PC-3, and DU-145 cells gave essentially identical results). This conclusion is based upon the observation that, by 24 h of exposure, the percentage of cells in S-phase decreases (P < 0.05) by more than 85% from values of —P30%to less than 5% for all four of the cell lines. During this first day of TO exposure, the percentage of cells in G2-M likewise decreases by one-half from values of —15to
—.7%
(Fig.2).By48hofTOtreatment,
thepercentage
ofcellsinthe
6169a
@ treated overnight with either control media (i.e., 0 nM) or 500 nsi TO before
microsomeswereisolatedand assayedfor ATPaseactivity. b p < o.os as compared to 0 nsi control group.
ThAPSIGARGIN AND PROGRAMMED CELL DEATh (@
4,
:
@
4
@‘@h11 @‘ @‘ Fig. 1. Morphological appearance of AT-3 cells
exposed to TO (500 nsi). All pictures are X 320 and are of the exact same microscopic field. Cells were exposed to TO for: 38 m (A, no change in
morphology compared to untreated AT-3 cells); 18 h, 18m (B);22 h, 41 m (C); 38 h, 32 m (D); 44 h, 56 m (E); and 68 h, 18 m (F). Arrows, the response of the same cell over time. D, E, and F. arrow
heads, apoptotic bodies.
I., @
A
@I.v @ “@E
F
S and O2-M phases combined was less than 2% of the total, regardless of the cell line examined. After this 48-h period, there was an increased incidence of apoptotic bodies detectable as small-sized particles with a less than O@DNA content (Fig. 2). Enhanced detec tion of these apoptotic bodies occurred after differing times of TO exposure for each of the four cell lines (i.e., >48 h for AT-3 cells and >72 h for TSU-Prl, PC-3, and DU.-145 cells). These results demon strate that, within 24 h of TO treatment, androgen-independent pros tatic cancer cells are no longer entering the S phase of the proliferative cell cycle.
To determine whether this inhibition of S phase entrance was due to arrest in G1 or to the cells leaving the cell cycle completely (i.e., cells in Ge), tWO approaches were undertaken. The first was to use flow cytometric immunocytochemical staining analysis using the 1067 monoclonal antibody to determine the percentage of cells which were negative for the antigen detected by this antibody. Schwarting et
al. (26) have demonstrated that this 1067 monoclonal antibody reacts
48hr.-TG
72hr.-TG
L@__@
@L
/@
Fig. 2. Cell cycle distribution of AT-3 cells following exposure to 500 ElMTO determined by bivariant (i.e.. nuclear size and DNA content) flow cytometric analysis.
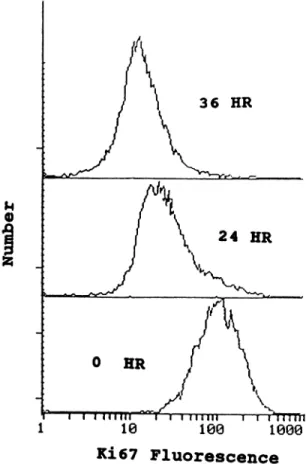
with a nuclear antigen present in all human cells in the O@,5, 02, or M phase of the cycle but not with cells in Or,. Unfortunately, this antibody is human specific and does not stain rodent cells consistently (26). Thus, the human TSU-Prl, DU-145, and PC-3 prostatic cancer cells were analyzed for the percentage of cells Ki67 negative (i.e., in O@)following exposure to 500 n@iTO. (Note: cells were defined as 1067 negative if their fluorescence value was below 20. This cutoff value was determined by staining cells with irrelevant FITC-labeled anti-bromodeoxyuridine monoclonal antibody). When the human prostatic cancer cells in exponential growth are analyzed, greater than 98% are positive for 1067 expression (Fig. 3 presents data for TSU pri cells; PC-3 and Du-145 cells gave essentially identical results). Within 24 h of TO exposure, the percentage of Ki67 negative cells increases from values <2% to values >80%, and by 36 h of exposure, >90% of the cells are Ki67 negative (Fig. 3). These results demon strate that TO treatment does not arrest the human prostatic cancer cells in O@but instead induces them to leave the proliferation cell cycle within 24 h of TO exposure and enter G@.
Similar flow cytometric analysis could not be performed with the rat AT-3 cells due to the human-specific nature of the Ki67 antibody. To determine whether a similar O@arrest occurs within 24 h of 500 n@ TO treatment of rat prostatic AT-3 cancer cells, the expression of a series of 05-specific genes was used. The genes chosen were the G1-cyclins (i.e., cyclin C, D1, and E) and thymidine kinase (33). As controls, expression of the CAM, GRP, and TTO genes were also analyzed, since we have demonstrated previously that these are un regulated within the first 24 h of exposure of AT-3 cells to 500 flMTO (18). These studies (Fig. 4) demonstrated that, within 6—12h, there was a greater than 80% decrease in the expression of all of O@cyclin
(i.e., cyclin E and thymidine kinase data are not shown in Fig. 4). This
decrease is not due to generalized RNA degradation, as demonstrated when blots were stripped and rehybridized with probes to CAM, ORP, iTO, or -y-actin. These results demonstrated that CAM mRNA is up-regulated within 1 h and decreases at 12 h of TO treatment. In contrast, ORP mRNA induction occurs at 6 h and decreases after 12 h, while TTO mRNA is constant until there is an @3-foldinduction per cell between 24 and 36 h after initiation of TO treatment. ‘y-Actin mRNA remains constant per cell, at least up to 36 h of TO treatment. 6170 *@ -@.,#
‘@ “p
‘@
(tb.Sl@c@@
@
THAP5IGARGINAND PROGRAMMEDCELLDEATH
50-kilobase size pieces become detectable and eventually, even small sized (i.e., <lO-kilobase) pieces become detectable. Qualitative anal ysis of the small (i.e., <lO-kilobase) size DNA fragments using standard DNA isolation and gel electrophoresis demonstrated a nu cleosomal size-repeating ladder characteristic of programmed cell death (Fig. 5, right side).
After an additional 10—24h period, the cells begin to undergo changes in their plasma membrane integrity, and by 58 h for the AT-3 cells and 84 h for the TSU-Prl cells, 50% of the cells take up trypan blue. These kinetics are consistent with morphological data which demonstrated that 50% of the AT-3 and TSU-Prl cells lyse into apoptotic bodies by 60 and 90 h, respectively. Likewise, changes are consistent in nuclear morphology, detectable by staining cells at various times of TO exposure with the fluorescent DNA binding dye, Hoescht 33342. These studies demonstrated that nuclear chromatin initially becomes condensed and marginated, and the nuclei become smaller. Eventually, the nuclei themselves become fragmented within the cell. A comparison of the frequency of such nuclear change demonstrated that these changes are coincident with the kinetics of DNA fragmentation.
The data in Fig. 5 demonstrated that exposure to 500 nMTO for up to 12 h results in no loss of clonogenic ability or viability. This confirms that TO effects are reversible up to a certain time point. After 24 h of TO exposure (the time when DNA fragmentation is initiated), however, AT-3 cells become irreversibly committed to eventual death, although during this period, there is no decrease in cell viabil ity, as judged either by videomicroscopy or trypan blue exclusion. These data demonstrate that TO treatment initially arrests androgen independent rodent and human prostatic cancer cells in G@,and then
•1S1'
UI 4 @ @—
,; ..•_4• @ @ : , it@Ø@ @Ø @I I I I I 1 I
0
1
2
6122436
1.4I
Ki67 FluorescenceFig. 3. Flow cytometric analysis of porportion of TO (500 nst) treated and untreated ThU-Pr! cells expressing proliferative cell cycle nuclear protein detected by Ki67 mono
clonal antibody. Nonspecific fluorescence was determine to be below a channel number of 20, based upon incubation with the irrelevant FITC-labeled anti-bromodeoxyuridine monoclonal antibody.
These results demonstrate that TO treatment does not arrest the rodent prostatic cancer cells in O@but instead induces them to leave the proliferative cell cycle within 24 h of TO exposure and enter O@.
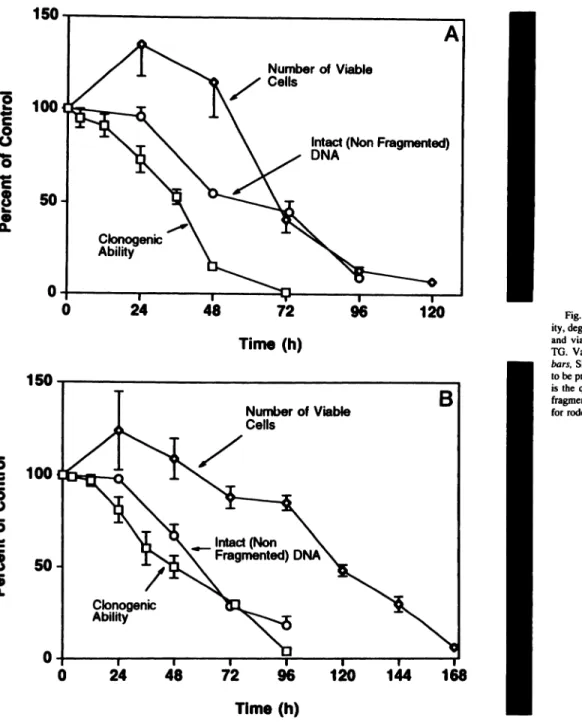
Effect of TG on the Clonogenic Ability, Viability, Nuclear Morphology, and DNA Fragmentation of Prostatic Cancer Cells. The morphology and flow cytometric data demonstrated that exposure to TG (500 EM) @5cytotoxic to all four of the androgen-independent prostatic cancer cell lines tested. To confirm that this response is due to induction ofprogrammed cell death, the temporal pattern of double strand DNA fragmentation was determined following exposure of both the AT-3 and TSU-Prl androgen-independent prostatic cancer cell lines to TO (500 nM). As reference points, the temporal pattern of loss of clonogenic ability and cell viability were also investigated.
Comparison of data demonstrates that TO treatment results in a decrease in clonogenic (i.e., proliferative) ability within the first 24 h of exposure. This is consistent with the flow cytometric and mRNA data, which demonstrated arrest in O@during the first 24 h of exposure (Figs. 2—4).Following a 24-h lag period, DNA fragmentation corn mences, and the time required for 50% of the DNA to be fragmented is @48h for the AT-3 (Fig. 5a) and @6Oh for TSU-Prl cells (Fig.
5b). Special samples preparation is required to avoid mechanical
shearing of the DNA, and special electrophoresis (i.e., inverted pulse gel electrophoresis) is needed to accurately determine the initial size of the double-strand DNA fragments produced during this death process. Using these special procedures, when DNA is analyzed from untreated cells, the DNA is >1 megabase and does not enter the gel. In contrast, when cells are treated with TO, these analyses demon strated that the earliest detectable double-strand DNA fragments which enter the gel are Mr ‘@300,000in size. With additional time,
1 10 100 1000
CAM
GRP
TTG
CyclinD
CyclinC
actin
TG Exposure(HR)
Fig. 4. Northern analysis of the temporal changes in the mRNA expression of a series
of genes in AT-3 cells following exposure to 500 EMTO. Representative analysis from three separate analysis of three pools of cells at each time point.
THAPSIGARGIN AND PROGRAMMED CELL DEATh
Fig. 5. Temporal changes in the clonogenic abil ity, degree of double-stranded DNA fragmentation, and viability of cells during exposure to 500 nst TO. Values represent the mean (n = 3—5/point); bars. SEM. For some points, the SEM is too small to be presented graphically. Inset on right of figure is the qualitative pattern of double-stranded DNA
fragments isolated at 24 h of TO treatment. A, data for rodent AT-3 cells. B. data for TSU-Prl cells.
TO induced the initiation of DNA fragmentation. Once DNA frag mentation is initiated, cellular fragmentation into apoptotic bodies occurs 12 h later for rodent cells and 24 h later for human cells. Thus, DNA fragmentation is not the result of cellular fragmentation and death. These data are consistent with double-strand DNA fragmenta tion being the irreversible commitment step in TO-induced death of nonproliferating cancer cells. To further test this possibility, AT-3 cells were exposed to varying concentrations of TO for 48 h and then tested for the clonogenic survival in TO-free media. These dose response studies demonstrated that the concentration of TO required to irreversibly commit 50% (i.e., EC50) of AT-3 cells to programmed death within 48 h of chronic exposure is 31 nr@i,a value essentially identical to the IC50 value for TO inhibition of the ER Ca2@-ATPase. Role of Elevated Ca@versus Ca2@ Depletion. The 3-4-fold dc vation in Ca. in AT-3 cells induced by treatment with 500 nM TO (Table 2) is rather modest. This raises the issue of whether it is this modest elevation in Ca., or the depletion of the ER pools of Ca2@, which is the actual initiator of programmed death of the AT-3 cells.
One way to differentiate between these two possibilities, initially developed by Dowd et al. (32), is to transfect cells with an expression
vector for the calbindin D-28Kd calcium binding protein and test the
effect that high calbindin protein expression has upon the toxic
response to TO (32). Since one molecule of calbindin D-28Kd protein
binds six molecules of Ca2@ (32), overexpression of this protein should be able to buffer elevations in Cat-induced by TO treatment without preventing the depletion of the ER pool of sequestered Ca2@. Thus, if elevation in Ca, and not simply depletion of the stored ER
Ca2@pool are critically required to activate programmed death of
AT-3 cells induced by TO, then such calbindin D-28Kd overexpres sion should protect these cells from such activation.
To test these possibilities, AT-3 cells were transfected with either a neomycin resistance expression vector containing the full-length corn plementary DNA for the calbindin D-28Kd protein or a control vector
containing only the neomycin resistance gene. Multiple calbindin
D-28Kd neomycin resistance clones (i.e., CaBP clones) and neo-only
control (i.e., neo) clones were isolated following both types of 6172 0
C
00
I
0 C 00
C@
50
Tim
(h)
96
120
144
168
Time (h)
Percentage loss of clonogeni Cell type― 0.4 msi Ce2@c
ability in mediacontaining1
.0 mst81±9―
85 ±6b
50±11b.c
52 ±0b.
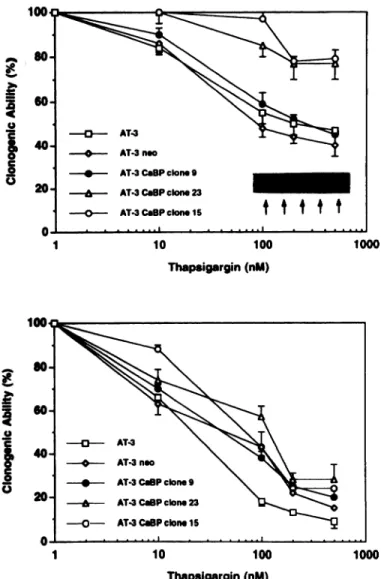
treatment is extended to 48 h (Fig. 6, lower panel). These results suggest that, by 48 h of continuous TO treatment, the influx of extracellular Ca2@ saturates the binding capacity of the intracellular calbindin D-28Kd protein, even in the high-expressing CaBP clones
15and23 cells.
To further clarify the role of elevation in Ca@in the cytotoxic response of TO, the effect of varying the extracellular Ca2@ on the TO-induced loss of clonogenic ability of control AT-3 cells and high-expressing CaBP clones 15 and 23 were tested. The standard media (i.e., RPM! 1640 containing 10% fetal calf serum) has rather low levels (0.4 mM) of free Ca1. Sufficient Ca2@ was added to this standard media to raise the concentration of free Ca2@ from 0.4 mr@ito 1.0 mM. Using both medias containing 0.4 or 1.0 mrvtfree Ca2@, the extent ofloss of clonogenic ability induced by 36 h of exposure to 500
flM TO was determined (Table 4). These results demonstrated that, by
increasing the extracellular Ca2@, the extent of loss of clonogenic ability induced by 36 h if exposure to 500 nM TO was increased
(P < 0.05) for all cell types. The extent of loss of clonogenic ability
of the high calbindin-expressing CaBP 15 and 23 clones were still, however, lower (P < 0.05) than for the AT-3 parental or neo control transfectants. These increases in loss of clonogenic ability in the higher Ca2tcontamning media were consistent with an enhanced ability of 500 nM to TO to elevate the Ca. in these cells. For example, the Ca, after 20 mm of exposure to 500 nM TO in the 1.0 mt@ias compared to 0.4 mM Ca2tcontaining media was @2.2-foldhigher in the AT-3 parental and neo control transfectant (i.e., 150 ±20 versus 67 ±4 nM) and 1.8-fold higher in the high calbindin-expressing CaBP
clones (i.e., 77 ±9 versus 44 ±3 nM). Again, even in the higher
Ca2@-containing media, TO treatment did not induce as high an increase in Ca1 in high calbindin-expression CaBP clones as parental or neo-only control transfectants.
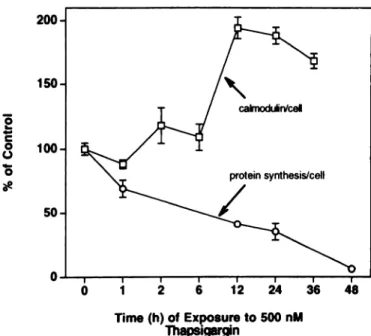
Effect of TG on Protein Synthesis. Programmed cell death often involves transcriptional induction of specific genes and enhanced translational expression of the corresponding encoded protein product. When a 3—4-fold elevation in Ca. is maintained in AT-3 cells by exposure to TO (500 nM), a series of such epigenetic changes are induced (Fig. 4). One of the genes induced encodes for the multifunc tional calcium-binding protein, CAM, which is involved in calcium dependent regulation of more than a dozen known enzymes (34). The level of CAM protein per AT-3 cell doubles between 6 and 12 h of exposure to 500 nM TO (Fig. 7). In contrast, total protein synthesis
Table 3 Ability of 500 n@ TG to raise the Ca, in AT-3 cells with differing calbindin
D-28Kd protein expression
Ca@(nM)
Low calbindin D-28Kd- Low calbindin High calbindin Time of TO expressing parental D-28Kd-expressing D-28Kd-expressing
exposure untransfected cells CaBP clone 9 cells CaBP clone 15 cells
None 23±1 23±2 24±1
20mm 67±4 102±4 44±3
12h 81±5 85±4 51±4
ThAPSIGARGINAND PROGRAMMEDCELLDEATh
Thapsigargin (nM)
I
1.)I
1000 Thapsigargin(nM)Fig. 6. Dose-response relationship between TO exposure and loss of clonogenic ability in AT-3parental,neo control(two),and calbindin-28Dkd(CaBP)transfectants.Upper pan4 36-h exposure. Lower panel, 48-h exposure. Bars, SEM.
I 10 100
transfection and screened for expression of calbindin D-28Kd by Western blot analysis. Such analysis identified two CaBP clones expressing large amounts of the calbindin D-28Kd protein (i.e., clones 23 and 15) and one CaBP clone expressing low amounts (i.e., clone 9; see Pig. 6, upper panel, lower right-hand inset, for Western blot analysis of calbindin D-28Kd protein expression by these CaBP
doses). No expression of the calbindin D-28Kd protein was detected
in either the parental or neo-only transfectants (Fig. 6, upper panel,
right-hand inset). The Ca1 response of the differing types of AT-3
cells to treatment with 500 n@ TO demonstrated that only in high calbiadin D-28Kd protein-expressing clones (e.g., CaBP clone 15; Table, 3) is the elevation in Ca@induced by TO treatment buffered
(i.e., only a @2-foldnot a 3-4-fold increase).
To test the effects that such buffering of the TO-induced elevation in Caj has on programmed death of the AT-3 cells, these clones were separately exposed to 500 JIMTO for either 36 h (Fig. 6, upper panel) or 48 h (Fig. 6, lower panel), and then the clonogenic survival was
determined. These results demonstrated that, in both of the high
calbindin D-28Kd protein-expressing clones (i.e., CaBP clones 23 and 15), there is a greater than 50% inhibition in the loss of clonogenic ability indUced by 36 h of 500 nM TO treatment as compared to either the parental AT-3 cells, neo-only transfectants, or CaBP clone 9 cells expressing only low levels of calbindin D-28Kd protein (Fig. 6, upper
panel). This inhibition is not observed, however, if the chronic TO
Table 4 Effect of raising the extracellular Ca2@concentration in culture media on the
loss ofclonogenic ability induced by 36 h of exposure of 500 nat TG
AT-3 parental 55 ±8
AT-3neo 51±10
AT-3 CaBP clone 15 21 ±5a AT-3 CaBP clone 23 24±6―
a p < 0.05 difference when compared to parental cells in 0.4 mst (@2+ media. b ,@< o.os difference when compared to cell type in 0.4 msi Ca2@ media.
C p < 0.05 difference when compared to parental cells in 1.0 msi Ca2@ media. 6173
THAPSIGARGIN AND PROGRAMMED CELL DEATH
cyclically as a pump, it must form an aspartylphosphoenzyme inter mediate (the phosphate being derived from Al?) which must, in time, be dephosphorylated for the protein to recycle (41). Mechanistic studies have demonstrated that the basis for the action of TO is its ability to inhibit the production of the aspartylphosphoenzyme inter mediate required for the ER Ca2@ ATPase protein to function as a transport pump (42). TO does not interfere with the dephosphorylation step in the enzymatic cycling (41).
In the present study, treatment of both human and rat androgen independent prostatic cancer cells with TO results in sustained Ca. elevations. The mechanism for this sustained Ca3 elevation is likely to be as follows. TO inhibits the ER Ca2@-ATPase, which prevents resequestration of Ca1 as it leaks out of the ER. The resultant depletion of ER Ca2@ pools results in capacitative entrance of extracellular
Ca24 into the cell, which is sustained (14, 15). In addition, the
depletion of Ca2@ from the ER has significant effects on ER function, which includes changes in protein synthesis, assembly, and processing (16, 43). In the current study, within the first 12 h of TO exposure, there are a series of epigenetic (i.e., mRNA profile) events which are coupled with morphological changes in the cells (i.e., cell rounding and shrinkage). Concurrent with these changes is an enhanced syn thesis of specific protein (e.g., calmodulin), although total protein synthesis is greatly decreased (i.e., >50%). By 24 h of TO treatment, the prostatic cancer cells ceased progression through the cell cycle and arrested in O@,losing their clonogenic ability. At this time, the cells begin to undergo DNA fragmentation, initially into 300 then 50-kilobase-sized pieces. These larger DNA fragments subsequently are degraded further into smaller nucleosomal-sized (i.e., 1 kilobase) pieces before being eventually reduced to individual nucleotides. Between 24 and 48 h of TO treatment, the majority of cells undergo DNA fragmentation. Following O@,arrest and subsequent DNA frag mentation, the cells lose their plasma membrane viability, as assayed by trypan blue exclusion and flow cytometric assays, and undergo cellular fragmentation into apoptotic bodies, as documented by time lapse videomicroscopy.
Based upon the temporal sequence of events following initiation of TO treatment, initiation of DNA fragmentation is not an epiphenom enon occurring as a result of the cell losing its viability but is a causal event in committing the cell to complete programmed death. Inhibi tion of ER Ca2@-dependent ATPase appears to be the major pathway for the induction of programmed cell death by TO, since the IC5@sfor
both TO inhibition of the ER Ca2@-ATPase and EC51@s
for TO
induced loss of clonogenic ability and programmed death are @30fiM. No changes in pH1 occurred during TO treatment, documenting that intracellular acidification is not the mechanism for activation of the genomic DNA and cellular fragmentation. The inhibition of ER Ca2@-ATPase by TO results in both a depletion of the ER pool of seques trated Ca2@ and to a secondary rise in Ca.. In high calbindin trans fectants, both the rise in Ca1 and cytotoxicity induced by TO treatment are inhibited without prevention of the depletion of the ER pool of
Ca2@. These results demonstrate that it is the elevation in Ca1 to a
critical level which is the initiator of the programmed death of androgen-independent prostatic cancer cells. Thus, these studies have identified the ER Ca2tATPase pump as a new therapeutic target for activating programmed cell death of nonproliferating, androgen-inde pendent prostatic cancer cells.
ACKNOWLEDGMENTS
The excellent help of Barbara A. Lee in preparing this manuscript is gratefully acknowledged.
200
150 0 C[00
UFig. 7. Temporal changes in the rate of total protein synthesis and CAM protein content per AT-3 cells during exposure to 500 n@TO. Values are the mean (n = 3—5/point);bars,
SEM. For some of the points, the SEM is too small to be presented graphically. Values are expressed as a percentage of untreated control AT-3 cells (i.e., 100% = 34 ±2 @g
CAM protein/10@cells and 32,300 ±1,480 dpm of methionine incorporated into protein! h!106 cells).
decreases by 60% within 12 h of TG treatment (Fig. 7). These results clearly demonstrate that, during programmed death of AT-3 cells, general protein synthesis is decreased while the synthesis of specific proteins, like CAM, is enhanced.
DISCUSSION
Metastatic prostatic cancer is a fatal disease due to the fact that there is no effective systemic therapy for the control of androgen independent prostatic cancer cells (3). A major reason why androgen independent prostatic cancer cells are resistant to present therapies is their extremely low rate of proliferation. Less than 10% of such cells proliferate during a given day (35, 36). In contrast, high numbers of normal host cells proliferate daily (e.g., 10—20%per day for gut, skin, and blood cells). Thus, there is an extremely small therapeutic index for anti-proliferation drugs targeted at the limited number of prolif erating androgen-independent prostatic cancer cells.
Androgen-independent prostatic cancer cells can be induced to undergo proliferation-independent programmed cell death if their Ca1 can be elevated for a sustained period (12). As demonstrated in the present study, one method to sustain an elevated Ca1 in these cells is to selectively inhibit the ER Ca2@-dependent ATPase by treatment with TO. TO, a sesquiterpene y-lactone, is the active principle of the root of the umbelliferous plant, Thapsia garganica (37). Resin from this plant was used as early as 300 B.C. as a medicine for rheumatic pains by the Greeks and has also been used in traditional Arabic medicine for centuries (38). However, TO is also a skin irritant inducing mast cells to release histamine in an extracellular Ca2@-dependent manner similar to the action of calcium ionophores (38). The intracellular targets for TO are the Ca2@-dependent ATPases present in the ER. TO potently [IC50 of ‘@‘3OnM; (13)J and selectively inhibits the SERCA family of ATPases.
In contrast, PMCA are not inhibited by TO, even at micromolar concentrations (13). Based upon the stoichiometric and quantitative effects of TO on the ER Ca24-ATPase, the inhibition appears to be irreversible (39—40). In order for the ER Ca2@-ATPase to function
caimodtârVcel protein synthesis/cell
a
@
2 Ô 12 24 36 48
Time (h) of Exposure to 500 nM ThapsigarginTHAPSIGARGIN AND PROGRAMMED CELL DEATH
genes (GRP78, GRP94, and EPp72) retards cell growth and lowers viability after ionophore treatment. Mol. Cell. Biol., 11: 3436—3453, 1991.
22. lizumi, T., Yazaki, T., Kanoh, S., Kondo, I., and Koiso, K. Establishment of a new prostatic carcinoma cell line (TSU-Prl). J. Urol., 137: 1304—1306, 1987. 23. Stone, K. R., Mickey, D. D., Wunderli, H., Mickey, G. H., and Paulson, D. F.
Isolation of a human prostate carcinoma cell line (DU145). lnt. J. Cancer, 21:
274—281,1978.
24. Kaignh, M. E., Narayan, D. S., Ohnuki, Y., Lechner, J. F., and Jones, L. W. Establishment and characterization of a human prostatic carcinoma cell line (PC-3). Invest. Urol., 17: 16—23,1979.
25. Vindelov, L. L., Christensen, I. J., and Nissen, N. I. A detergent-trypsin method for
the preparation of nuclei for flow cytometric DNA analysis. Cytometry, 3: 323—327,
1983.
26. Schwarting, R., Gerdes, J., Niehus, J., Jaeschke, L., and Stein, H. Determination of the
growth fraction in cell suspensions by flow cytometry using the monoclonal antibody
10-67. J. Immunol. Methods, 90: 65—70,1986.
27. Maruyama, K., and MacLennan, D. H. Mutation ofaspartic acid-351, lysine-352, and lysine-515 alters the Ca2 transport activity of the Ca2@-ATPase expressed in COS-1 cells. Proc. Natl. Acad. Sci. USA, 85: 3314—3318, 1988.
28. Seidler,N.W.,Jona,I., Vegh,M.,andMartonosi,A. Cyclopiazonicacidis a specific inhibitor of the Ca2@-ATPase of sarcoplasmic reticulum. J. Biol. Chem., 264:
17816—17823,1989.
29. Stamato, T. D., and Denko, N. Asymmetric field inversion gel electrophoresis: a new method for detecting DNA double-strand breaks in mammalian cells. Radiat. Res., 121: 196—205,1990.
30. Grynkiewica, G., Poenie, M., and Tsien, R. Y. A new generation of Ca2@ indicators
with greatly improved fluorescence properties. J. Biol. Chem., 260: 3440—3450,
1985.
31. Davies, T. A., Dunn, J. M., and Simons, E. R. Evaluation of changes in cytoplasmic pH in thrombin-stimulated human platelets. Anal. Biochem., 167: 118—123,1987. 32. Dowd, D. R., MacDonald, P. N., Komm, B. S., Haussler, M. R., and Miesfeld, R. L.
Stable expression of the calbindin-D2SK complementary DNA interferes with the apoptotic pathway in lymphocytes. Mol. Endocrinol., 6: 1843—1848,1992. 33. Sherr, C. J. Mammalian G1 cyclin. Cell, 73: 1059—1065, 1993.
34. Means, A. R. Molecular mechanism of action of calmodulin. Recent Prog. Hormone Res., 44: 223—259,1988.
35. Meyers, J. S., Sufrmn, 0., and Maring, S. A. Proliferation activity of benign human prostate, prostatic adenocarcinoma and seminal vesicle evaluated by thymidine la
beling. J. Urol., 128: 1353—1356,1982.
36. Nemoto, R., Hattori, K., Uchida, K., Shimazui, T., Nishijima, Y., Koiso, IC, and Harada, M. S-phase fraction of human prostate adenocarcinoma studies with in vivo bromodeoxyuridinelabeling.Cancer(Phila.),66: 509-514, 1990.
37. Rasmussen, U., Christensen, S. B., and Sandberg, F. Thapsigargin and thapsigargicin, two new histamine liberators from Thapsia garganica. L Acta Pharm. Suec., 15: 133—140,1978.
38. Christensen, S. B., Norup, E., and Rasmussen, U. Chemistry and structure-activity relationship of the histamine secretagogue thapsigargin and related compounds. In: P. Krogsgaard-Larsen, S. Brogger Christensen, and H. Kofod (eds.), Natural Products
and Drug Development, pp. 405—418,Copenhagen, Denmark: Munksgaard, 1984.
39. Lytton, J., Westlin, M., and Hanley, M. R. Thapsigargin inhibits the sarcoplasmic or endoplasmic reticulum Ca-ATPase family of calcium pumps. J. Biol. Chem., 266: 17067—17071, 1991.
40. Ghosh, T. K., Bian, J., Short, A. D., Rybak, S. L., and Gill, D. L. Persistent intracellular calcium pool depletion by thapsigargin and its influence on cell growth.
J. Biol. Chem., 266: 24690—24697,1991.
41. Papp, B., Enyedi, A., Kovacs, T., Sarkadi, B., Wuytack, F., Thastrup, 0., Gardos, 0., Bredoux, R., Levy-Toledano, S., and Enouf, J. Demonstration of two forms of
calcium pumps by thapsigargin inhibition and radioimmunoblotting in platelet mem
brane vesicles. J. Biol. Chem., 266: 14593—14596,1991.
42. Seidler, N. W., Jona, I., Vegh, M., and Martonosi, A. Cyclopiazonic acid is a specific inhibitor of the Ca2@-ATPase of sarcoplasmic reticulum. J. Biol. Chem., 264:
17816—17823,1989.
43. Brostrom, C. 0., and Brostrom, M. A. Calcium-dependent regulation of protein
synthesis in intact mammalian cells. Annu. Rev. Physiol., 52: 577—590,1990.
6175
REFERENCES
1. Crawford, E. D., Eisenberger, M. A., McLeod, D. C., Spaulding, J., Benson, R., Dorr,
F. A., Blumenstein, B. A., Davis, M. A., and Goodman, P. J. A control randomized trial of Leuprolide with and without flutamide in prostatic cancer. N. EngI. J. Med.,
321:419—424,1989.
2. Isaacs, J. T., Schulze, H., and Coffey, D. S. Development of androgen resistance in prostatic cancer. In: 0. Murphy, S. Khoury, R. Kiess, C. Chatelair, and L. Denis
(eds.), Prostate Cancer, Part A: Research, Endocrine Treatment, and Histopathology, pp. 21—31.New York: Alan R. Liss, Inc., 1987.
3. Raghaven, D. Non-hormone chemotherapy for prostate cancer: principles of treatment
and application to the testing of new drugs. Semin. Oncol., 15: 371—389,1988. 4. Kypnanou, N., and Isaacs, J. T. Activation of programmed cell death in the rat ventral
prostate after castration. Endocrinology, 122: 552—562,1988.
5. Kyprianou, N., English, H. F., and lasses, J. T. Programmed cell death during
regression of PC-82 human prostate cancer following androgen ablation. Cancer Res.,
50: 3748—3753,1990.
6. Berges, R. S., Furuya, Y., Jacks, T., English, H., and Isaacs, J. T. Cell proliferation, DNA repair, and p53 function are not required for programmed death of prostatic glandular cells induced by androgen ablation. Proc. NatI. Acad. Sci. USA, 90:
8910—8914,1993.
7. lasses, J. T., Lundmo, P. I., Berges, R., Martikainen, P., Kyprianou, N., and English,
H. F. Androgen regulation of programmed death of normal and malignant prostatic cells. J. Androl., 13: 457—464, 1992.
8. Furuya, Y., and lsaacs, J. T. Differential gene regulation during programmed death
(apoptosis) versus proliferation of prostatic glandular cells induced by androgen manipulation. Endocrinology, 133: 2660-2666, 1993.
9. Kyprianou, N., English, H. F., and lsaacs, J. T. Activation ofa Ca2@-Mg@@-dependent
endonuclease as an early event in castration-induced prostatic cell death. Prostate, 13:
103—118,1988.
10. Martikainen, P., and Isaacs, J. T. Role of calcium in the programmed death of rat
prostatic glandular cells. Prostate, 17: 175—188,1990.
11. English, H. F., Kyprianou, N., and lsaacs, J. T. Relationship between DNA fragmen tation and apoptosis in the programmed cell death in the rat prostate following
castration. Prostate, 15: 233—251,1989.
12. Martikainen, P., Kyprianou, N., Tucker, R. W., and lasses, J. T. Programmed death
of nonproliferating androgen-independent prostatic cancer cells. Cancer Rca., 51:
4693—4700, 1991.
13. Thastrup, 0., Cullen, P. J., Dr4thak, B. K., Hanley, M. R., and Dawson, A. P.
Thapsigargin, a tumor promoter, discharges intracellular Ca2@stores by specific inhibition of the endoplasmic reticulum Ca2@-ATPase.Proc. NatI. Acad. Sci. USA,
87: 2466—2470, 1990.
14. Randriamampita. C., and Tsien, R. Y. Emptying of intracellular Ca2@stores releases a novel small messenger that stimulates Ca2@influx. Nature (Lond.), 364: 809—814,
1993.
15. Parekh, A. B., Terlau, H., and Stllhmer, W. Depletion of InsP3 stores activates a Ca2@
and K@ current by means of a phosphatase and a diffusible messenger. Nature (Land.), 364: 814—818,1993.
16. Short, A. D., Bian, J., Ghosh, T. K., Waldron, R. T., Rybak, S. L., and Gill, D. L. Intracellular Ca2@pool content is linked to control of cell growth. Proc. Natl. Acad.
Sci. USA, 90: 4986-4990, 1993.
17. Isaacs, J. T., and Lundmo, P. Chemotherapeutic induction of programmed cell death
in nonproliferating prostate cancer cells. Proc. Am. Assoc. Cancer Res., 33: 588—589,
1992.
18. Furuya, Y., and lsaacs, J. T. Proliferation dependent versus independent programmed
cell death of prostatic cancer cells involves distinct gene regulation. Prostate, 25: 301—309, 1994.
19. Barry, M. A., Reynolds, J. E., and Eastman, A. Etoposide-induced apoptosis in human
HL-60 cells is associated with intracellular acidification. Cancer Res., 53: 2349—
2357, 1993.
20. Drummond, I. A. S., Lee, A. S., Resendez, E., and Steinhard, R. A. Depletion of intracellularcalciumstores by calciumionophoreA23187inducesthe genes for
glucose-regulated proteins in hamster fibroblasts. J. Biol. Chem., 262: 12801—12805,
1987.