This is the author’s version of a work that was submitted/accepted for pub-lication in the following source:
Papadimitriou, Fivos &Kidman, Gillian (2012) Statistical and scientomet-ric analysis of international research in geographical and environmental education.International Research in Geographical and Environmental Ed-ucation,21(1), pp. 11-20.
This file was downloaded from: http://eprints.qut.edu.au/56067/
c
Copyright 2012 Routledge
Notice: Changes introduced as a result of publishing processes such as copy-editing and formatting may not be reflected in this document. For a definitive version of this work, please refer to the published source:
Statistical and Scientometric Analysis of International Research in Geographical and Environmental Education
Fivos Papadimitriou
(Environmental and Land Use Consultancies, Athens, Greece)
Gillian Kidman
(Queensland University of Technology, Brisbane, Australia)
Abstract
Certain statistic and scientometric features of articles published in the journal “International Research in Geographical and Environmental Education” are examined in this paper, for the period 1992-2009, by applying nonparametric statistics and Shannon’s entropy (diversity) formula. The main findings of this analysis are: a) after 2004 the research priorities of researchers in geographical and environmental education seem to have changed, b) “teacher education” has been the most recurrent theme throughout these 18 years, followed by “values & attitudes” and “inquiry & problem solving” c) the themes “GIS” and “Sustainability” were the most “stable” throughout the 18 years, meaning that they maintained their ranks as publication priorities more than other themes, d) citations of IRGEE increase annually, e) the average thematic diversity of articles published during the period 1992-2009 is 82.7% of the maximum thematic diversity (very high), meaning that the Journal has the capacity to attract a wide readership for the 10 themes it has successfully covered throughout the 18 years of its publication.
Key-words: Statistics; Scientometry; Geographical Education; Environmental Education; Shannon diversity; Nonparametric Statistics
Introduction
Scientometric analyses can reveal a lot about research trends. Ideally, such analyses should be performed on all journals covering a well-defined scientific field. In Geography however, the literature is rather poor in such estimations, with the exception of some studies which have attempted to make scientometric assessments at the national level.
As an example, from a bibliometric analysis of a Spanish geography journal, for the publication period from 1982 to 2007, it was found that there is a growing emphasis on
physical geography during that period (Guimera et al, 2007). Yet, there is a growing tendency in geography to examine bibliographically the couplings between physical and human
geography (Aspinall, 2010). The question of balancing environmental with geographical education was raised a few years ago for the US geography (Bednarz, 2006). Might this trend in coupling geographical+environmental education be exemplified in the increase in the number of papers relating to “sustainability” in IRGEE? Such a perspective seems possible, since sustainability has emerged as a key-issue in geographical education over the last years (Lidstone & Stoltman, 2007). Sustainability could be considered as a strong link between human geography and environmental science, but while enhancing sustainability (and education about it), we may as well be careful about either overemphasizing or
oversimplifying the links between geography and environmental science (Demeritt, 2009) or between geographical and environmental education.
In another bibliometric study, covering 39 selected journals of Geography with articles for the period 1997 to 2005, it was found that subjects of interest for researchers in geography had a remarkable variability – not a single journal had been the most important one for a period longer two years (Barriocanal, 2007), therefore indicating that key priorities in geographical research change very rapidly. Does the same apply to geographical education as happens in geographical research? What is the “stability” of research topics in
geographical education? And (even more complicated): Does the same apply to environmental education?
Aside of these questions relating to the particular themes of research papers published in a journal, there are also issues pertaining to the research priorities, as reflected by the numbers of publications per annum. Identifying changes in research priorities can be the aim of both the content and the statistical analyses of a journal. To analyze these changes,
different statistical and scientometric methods can be applied; the reader is referred to relevant publications (i.e. Nederhof, 2006).
Further, this paper tackles the problem of diversity for scientometry (Stirling, 2007; Zitt & Bassecoulard, 2008) with a novel application in the literature of geographical and environmental education. The problem consists in the definition of indices for measuring diversity in all its forms in scientometry, so the degree to which measuring thematic diversity can be useful in analyzing publications in geographical and environmental education.
Methods and data
In this paper, the developments and changes in geographical and environmental education are analyzed, as reflected in the journal IRGEE, after performing statistical and scientometric analyses on the basis of the content analysis of IRGEE for the period 1992-2009 performed by Gillian Kidman in 2011.
A key method here is ranking the publications per theme. The higher the number of publications per theme in each issue of IRGEE, the smaller the corresponding rank value. On this ranking, statistical analyses may be performed by using Spearman’s non-parametric coefficient of rank correlations, averaging the ranks, identifying correlations among research themes and estimating their “stability” over time. Also, it is important to evaluate the
diversity of themes and to assess the significance of publications as reflected by citations (the latter are assessed from the SCOPUS and University of Leiden databases, which are available online (http://www.journalindicators.com/SearchJournal.aspx).
Results
The number of publications per theme represents the priorities of researchers
submitting papers to IRGEE with time. These are identified by the following matrix of ranks per theme, per time period. A rank equal to 1 means highest priority so the higher the rank value the lowest the priority (table 1). From this table, we see that the first rank theme keeps changing with time.
INSERT TABLE 1 HERE
The ranks per paper theme (syllabus, sustainability etc) by pair of years, (beginning with 1992/3 and ending in 2008/9) were analyzed with Spearman’s ranks correlation coefficient rho (table 2).
INSERT TABLE 2 HERE
As expected, there was a high correlation (the closer to 1, the higher the correlation) between ranks of research fields from volume to volume of IRGEE until 2004/5. Then, the correlation begun to diminish (although slightly), meaning that after 2004 the research
priorities of researchers in geographical and environmental education seem to have changed.
This might be attributed to the rise of the themes of sustainability and GIS during the last years of publication of IRGEE.
Computing the average rank of research priority per theme of papers published in IRGEE, we get the results shown in table 3.
The higher the average rank of a subject, the lowest its average priority during the 18 years interval considered here. From this table, we see that “teacher education” has been the most recurrent theme throughout these 18 years, followed by “values” and “inquiry”
Correlations of themes through time
Certain themes appear different, but they may be correlated. For instance, “Values” and “Syllabus” are expected to be correlated through time, because it is the syllabi which are mostly used to form students’ values, attitudes and choices. Indeed, the correlation is very high (Spearman’s rho=0.79), as shown visually from the diagram (figure 1). This might be
interpreted as an indication that syllabi , curricula and textbooks are the main vehicles for forming students’ values and attitudes in geographical and environmental education, or that when authors publish papers related to syllabi and textbooks, they also cover “values” and “attitudes”.
INSERT FIGURE 1 HERE
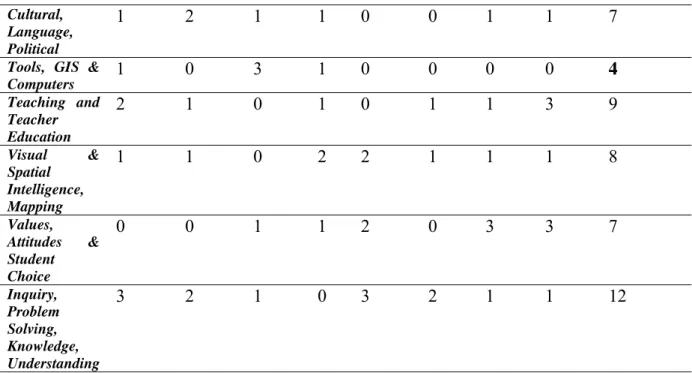
Transition matrix for changes of ranks: stability of themes through time
When a theme changes rank from year to year, it may downgrade or upgrade its rank in the next couple of years. If a theme cedes its rank to another theme, then it is an indication of “instability” of that theme through time. We can therefore construct a matrix of transitions of themes for the 18 years of IRGEE examined here. Eventually, the sum of column values
per row of the transition matrix with i rows, j columns and elements
a
ij, is given by the sum
8 1 j jfor all columns j of each row (*) and symbolized here as b (the total number of
8 1 * j j ja
b
where i=rows, j=columnsThus, the higher the value of b, the higher the degree of “instability” of each theme
through time.
The more probable that the theme’s rank will be replaced by another theme in the next time period, the higher the b. From this matrix, we see that the themes “GIS” and
“Sustainability” were the most “stable” throughout the 18 years, meaning that they maintained their ranks as publication priorities more than other themes (table 4).
INSERT TABLE 4 HERE
Diversity of themesGenerally, the higher the diversity of themes in a volume (or year) the better it is for a journal. Otherwise, if one (or a few) themes dominated a Journal it might have a very narrow readership.
The diversity of themes can be measured for each pair of years of IRGEE publications, by using the well known Shannon’s formula of information uncertainty:
n i i iP
P
H
1ln
whereH= information uncertainty (or entropy, or diversity), i=themes (from 1 to 10 in this case),
n=the total number of themes=10,
Pi=the relative fraction of participation of each theme i in the total number of articles
Thus, by applying Shannon’s formula, we get the results shown in table 5:
INSERT TABLE 5 HERE
Since we have n=10 themes considered for each pair of years, the maximum possible
diversity per pair of years is:
302
.
2
)
10
ln(
)
ln(
max
n
H
We therefore see that the average diversity for all the 18 years considered is:
t
P
P
H
n i i i t average
1 1ln
where t=the number of pairs of years considered (here t=9 pairs of years) and hence:
904
.
1
averageH
We therefore realize that the average diversity of themes differs little from the maximum possible diversity of themes over the entire time period considered. In fact, it differs by:
average averageH
H
H
max17.3%
Hence, the average thematic diversity of articles published in IRGEE during the period 1992-2009 is 82.7% of the maximum thematic diversity (very high). Thus, the Journal
has the capacity to attract a wide readership for the ten themes it has successfully covered throughout the 18 years of its publication.
Citations of IRGEE increase annually (figure 2), emitting a signal for optimism for the future as can be seen in the figure below (data from SCOPUS database, last updated 17/3/2011).
INSERT FIGURE 2 HERE
The index SNIP is used to measure citations per journal with respect to other journals in the same scientific fields (Moed, 2009). It is the ratio of a journal’s “raw impact per paper” (RIP) with respect to the relative database citation potential in the subject field covered by the journal. IRGEE is classified as relevant to three fields: “Geography, Planning and Development”, “Education” and “Management, Monitoring, Policy and Law”. We know that journals covering fields in which RIP equals one, SNIP equals RIP. For biological and chemical journals, SNIP values tend to be lower than their RIP scores, and for mathematical journals higher. Over the ten last years for which data are available, we see that SNIP varies from year to year significantly (table 6).
INSERT TABKLE 6 HERE Discussion
In exploring the changes in research priorities in geographical and environmental education in this study, new methods for scientometric analysis of papers in geographical and environmental education were proposed: Spearman’s rank coefficients, transition matrices and Shannon’s formula. These methods can be applied to other scientometric analyses also and meet the needs of scientometry for further metrics given that “A research metric should have qualities such as simplicity,transparency, objectivity, replicability, precision and
sensitivity; it should also allow both longitudinal and international comparisons” (Charlton & Andras, 2007).
As concerns citation reports, it has been documented that Thomson ISI Web of Knowledge is “not advantageous” for journals in the humanities (Baneyx, 2008), because a great number of articles published in the humanities are not covered by this database.
Unfortunately, geography could not escape this, because a considerable portion of
geographical literature can be classified as “humanities”. Often however, it might be more modest to assume that (Zitt & Bassecoulard, 2008) “citations measure visibility rather than quality”.
Considering the findings of the analysis of IRGEE now, the rise of GIS as a research priority in geography has already been identified, as well as the rise of sustainability
(Lidstone & Stoltman, 2007a). Perhaps their “stability” (as documented here) is too early to be “established”, but the overwhelming use of ICTs in Geography might strengthen further the trend of using GIS (Gilbert & Masucci, 2005) and Geospatial technologies in
geographical education (Konecny & Stanek, 2010; Papadimitriou, 2010a; Papadimitriou, 2010b).
Correlations between themes is something that might cause concern for geography educators: it can be taken to mean either that when authors publish papers related to syllabi and textbooks, they cover also “values” and “attitudes” (as hypothesized here) or that they simply repeat studying the same subject under different terminology (and hence, themes are possibly overlapping).
Whatever the case may be, enhancing the diversity of themes covered (while at the same time maintaining a Journal’s strictly defined perspective) can be a challenge to editors of any academic journal. And this challenge may even extend to linking diversity with innovation and creativity (as discussed by Lidstone & Stoltman, 2007b) or even with aspects of research in geographical/environmental education (as discussed by Papadimitriou, 2001). Clearly, avoiding dominating subjects is important (i.e. not all subjects can deal with GIS from now on, just because GIS education is a powerful trend).
As we need to preserve precious biodiversity in nature, so an academic journal should preserve scientific and thematic diversity (always within its well-defined disciplines).
Conclusions
After examining the articles published in the Journal “International Research in Geographical and Environmental Education” for a period of 18 years (1992-2009) until 2009, we reach the following conclusions: a) it seems that the research priorities of researchers in geographical and environmental education have changed after 2004, with the increase in the number of articles related to the themes “GIS” and “Sustainability”; themes which have also maintained their ranks as publication priorities more than other themes, b) “teacher
education” has been the theme with the highest rank (reflected in the number of papers published), followed by “values & attitudes” and “inquiry & problem solving” c) Citations of IRGEE increase rapidly, in a nonlinear manner, although the SNIP index fluctuated over the last decade, d) the average thematic diversity of articles as calculated with Shannon’s formula, is high (82.7% of the maximum possible thematic diversity), therefore proving that IRGEE is a focused, as well as thematically-diverse academic journal.
References
Aspinall, R. (2010). A century of Physical Geography in the Annals. Annals of the Association of American Geographers, 100 (5), 1049-1059
Baneyx, A. (2008). "Publish or Perish" as citation metrics used to analyze scientific output in the humanities: International case studies in economics, geography, social sciences, philosophy, and history. Archivum Immunologiaw et Therapiae Experimentalis, 56
(6), 363-371.
Barriocanal, C., Crous, A., Varga, D., Vila, J. (2007). Analysis of geography journals indexed at the Journal of Citation Reports of the Social Sciences Citation Index: 1997-2005 period | [Anàlisi de les revistes de geografia indexades al Journal of Citation Reports
del Social Science Citation Index. Període 1997-2005]. Documents d'Analisi Geografica (50), 51-72.
Bednarz, R.S. (2006). Environmental research and education in US geography. Journal of Geography in Higher Education 30 (2), 237-250.
Charlton, B.G. & Andras, P. (2007). Evaluating Universities using simple Scientometric Research-output metrics: total citation counts per university for a retrospective seven-year rolling sample”. Science and Public Policy, 34(8), 555-563.
Demeritt, D. (2009). Geography and the promise of Integrative Environmental Research.
Geoforum, 40,127-129.
Dorn, R.I. (2002). Analysis of geomorphology citations in the last quarter of the 20th century.
Earth Surface Processes and Landforms27 (6), 667-672 .
Gilbert, M. & Masucci. M. (2005). Research Directions for Information and Communication Technology and Society in Geography, Geoforum, 36, 277-279.
Guimerà, A.D., Gonzàlez, X.O., & Margalef, M.V. (2007). Twenty-five years spreading geographical research: Bibliometric analysis of Documents d'Anàlisi Geogràfica [Vint-i-cinc anys de difusió de la recerca geogràfica: Anàlisi bibliométrica de la revista Documents d'Anàlisi Geogràfica]. Documents d'Analisi Geografica (50),
29-50.
Kidman, G. & Palmer, G. (2006). GIS: The Technology is there but the teaching is yet to catch up. International Research in Geographical and Environmental Education, 15(3), 289-296.
Konečný, M. & Staněk, K. (2010). Adaptive Cartography and Geographical Education.
Lidstone, J. & Stoltman, J. (2007a). Sustainable Environments or Sustainable Cultures. Research Priorities. International Research in Geographical and Environmental Education, 16(1),1-4.
Lidstone, J. & Stoltman, J. (2007b). The contribution of geographical and environmental education to enhancing creativity and innovation: Assertion without foundation or demonstrable capacity? Geography Education for Sustainable Development in Southeast Asia. International Research in Geographical and Environmental Education, 16(4), 313-315.
Moed, H. (2009). Measuring contextual citation impact of scientific journals. November, 23 pages, arXiv:0911.2632v1
Nederhof, A.J. (2006). Bibliometric monitoring of research performance in the social sciences and the humanities: a review. Scientometrics 66, 81–100.
Papadimitriou, F. (2010a). A “Neogeographical Education”? The Geospatial Web, GIS and Digital Art in Adult Education. International Research in Geographical and
Environmental Education, 19(1), 71-74.
Papadimitriou, F. (2010b). Introduction to the Complex Geospatial Web in Geographical Education. International Research in Geographical and Environmental Education,
19(1), 53-56.
Stirling A. (2007). A general framework for analysing diversity in science, technology and society. Journal of the Royal Society Interface, 4, 707–719.
Zitt, M. & Basselcoulard, E. (2008). Challenges for Scientometric Indicators: Data demining, Knowledge-flow measurements and Diversity issues” Ethics in Science and Environmental Politics, 8, 1-12.
Table 1. Ranks of numbers of papers published in IRGEE, with time, from 1992 until 2009 (Classification of themes: Gillian Kidman, Calculation: Fivos Papadimitriou)
Years 1992/3 1994/5 1996/7 1998/9 2000/1 2002/3 2004/5 2006/7 2008/9 Themes Syllabus& Textbooks, Curriculum 2 5 2 4 2 1 3 2 4 Sustainability & Pollution 4 6 4 4 6 3 3 6 2 Culture, Language, Political 4 4 5 3 5 3 4 8 5
GIS, Tools &
Computers 5 6 6 5 7 4 6 5 4
Teacher &
Teacher Education 2 1 2 3 1 3 5 1 3
Visual & Spatial Intelligence,
Mapping 3 2 5 1 6 3 5 7 7
Values, Attitudes
& Student choice 3 3 3 3 4 2 1 4 1
Inquiry, Problem-Solving Knowledge,
understanding 1 3 1 2 3 3 2 3 6
Table 2. Spearman’s rho coeficient of rank correlation among pairs of years of papers
Pairs of Years 1992/3 and 1994/5 1994/5 and 1996/7 1996/7 and 1998/9 1998/9 and 2000/1 2000/1 and 2002/3 2002/3 and 2004/5 2004/5 and 2006/7 2006/7 and 2008/9 Spearman’s Rank correlation coefficient 0.76 0.67 0.68 0.44 0.52 0.77 0.32 0.38
Table 3. Average rank of themes of papers published in IRGEE from 1992 to 2009. (Classification of themes: Gillian Kidman, Calculation: Fivos Papadimitriou)
Teaching & Teacher education Values, Attitudes & Student Choice and Inquiry, Problem Solving Themes Syllabus & Text- Books, Curriculum, Assessment Sustain- Ability & Pollution Visual & Spatial intelligence Mapping Culture, Language, Political GIS, Tools and Computers Average rank for all years (1992-2009) 2.3 2.6 2.8 4.2 4.3 4.6 5.3
Table 4. Transition matrix of ranks of themes for all years (1992-2000) and b-index. The
lower the b, the more “stable” the theme (or, otherwise stated, the more difficult to cease its
rank to another theme in the next biennial period). (Classification of themes: Gillian Kidman, Calculation: Fivos Papadimitriou)
Syllabus Sustain- ability
Culture GIS Teacher Visual Values Inquiry
Sum of row:
8 1 * j j j a b Syllabus & Textbooks, Curriculum, Asseeement 0 0 1 0 0 2 3 1 7 Sustainability & Pollution 2 2 1 1 0 0 1 1 6Cultural, Language, Political
1 2 1 1 0 0 1 1 7
Tools, GIS &
Computers 1 0 3 1 0 0 0 0 4 Teaching and Teacher Education 2 1 0 1 0 1 1 3 9 Visual & Spatial Intelligence, Mapping 1 1 0 2 2 1 1 1 8 Values, Attitudes & Student Choice 0 0 1 1 2 0 3 3 7 Inquiry, Problem Solving, Knowledge, Understanding 3 2 1 0 3 2 1 1 12
Table 5. Diversity of themes of articles published by IRGEE, from 1992 to 2009, for each pair of years. Calculations: Fivos Papadimitriou
1992/3 1994/5 1996/7 1998/9 2000/1 2002/3 2004/5 2006/7 2008/9 Diversity
of
themes
1.94
1.45
1.75
2.09
2.07
1.98
1.89
1.89
2.08
Table 6. SNIP values per annum for IRGEE. Data from SCOPUS and University of Leiden database (http://www.journalindicators.com/SearchJournal.aspx).
1999 2000 2001 2002
Years
2003 2004 2005 2006 2007 2008 2009
Figure 1. The rank of the theme “Syllabus and Textbooks” appears correlated with the theme “Values and attitudes”. (Calculation:Fivos Papadimitriou)