PEER INFLUENCE ON OBESITY-RELATED HEALTH RISK BEHAVIORS AND BODY MASS INDEX—
A NATURAL EXPERIMENT OF RANDOMLY-ASSIGNED COLLEGE ROOMMATES
Daowen Chen
A thesis submitted to the faculty at the University of North Carolina at Chapel Hill in partial fulfillment of the requirements of the degree of Master of Arts in the Department of Sociology.
Chapel Hill 2015
Approved by: Guang Guo
iii ABSTRACT
Daowen Chen: Peer Influence on Obesity-Related Health Risk Behaviors and Body Mass Index--A Natural Experiment of Randomly-Assigned College Roommates
(Under the direction of Guang Guo)
Finding the association between social network and obesity has oftentimes been impeded by the homophily problem. However, by using a large randomly-assigned college roommate dataset this study attempts to rule out the peer/self-selection and examine peer influence on college students’ Body Mass Index and obesity-related health risk behaviors including sugary beverage intake and physical exercise. In addition, this study investigates gender difference in peer influence and the association between peer effect and self’s predisposition. The results suggest that while females are more influenced by their peer’s sugary beverage drinking, males are more likely to be influenced by their peer’s physical exercise participation. Also, the study finds that peer effect on obesity-related health behaviors is larger for those who had the
predisposition prior to college than those who did not. This study provides a better understanding of the association of social network and obesity and offers further guidance for policy
iv
TABLE OF CONTENTS
LIST OF TABLES……….. v
LIST OF FIGURES………... vi
CHAPTER 1: INTRODUCTION………1
CHAPTER 2: BACKGROUND………..4
College Students’ Weight Gain and Obesity………...4
Peer Influence on Obesity………5
Obesity-Related Health Risk Behaviors………..6
Peer Influence on Obesity-Related Health Risk Behaviors……….7
Theories of Peer Influence………...8
Challenges in Estimating Peer Influence……….9
Gender difference in peer influence………...11
Hypotheses……….12
CHAPTER 3: DATA AND METHODS………...13
Sample………....13
Measures………14
Statistical Analysis……….16
CHAPTER 4: RESULTS………...19
CHAPTER 5: DISCUSSION AND CONCLUSION………....22
v
LIST OF TABLES
Table 1 - Descriptive Statistics of the Sample………...24 Table 2 - The Estimation of Main or Average Peer Influence(p-value) with
Gender Distinction………..27 Table 3 - Full Models of the Main Effects of Peer Influence on College
Obesity-Related Health Risk Behaviors and BMI without Gender
Distinction………...28
Table 4 - Peer Influence of College Obesity-Related Health Risk Behaviors/BMI Depends on Self’s Pre-College Obesity-Related Health Risk Behaviors/BMI
with Gender Distinction………..29
Table 5 - Full Models of Peer Influence by Self’s Pre-College Obesity-Related Health Risk Behaviors/BMI Interaction on College Obesity-Related
vi
LIST OF FIGURES
Figure 1: Effect of a Female Student’s Pre-College Sugary Drink Intake Amount on Her Own College Sugary Drink Intake Amount Given Her Roommate’s
High-Level Pre-College Sugary Drink Intake………32 Figure 2: Effect of a Male Student’s Pre-College Physical Exercise Amount on
His College Physical Exercise Amount Given His Roommate’s High-
1
CHAPTER 1: INTRODUCTION
A wealth of research has found that obesity is associated with multiple major health issues ranging from type-2 diabetes, cardiovascular disease to mental disturbance, and even stigmatization that affects life quality (Dixon 2010; Kenchaiah et al.; Mehta and Chang 2009; Mokdad et al. 2001; Mokdad et al. 2003; Sturm 2002; Tchernof et al.; Zimmet et al., 2001). However, despite the abundant and consistent finding that obesity is detrimental to health and much media coverage of fighting against obesity (Heuer et al. 2011; Lariscy et al. 2010), many studies point out that obesity levels have been on the rise nationwide with recent studies finding that “more than one-third of adults and 17% of youth in the United States are obese” (Ogden et al. 2014). Particularly, of all the age groups, even in a college setting, young adults (18-29 years old) have experienced the highest percent of increase of obesity over the recent years (Mokdad et al., 2001; Yakusheva et al. 2011). American College Health Association’s national ACHA-NCHA II survey (2011) reports that 34.1% of college students are overweight and 12.5% of the total surveyed are obese.
2
likeminded, or “homophily” (Fowler et al. 2011; Guo et al. 2015; Kandel 1978; Mouw 2006), the boundary between causal effect of peer influence and peer selection may be unclear.
Empirical studies examining the relationship between obesity and social network offer mixed results. Christakis and Fowler (2007) argue that obesity or weight gain is “spreadable” within a social network. By using the information of body weight between ego and their friends, family members, and neighbors, they found that the chances of obesity increase if those with close social distance from ego became obese. However, people with social contacts with ego were not randomly chosen; therefore, as Cohen-Cole and Fletcher (2008) and Lyons (2011) later point out that Christakis and Fowler’s study failed to control peer/self-selection (homophily), thus the “induction” of weight gain within social connections is not convincing.
3
4
CHAPTER 2: BACKGROUND
College Students’ Weight Gain and Obesity
Studies show that “BMI increases progressively from adolescence to young adulthood (Ortega-Alonso et al. 2012),” and it reaches its peak during college age or early adulthood (18-22) (Guo at al. 2000). A survey of National College Health Assessment II (2011) reports that over 30% of college students are overweight and of those roughly 40% are obese.
5 Peer Influence on Obesity
Recently, researchers have shifted their attention from biological explanations and routine habits as the causes of obesity to social network. Nicholas A. Christakis and James H. Fowler (2007) finds that obesity can “spread” via social networks. In other words, if two people share social ties then one person’s weight gain can influence another’s. More specifically, their results show that having a friend who is obese can increase the likelihood ego becomes obese by 57%. “Among pairs of adult siblings, if one sibling became obese, the chance that the other would become obese increased by 40%. If one spouse became obese, the likelihood that the other spouse would become obese increased by 37%” (p. 370). Simply put, the results of the study show that obesity is “contagious” between people who are close to one another, which can lead to less costly medical interventions.
6 Obesity-Related Health Risk Behaviors
Although many possible causes of obesity have been identified, sugary beverage intake and lack of physical exercise have been found to consistently associate with obesity (Bruijn et al. 2006; Jung et al. 2008; Levitsky et al. 2004; Megel 1994; Mokdad et al. 2001; Morrow et al. 2006). Malik and Hu (2011) examined numerous studies on the association between sugary beverages and obesity and reported that most of the previous studies showed a positive relation of sugary beverage with obesity especially in large samples and longitudinal studies. More recently, Qi et al. (2012) conducted an analysis integrating genetic and social environment study and found that genetic influence on BMI is more evident in people with higher sugary beverage intake than those with lower intake. Ebbeling et al. (2012) randomly selected hundreds of people categorized as obese and divided them into an experimental group and a control group. The former group received noncaloric beverages while the latter group did not. Through this experiment, they found that the BMI of those who were in the experimental group decreased dramatically compared to those in the control group. Popkin et al. (2015) examined the amount of calories in sweetened beverages and found the direct relation between sugary beverage intake and body weight.
7
treatment reports have shown that there is a clear negative relationship between physical exercise and obesity. For instance, Ergen et al. (2013) conducted an experiment in which patients were assigned to two groups with one group attending the Exercise Physiology Clinic two to three times a month and the other group attending the clinic more than four times a month during their experimental period. The results concluded that the group of patients who exercised more
frequently had experienced greater weight loss.
Peer Influence on Obesity-Related Health Risk Behaviors
Since certain behaviors have been found to be closely related to obesity, it is important to study whether there is a peer influence on the obesity-related health risk behaviors such as a peer influence on sugary beverage intake or physical exercise within a social network. More
importantly, both obesity-related health risk behaviors--sugary beverage intake and physical exercise participation--are very easy to be observed, imitated, and “learned” in a peer network. However, the research of peer influence on sugary beverage intake and physical exercise remains inadequate (Springer et al. 2006; Story et al. 2002).
Wouters et al. (2010) conducted a cross-sectional study to examine peer influence on adolescents’ snacking behavior including sugary soft drink intake at school, and found that majority of the soft drinks were purchased by adolescents whose friends were soft drink
8
Therefore, other than exploring peer influence on obesity in a college setting, this paper also examines peer influence on obesity-related health risk behaviors.
Theories of Peer Influence
Peer influence is defined as “the extent to which peers exert influence on an individual’s attitudes, thoughts and behaviors” (Bristol and Mangleburg 2005), and it has been found that peer influence is both powerful and subtle (Coleman 1980; Sutherland 1947). Peer influence is powerful because people who socialize within the same network are generally susceptible to their peers’ influence (Duffy et al. 2006) and can thereafter develop shared or similar social behavior and attitudes (Wellman 1983). For instance, it has been found that delinquency and substance use have a strong link to peer pressure (Haynie 2013). In the meantime, peer influence is also subtle because it often happens through unconscious social learning.
9
each other’s habits and social behavior in their daily lives. Bandura argues that “In the social learning system, new patterns of behavior can be acquired through direct experience or by observing the behavior of others” (1971: 3).
Recently, some behavioral science research points out that unconscious social influence plays a significant role in people’s decision making and other social behavior (Newell and Shanks 2014). The unconscious social learning indicates that individuals are socially pressured by others or model other people without awareness. This study contends that unconscious social learning can especially take place on individuals’ routine and habitual duties or needs such as sugary beverage intake and physical exercise engagement. For college students, these behaviors can be observed in a dormitory. Because a shared living space can limit the source of peer influence, routine behavior such as diet and exercise are put on display and allow individuals to unconsciously learn from each other.
Challenges in Estimating Peer Influence
As what I have stated above, peer influence is a subtle process, and therefore, it is often hard to be discerned or estimated. Firstly, it is not quite clear whether an individual’s current behavior is due to the influence of his/her own past behavior or his/her peer’s current/past influence (Stacy et al. 1992; Robinson et al. 1996). A lot of times, when researchers are
10
In addition, another difficult issue of estimating peer influence is that it is hard to separate peer influence from “self-selection” or “peer selection” (Bauman and Ennett 1996). People can naturally bond with others who are like-minded, and vice versa, their peers can connect with them if their peers find they share common points (Mcpherson et al. 2001). Although there have been many studies on peer influence, respondents/peers in most of the studies were not randomly chosen (Wouters et al. 2010), which implies the peer pairs consisted of self and his/her peer were possibly “selected” by the respondents, and the peer/self-selection problem could have existed in those studies (Lakon et al. 2012; Stone et al. 1979). For instance, Trogdon et al. (2008) used nominated friends among adolescents to examine peer influence on obesity. This study design might have contained peer/self-selection because it is possible that adolescents tend to make friends with people in the same weight category.
Furthermore, the estimation of peer influence often assumes that the peer influence from an individual to his/her peer and the reciprocal peer influence are on the same level regardless of their different personal characteristics. (Payne and Cornwell, 2007)
Due to the aforementioned challenges in the estimation of peer influence, Mouw (2006) argues that “randomly assigned roommates are, arguably, the cleanest estimates we will get of social capital effects because they avoid the question of friendship choice that complicates the rest of the literature” (p. 97).
11
am more neat than messy” (p. 685). After grouping students into different categories according to their answers to the above questions, the Office of Residential Life (ORL) shuffled their housing application slips to randomly assign everyone roommates. In other words, the data were obtained after grouping students non-randomly.
Gender difference in peer influence
A number of empirical studies indicate that there might be a gender difference in peer influence, although the results are not consistent and the reasons why there might be a gender difference in peer influence on social behaviors are not identified. For instance, Steinberg and Silverberg’s study (1986) on peer resistance from 865 teenagers with a wide range of
socioeconomic backgrounds shows that “adolescent girls are more autonomous than boys …are more resistant to peer pressure (p. 848).” Similarly, Wouters (2010) find that boys are more vulnerable than girls to be affected by the peers in terms of diet behavior. However, different from their findings on gender difference in peer pressure, Brown (1982) asked respondents (both males and females) to identify the extent of peer pressure on different activities. The finding from the study suggests that in general females are more susceptible than males to peer pressure, but the degree of peer pressure differs in different areas. Eisenberg et al. (2014) theorizes that cultural norm changes such as people’s attitudes towards binge drinking can shift female’s reactions to peer influence.
Other than the empirical studies on gender difference in peer influence, some ethnographic research also shows that males and females can experience peer influence
12
suggest that there is a gender difference in receiving peer pressure. Therefore, this study also tests whether there is a gender difference in peer influence on sugary beverage intake and
physical exercise participation in college and to what extent peer influence has an impact on each gender.
Hypotheses
Based on the previous discussion in the literature review especially on the major
challenges in the estimation of peer influence, this paper tests three hypotheses by using the data from a natural experiment with randomized college roommates (ROOM dataset):
Hypothesis 1: Peers’ pre-college obesity-related health risk behaviors/BMI have an impact
on self’s sugary beverage intake or physical exercise behavior or obesity status in college.
Hypothesis 2: The magnitude of peer influence on obesity-related health risk behaviors/BMI
in college hinges upon self’s predisposition.
Hypothesis 3: There is a gender difference in peer influence on college students’
13
CHAPTER 3: DATA AND METHODS
Sample
This study uses a large randomly-assigned college roommate dataset (ROOM); the data were collected in the spring of 2008 in a large public university, comprised of over 2000 college students ranging from freshmen to seniors in the dataset. Before they resided on campus, they had been asked by the University Housing Department whether they had any special roommate requests (e.g. smoking status or a themed housing such as foreign language housing etc.). The Housing Department then put those students who did not have any special requests into a large database and gave each student a unique RMS-ID number. The RMS software program was used for random roommate matching based on the students’ gender. Therefore, almost every student in the dataset had a randomly-assigned roommate when they were freshmen (for more details of this dataset, please see Guo et al. 2015). Although there were students who changed their initial roommates throughout their college life, this study only focuses on the initial randomly-assigned roommates because this group was removed from “peer/self-selection” (Duncan et al. 2005).
14
college BMI is 11. Therefore, this observation and subsequently his roommate were deleted from the sample, leaving the remaining 2120 observations to comprise the final sample. Although the students’ names are anonymous, according to the room ids they provided, they were paired into 1061 dorm rooms. Therefore, all of the individuals in the sample are “self”s and “roommate”s at the same time.
There are several advantages of using this dataset: Firstly, the randomly-assigned roommate method eliminates the concern of peer/self-selection which is one of the biggest challenges in estimating peer influence. Secondly, having both pre-college and college social behavior values in the same dataset allows for a more straightforward approach to find the “influencer” and to test how much impact peer influence depends on self’s predisposition. In addition, having a large sample size with both male and female students in it allows for a test of gender difference in peer effect on obesity and obesity-related health risk behaviors.
Measures
15
intake in Fall 2007. The third outcome variable measures self’s college Body Mass Index, also known as BMI (a recognized indicator of obesity by the Centers of Disease Control and
Prevention) in response to the questions of weight and height by using the formula “weight (kg) / [height (m)]2” (Centers of Disease Control and Prevention 2015 a).
Similarly, the pre-college measures of the two obesity-related health risk behaviors (sugary beverage intake and physical exercise participation) for both self and roommate are in response to the questions “How often did you drink regular, carbonated soda, soft drinks or juice that contained sugar 12 months prior to college.” “How often did you exercise or participate in physical activity for at least 20 minutes that made you sweat and breathe hard 12 months prior to college.” The coding is the same as the outcome variable measures. The measurement of pre-college of obesity uses a respondent’s pre-pre-college height and weight with the same formula as the outcome variable self’s college BMI.
By using the information from the above three measures, I also divided the students’ obesity status and two obesity-related risk behaviors prior to college into two categories for each outcome variable. According to the Centers of Disease Control and Prevention (2015 b), adults whose BMI is equal to or above 25 are considered overweight. Therefore, for obesity status, BMI equal to or larger than 25 is coded as 1 and otherwise as 0. For the two obesity-related health risk behaviors—sugary beverage drinking and physical exercise, if frequency is more than or equal to once a week, it is coded as 1 and otherwise as 0.
16
dichotomous variable (0=male and 1=female). Household income is a continuous variable ranging from 1-9 to represent the following categories: <$25,000, $25000-49,999, $50,000-74,999, $75,000-99,999, $100,000-149,999, $150,000-199,999, $200,000-249,999, $250,000-499,999, and $500,000 or more. Both mother’s education and father’s education are coded as continuous variables ranging from 0-6 to represent middle school or less, some high school, high school graduate, some college, college degree, postsecondary school other than college, and graduate or professional coursework or degree respectively. Students’ college GPA is a continuous variable as well. Please see the summary statistics in Table 1.
Statistical Analysis
In this study, I first conduct a set of random-effect regression analyses to estimate the average/main peer effect of a randomly-assigned roommate’s pre-college obesity-related health risk behaviors (sugary drink intake and physical exercise) and pre-college BMI on the
corresponding self’s behaviors/BMI in college by using the STATA Statistical Software. For each outcome variable, the main effect of peer influence is estimated separately for male and female college students. Equation (1) describes the main peer effects models:
17
household income etc. The main peer effects of a college student’ obesity-related health risk behaviors/BMI with gender difference are presented in Table 2 and the full model in Table 3.
In addition, this study examines how much peer influence of a college student’s obesity-related health risk behaviors/BMI depends on his/her predisposition as measured by his/her behaviors/BMI prior to college. Therefore, an interaction product between self’s pre-college obesity-related health risk behaviors/BMI and roommate’s pre-college obesity-related health risk behaviors/BMI is added into the first set of models. More specifically, in this set of models, regarding the outcome variable “college sugary beverage intake,” the interaction term is between a dichotomous level of roommate’s pre-college sugary drink intake and a dichotomous level of self’s pre-college sugary drink intake. In terms of the outcome variable “college physical exercise participation,” the interaction term is between a dichotomous level of roommate’s pre-college physical exercise frequency and a continuous measure of self’s pre-pre-college physical exercise frequency. In terms of the outcome variable “college BMI,” the interaction term is between a dichotomous measure of a roommate pre-college BMI and a dichotomous measure of self pre-college BMI. Also, male and female college students are estimated separately. Equation (2) describes the models with the interaction terms:
18
variables such as gender and racial ethnicity as well as social economic status variables such as college GPA, and respondents’ parents’ education, and household income etc. The coefficients of the interaction terms are presented in Table 4 and the full model in Table 5.
19
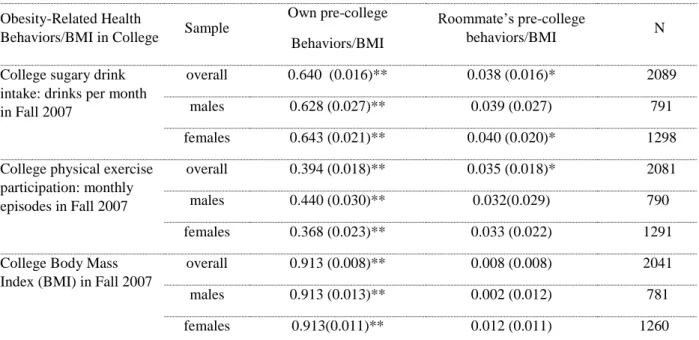
CHAPTER 4: RESULTS
Table 2 shows the estimations of the average peer effect on self’s obesity-related health risk behaviors/BMI in college. Each row in the table represents a regression model which is regressed on self and his/her college roommate’s pre-college obesity-related health risk behaviors/BMI, self’s social economic status, demographic characteristics and school
performance in college. The peer influence on both genders was examined separately as well. The results show that self’s college obesity-related health risk behaviors/BMI are all closely associated with his/her corresponding high-school behaviors/BMI. More importantly, a significant and positive roommate effect is found in both college sugary beverage intake and college physical exercise participation. When holding self’s personal and family characteristics constant, the roommate effect of 0.038 with a significant p-value indicates that each sugary beverage a roommate drank before college increases 0.038 drinks of self’s sugary beverage in college per month. Interestingly, this roommate effect is bit larger on female students (0.040) than males. Similarly, this study also found a significant and positive roommate effect on self’s college physical exercise participation. The roommate effect of 0.035 indicates that each episode of physical exercise in high school that a roommate took part in increases self’s 0.035 episodes of physical exercise participation in college while holding his/her personal and family
20
Table 3 presents the full models of the main effects of peer influence on college obesity-related risk health behaviors and BMI without gender distinction. Each column is a random effect model regressing self’s obesity-related risk health behaviors/ BMI in college on both self’s and roommate’s high school corresponding behaviors/BMI, adjusting for gender, racial ethnicity, college GPA, and respondents’ parents’ education, and household income etc.
Other than the results that I reported in Table 2, Table 3 shows that being an African American increases the likelihood of drinking sugary beverage in college while having higher household income decreases the likelihood of drinking sugary beverage. In addition, having higher household income increases the likelihood of attending physical exercise in college. Moreover, although a direct roommate effect on BMI is not found, college GPA is found to be significantly and negatively associated with college BMI.
Table 4 presents the effect of the interactions between self and roommate’s pre-college obesity-related health risk behaviors/BMI on self’s college obesity-related health risk behaviors /BMI. This table shows that peer influence of obesity-related risk health behaviors/BMI depends on self’s pre-college behaviors/BMI.
The interaction term in the model of college sugary drink intake is positive and
21
Table 5 presents the full models of the peer influence by self’s pre-college obesity-related health risk behaviors/BMI interaction on college obesity-related health risk behaviors/BMI with gender distinction.
22
CHAPTER 5: DISCUSSION AND CONCLUSION
The alarming increase in obesity in the recent years has caught researchers’ attention. Besides finding out the various causes of obesity, much effort has been placed on studying the social influence of obesity. In the meantime, some policy implications have been provided in order to reduce peer influence in a school setting (Nelson et al. 2008) due to the growing number of obese young adults including well-educated people. However, the estimation of peer influence encountered several challenges (please see “challenges in estimating peer influence” under “literature review”) and painted a mixed picture (Christakis and Fowler 2007; Cohen-Cole and Fletcher 2008; Lyons 2011). In other words, the peer influence on young adults’ obesity remains unclear. Recently, both Mouw (2006) and Lyons (2011) point out that a natural experiment with randomly assigned individuals should be a better option for estimating peer effect. Therefore, this paper uses a randomly-assigned college roommate dataset (ROOM) with a large sample size to investigate peer influence on college students’ BMI and obesity-related health risk behaviors.
23
24
TABLE 1: Descriptive Statistics of the Sample
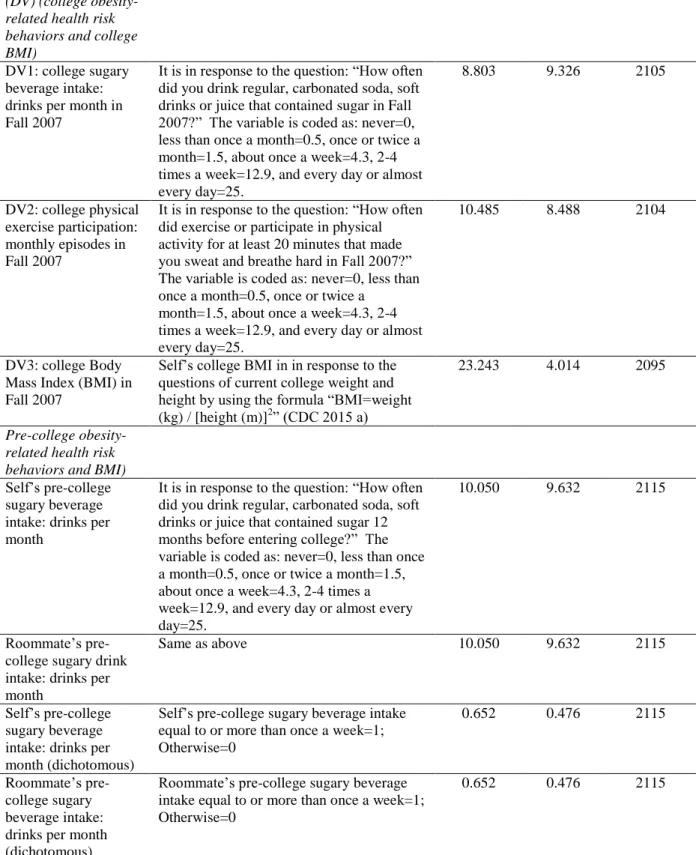
Variable Description/Coding Definition Mean SD N
Dependent variables (DV) (college obesity-related health risk behaviors and college BMI)
DV1: college sugary beverage intake: drinks per month in Fall 2007
It is in response to the question: “How often did you drink regular, carbonated soda, soft drinks or juice that contained sugar in Fall 2007?” The variable is coded as: never=0, less than once a month=0.5, once or twice a month=1.5, about once a week=4.3, 2-4 times a week=12.9, and every day or almost every day=25.
8.803 9.326 2105
DV2: college physical exercise participation: monthly episodes in Fall 2007
It is in response to the question: “How often did exercise or participate in physical activity for at least 20 minutes that made you sweat and breathe hard in Fall 2007?” The variable is coded as: never=0, less than once a month=0.5, once or twice a
month=1.5, about once a week=4.3, 2-4 times a week=12.9, and every day or almost every day=25.
10.485 8.488 2104
DV3: college Body Mass Index (BMI) in Fall 2007
Self’s college BMI in in response to the questions of current college weight and height by using the formula “BMI=weight (kg) / [height (m)]2” (CDC 2015 a)
23.243 4.014 2095
Pre-college obesity-related health risk behaviors and BMI)
Self’s pre-college sugary beverage intake: drinks per month
It is in response to the question: “How often did you drink regular, carbonated soda, soft drinks or juice that contained sugar 12 months before entering college?” The variable is coded as: never=0, less than once a month=0.5, once or twice a month=1.5, about once a week=4.3, 2-4 times a week=12.9, and every day or almost every day=25.
10.050 9.632 2115
Roommate’s pre-college sugary drink intake: drinks per month
Same as above 10.050 9.632 2115
Self’s pre-college sugary beverage intake: drinks per month (dichotomous)
Self’s pre-college sugary beverage intake equal to or more than once a week=1; Otherwise=0
0.652 0.476 2115
Roommate’s pre-college sugary beverage intake: drinks per month (dichotomous)
Roommate’s pre-college sugary beverage intake equal to or more than once a week=1; Otherwise=0
25 Self’s Pre-college
physical exercise participation: monthly episodes
It is in response to the question: “How often did exercise or participate in physical activity for at least 20 minutes that made you sweat and breathe hard 12 months before entering college?” The variable is coded as: never=0, less than once a month=0.5, once or twice a month=1.5, about once a week=4.3, 2-4 times a week=12.9, and every day or almost every day=25.
13.444 9.302 2111
Roommate’s pre-college physical exercise participation: monthly episodes
Same as above 13.444 9.302 2111
Self’s Pre-college physical exercise participation: monthly episodes
(dichotomous)
Self’s pre-college physical exercise participation equal to or more than once a week=1;
Otherwise=0
0.815 0.388 2111
Roommate’s Pre-college physical exercise participation: monthly episodes (dichotomous)
Roommate’s pre-college physical exercise participation equal to or more than once a week=1;
Otherwise=0
0.815 0.388 2111
Self’s pre-college BMI
It is in response to the questions of weight and height when he/she first entered college by using the formula “BMI=weight (kg) / [height (m)]2” (CDC 2015 a)
22.766 4.048 2084
Roommate’s pre-college BMI
Same as above 22.766 4.048 2084
Self’s pre-college BMI (dichotomous)
Self’s pre-college BMI>=25 is 1’ Otherwise is 0
0.249 0.404 2084
Roommate’s pre-college BMI (dichotomous)
Roommate’s pre-college BMI>=25 is 1’ Otherwise is 0
0.249 0.404 2084
Controls Controls
Racial ethnicity Respondent’s racial ethnicity: White=0 (70.80%) African=1 (13.44%) Hispanic=2 (7.41%) Asian=3 (7.12%) Other=4 (1.23%)
2106
Female Respondent’s gender:
Female=1, Male=0
0.620 0.485 2120
Household income Respondent’s self-reported parents' or
guardians' total income in the 12 months before college <$25,000=0 $25000-49,999=1 $50,000-74,999=2 $75,000-99,999=3 $100,000-149,999=4 $150,000-199,999=5 $200,000-249,999=6 $250,000-499,999=7
26 $500,000 or more=8
Mother’s education Highest education that respondent’s mother obtained:
Middle school or less=0 Some high school=1 High school graduate=2 Some college=3
College degree=4
Postsecondary school other than college=5 Graduate or professional coursework or degree=6
4.326 1.384 2106
Father’s education Highest education that respondent’s father obtained:
Middle school or less=0 Some high school=1 High school graduate=2 Some college=3
College degree=4
Postsecondary school other than college=5 Graduate or professional coursework or degree=6
4.501 1.493 2065
27
Table 2: The Estimation of Main or Average Peer Influence (p-value) with Gender Distinction
In the following random-effect models (in each separate row), self’s college obesity-related health risk behaviors are regressed on roommate’s pre-college behavior, own high school behavior and controls.
Average/Main Effect
Obesity-Related Health
Behaviors/BMI in College Sample
Own pre-college Behaviors/BMI
Roommate’s pre-college
behaviors/BMI N
College sugary drink intake: drinks per month in Fall 2007
overall 0.640 (0.016)** 0.038 (0.016)* 2089
males 0.628 (0.027)** 0.039 (0.027) 791
females 0.643 (0.021)** 0.040 (0.020)* 1298 College physical exercise
participation: monthly episodes in Fall 2007
overall 0.394 (0.018)** 0.035 (0.018)* 2081
males 0.440 (0.030)** 0.032(0.029) 790
females 0.368 (0.023)** 0.033 (0.022) 1291
College Body Mass Index (BMI) in Fall 2007
overall 0.913 (0.008)** 0.008 (0.008) 2041
males 0.913 (0.013)** 0.002 (0.012) 781
females 0.913(0.011)** 0.012 (0.011) 1260
Notes: Controls in the regression models include self’s family social economic status (family income, father’s education, mother’s education) and self’s GPA in the fall semester in 2007, and self’s race/ethnicity as well as gender)
28
Table 3: Full Models of the Main Effects of Peer Influence on College Obesity-Related Health Risk Behaviors and BMI without Gender Distinction (each column is a random
effect model)
Obesity-Related Health
Behaviors/BMI in College
College sugary drink intake: monthly episodes in Fall 2007
College physical exercise
participation: monthly episodes in Fall 2007
College Body Mass Index (BMI) in Fall 2007
Main effects
Self’s pre-college monthly sugary drink intake
0.640 (0.016)** - -
Roommate’s pre-college monthly sugary drink intake
0.038 (0.016)* - -
Self’s Pre-college monthly physical exercise participation
- 0.394 (0.018)** -
Roommate’s pre-college monthly physical exercise participation
- 0.035 (0.018)* -
Self’s pre-college BMI - - 0.913 (0.008)**
Roommate’s pre-college BMI
- - 0.008 (0.008)
Controls
African 0.025* -0.408 -0.038
Hispanic -0.801 0.600 -0.068
Asian -0.424 -0.668 -0.148
Other 0.258 0.755 -0.029
White - - -
Female -0.310 -1.144** -0.165*
Household income -0.203* 0.206* -0.029
Mother’s education 0.065 0.124 -0.010
Father’s education 0.032 -0.083 0.041
GPA -0.386 0.785 -0.386**
N 2089 2081 2041
Notes: ** p-value<0.01; * p-value<0.05; #p-value<0.1
29
Table 4: Peer Influence of College Obesity-Related Health Risk Behaviors/BMI Depends on Self’s Pre-college Obesity-Related Health Risk Behaviors/BMI with Gender Distinction
In the following random-effect models (in each separate row), self’s pre-college obesity-related health behaviors/BMI is interacted with roommate’s pre-college obesity-related health
behaviors/BMI to predict self’s college obesity-related health behaviors/BMI. Self’s college obesity-related health behaviors/BMI is also regressed on roommate’s pre-college behavior, own high school behavior and controls. This table shows the coefficients and standard errors of the interaction terms, the main roommate effect and self’s pre-college effect in each regression.
Obesity-Related Health Behaviors in College
Sample Coefficient (standard error) of the interaction terms
N
Self college sugary drink intake in Fall 2007
Overall 1 1.369 (0.765)# 2089
Males 0.113 (1.725) 791
Females 1.804 (0.880)* (figure 1) 1298 Self college physical exercise
in Fall 2007
Overall 2 0.017 (0.046) 2081
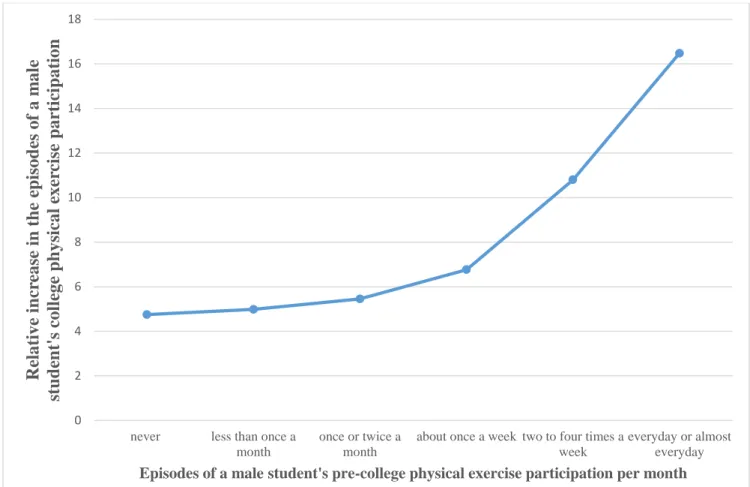
Males 0.223 (0.087)* (figure 2) 790
Females -0.074 (0.054) 1291
Self college BMI Overall 3 0.013 (0.374) 2041
Males 0.659 (0.483) 781
Females -0.325 (0.593) 1260
Notes: Controls in the regression models include self’s family social economic status (family income, father’s education, mother’s education) and self’s GPA in the fall semester in 2007, and self’s race/ethnicity as well as gender)
** p-value<0.01; * p-value<0.05; #p-value<0.1
1 In the model of “Self college sugary drink intake in Fall 2007,” the interaction term is between a dichotomous level of
roommate’s pre-college sugary drink intake (more than or equal to 4.3 drinks per month=1; less than 4.3 drinks per month=0) and a dichotomous level of self’s pre-college sugary drink intake (more than or equal to 4.3 drinks per month=1; less than 4.3 drinks per month=0)
2 In the model of “Self college physical exercise in Fall 2007,” the interaction term is between a dichotomous level of roommate’s pre-college physical exercise frequency (more than or equal to 4.3 times per month=1; less than 4.3 times per month=0) and a continuous measure of self’s pre-college physical exercise frequency.
3 In the model of “Self college BMI,” the interaction term is between a dichotomous measure of a roommate pre-college BMI (greater than or equal to 25=1; smaller than 25=0) )and a dichotomous measure of self pre-college BMI (greater than or equal to 25=1; smaller than 25=0) ).
30
Table 5: Full Models of Peer Influence by Self’s Pre-College Obesity-Related Health Risk Behaviors/BMI Interaction on College Obesity-Related Health Risk Behaviors/BMI with
Gender Distinction (each column is a random effect model).
Obesity-Related Health
Behaviors/BMI in College
College sugary drink intake: monthly episodes in Fall 2007
College physical exercise participation: monthly episodes in Fall 2007
College Body Mass Index (BMI) in Fall 2007
Male Female Male Female Male Female
Main effects
Self’s pre-college monthly sugary drink intake 9.922 (1.527)** 8.228 (0.677)** - - - - Roommate’s pre-college monthly sugary drink intake
0.369 (1.524) -0.213 (0.670) - - - - Self’s pre-college monthly sugary drink intake* Roommate’s pre-college monthly sugary drink intake1 0.113 (1.725) 1.804 (0.880)* - - - - Self’s Pre-college monthly physical exercise participation
- - 0.246
(0.082) ** 0.424 (0.047)** - - Roommate’s pre-college monthly physical exercise participation
- - -2.541
(1.422)# 1.629 (0.859)# - - Self’s Pre-college monthly physical exercise participation* Roommate’s pre-college monthly physical exercise participation2
- - 0.223
(0.087)* -0.074 (0.054) - - Self’s pre-college BMI
- - - - 5.759
(0.258)**
7.326 (0.236)**
Roommate’s pre-college BMI
- - - - 0.026
(0.257)
0.015 (0.231)
Self’s pre-college BMI* Roommate’s
pre-college BMI3
- - - - 0.659
(0.484)
-0.325 (0.593)
Controls
African -0.348
(1.152) 1.933 (0.614)** 1.924 (1.003)# -1.220 (0.606)* 1.159 (0.372)** 0.679 (0.236)**
31
(1.100)# (0.853) (0.953) (0.866) (0.348) (0.334)
Asian -1.242
(1.177) -0.610 (0.837) -0.700 (1.025) -0.597 (0.838) 0.012 (0.372) -0.902 (0.317)**
Other -3.188
(2.691) 0.192 (1.915) 3.577 (2.337) -1.238 (1.963) -0.537 (0.843) -0.624 (0.834)
White - - - -
Household income -0.094
(0.175) -0.233 (0.122)# 0.019 (0.153) 0.320 (0.123)** -0.004 (0.055) -0.033 (0.047)
Mother’s education -0.187
(0.255) 0.031 (0.179) 0.323 (0.222) -0.008 (0.178) 0.063 (0.081) 0.051 (0.068)
Father’s education 0.010
(0.252) -0.283 (0.171)# 0.072 (0.219) -0.180 (0.171) -0.097 (0.080) -0.098 (0.068)
GPA -0.770
(0.591) -0.869 (0.418)* 0.908 (0.512)# 0.777 (0.416) -0.449 (0.186)* -0.695 (0.160)**
N 791 1298 790 1291 784 1268
** p-value<0.01; * p-value<0.05; #p-value<0.1
1 In the model of “Self college sugary drink intake in Fall 2007,” the interaction term is between a dichotomous level of
roommate’s pre-college sugary drink intake (more than or equal to 4.3 drinks per month=1; less than 4.3 drinks per month=0) and a dichotomous level of self’s pre-college sugary drink intake (more than or equal to 4.3 drinks per month=1; less than 4.3 drinks per month=0)
2 In the model of “Self college physical exercise in Fall 2007,” the interaction term is between a dichotomous level of roommate’s pre-college physical exercise frequency (more than or equal to 4.3 times per month=1; less than 4.3 times per month=0) and a continuous measure of self’s pre-college physical exercise frequency.
32
Figure 1: Effect of a female student’s pre-college sugary drink intake amount on her own college sugary drink intake amount given her roommate’s high-level pre-college sugary
drink intake.
Figure 1 depicts that peer influence of the number of sugary drinks a typical female student has in college also depends on her own pre-college sugary drink intake amount. A typical female student is a white college student whose family income is between $75,000 through $149,999, and both of her parents had a college degree, and her GPA in the last fall semester was about 3.235.
Given her college roommate’s pre-college sugary drink intake amount was on a high level (more than or equal to 4.3 sugary drinks per month), comparing to having a low-level sugary drink intake before college, her having high-level sugary drink intake per month prior to college, she will increase about 10 sugary drinks per month in college.
0 2 4 6 8 10 12 14
self had low-level sugary drinks per month before college
33
Figure 2: Effect of a male student’s pre-college physical exercise amount on his college physical exercise amount given his roommate’s high level pre-college physical exercise
participation.
Figure 2 shows that peer influence of a typical male student’s college physical exercise also depends on his own pre-college physical exercise frequency. A typical male student is a white college student whose family income is between $75,000 through $149,999, and both of his parents had a college degree, and his GPA in the last fall semester was about 3.242. Given his college roommate’s high-level physical exercise participation before college, the more frequent he attended physical exercise prior to college, the more likely he will increase his college physical exercise participation.
0 2 4 6 8 10 12 14 16 18
never less than once a month
once or twice a month
about once a week two to four times a week
everyday or almost everyday Re lative in cr ease in the ep isod es of a m ale stud en t's coll ege p h ysical exe rc ise p ar tic ip at ion
34
REFERENCES
Akers, R.L. 1977. Deviant Behavior: A Social Learning Approach 2nd ed. Belmont, CA: Wadsworth Publishing.
American College Health Association. 2011. “ACHA-National College Health Assessment II.”
http://www.acha-ncha.org/docs/ACHA-NCHA-II_ReferenceGroup_ExecutiveSummary_Fall2011.pdf.
Arnett, J. 2000. “Emerging adulthood: A Theory of Development from the Late Teens through the Twenties.” American Psychologist 55: 469 – 480.
Bandura, A. 1977. Social Learning Theory. Englewood Cliffs, NJ: Prentice Hall.
Bandura, A. 1986. Social Foundations of Thought and Action: A Social Cognitive Theory. Englewood Cliffs: Prentice-Hall Inc.
Bauman, K.E., and Ennett, S. 1996. “On the Importance of Peer Influence for Adolescent Drug Use: Commonly Neglected Considerations.” Addiction 91: 185-198.
Borsari, B and K. Carey. 2001. “Peer Influences on College Drinking: A Review of the Research.” Journal of Substance Abuse. 13 (4): 391-424.
Bristol, T. and Mangleburg, T.F. 2005. “Not Telling the Whole Story: Teen Deception in Purchasing.” Journal of the Academy of Marketing Science 33(1): 79-95.
Brown, B. B. 1982. “The Extent and Effects of Peer Pressure among High School Students: A Retrospective Analysis. Journal of Youth Adolescents 11: 121-133.
Bruijn, Ger-Jan de, Stef P.J.Kremers, Hein de Vries, Willem van Mechelen and Johannes Brug. 2006. “Associations of Social–environmental and Individual-level Factors with
Adolescent Soft Drink Consumption: Results from the SMILE study.” Health Education Research 22(2): 227-237.
Burgess, R. and R. Akers.1966. “A Differential Association-Reinforcement Theory of Criminal Behavior.” Social Problems 14: 128-147.
Centers of Disease Control and Prevention. 2015 a. “What is BMI?”
http://www.cdc.gov/healthyweight/assessing/bmi/adult_bmi/index.html
Centers of Disease Control and Prevention. 2015 b. “Defining Overweight and Obesity.” http://www.cdc.gov/obesity/adult/defining.html
35
Christakis, Nicholas A. and James H. Fowler. 2007. “The Spread of Obesity in a Large Social Network over 32 Years.” The New England Journal of Medicine 357:370-9.
Cohen-Cole, Ethan and Jason M. Fletcher. 2008. “Is Obesity Contagious? Social Networks vs. Environmental Factors in the Obesity Epidemic.” Journal of Health Economics 27(5): 1382-1387.
Coleman, J.C. 1980. Friendship and the Peer Group in Adolescence. New York: Wiley. Cohen J., Jere M. 1977. "Sources of Peer Group Homogeneity. Sociology of Education."
Sociology of Education 50:227-41.
Cutler D.M. Cutler, E.L. Glaeser, J.M. Shapiro. 2003. “Why Have Americans Become More Obese?”Journal of Economic Perspectives. 17(3): 93–118.
Daniels, S.R. “The Consequences of Childhood Overweight and Obesity.” Future Child 16: 47- 67.
Dawes, Laura. 2014. Childhood Obesity in America: Biography of an Epidemic. Cambridge, Mass: Harvard University Press.
Deforche, Nenedicte, Delfien Van Dyck, Tom Deliens and Ilse De Bourdeaudhui. 2015. “Changes in Weight, Physical Activity, Sedentary Behaviour and Dietary Intake during the Transition to Higher Education: A Prospective Study.” International Journal of Behavioral Nutrition and Physical Activity 12:16.
Desai, Melissa N., William C. Miller, Betty Staples, Terrill Bravender. 2008. “Risk Factors Associated With Overweight and Obesity in College Students.” Journal of American College Health 57 (1): 109-114.
Dixon, John B. 2010. “The effect of obesity on health outcomes.” Molecular and Cellular Endocrinology 316: 104–108.
Duncan, G., & Brooks-Gunn, J. 1997. Consequences of growing up poor. New York, NY: Russell Sage Foundation.
Duncan, G. J., Boisjoly, J., Kremer, M., Levy, D. M., & Eccles, J. 2005. “Peer Effects in Drug Use and Sex Among College Students.” Journal of Abnormal Child Psychology, 33(3), 375–385.
36
Thomis, and C. Delecluse. 2008. “Relationship of Obesity with Physicla Activity, Aerobic Fitness and Muscle Strenth in Flemish Adults.” The Journal of Sports Medicine and Physical Fitness 48 (2): 201-210.
Ebbeling, Cara B., Henry A. Feklman, Virginia R. Chomitz, Tracy A. Antonelli, Steven L. Gortmaker, Stavroula K. Osganian, and David S. Ludwig. 2012. “A Randomized Trial of Sugar-Sweetened Beverages and Adolescent Body Weight.” The New England Journal of Medicine 367: 1407-1416.
Eisenberg, M.E., Neumark-Sztainer, D., Story, M., Perry, C., 2005. “The Role of Social Norms and Friends’ Influences on Unhealthy Weight-Control Behaviors among Adolescent Girls. Social Science and Medicine 60: 1165–1173.
Eisenberg, Daniel, Ezra Golberstein, and Janis L. Whitlock. 2014. "Peer Effects on Risky Behaviors: New Evidence from College Roommate Assignments." Journal of Health Economics 33:126-138
Eriksen, Erik H. 1994. Identity Youth and Crisis. New York: W.W. Norton & Company, Inc. Fang, Ruolian. 2011. “Peer Influence on Undermining Behaviors in the Workplace: A Social
Network Perspective.” Dissertation. University of Michigan.
Feunekes, C. de Graaf, S.Meyboom, W.A. van Staveren. 1998. “Food Choice and Fat Intake of Adolescents and Adults. Associations of Intakes within Social Networks.” Preventive Medicine 27: 645-656.
Finkelstein, E.A., Trogdon, J.G., Brown, D.S., Allaire, B.T., Dellea, P.S., Kamal-Bahl, S.J., 2008. “The Lifetime Medical Cost Burden of Overweight and Obesity: Implications for Obesity Prevention.” Obesity 16: 1843–1848.
Finnerty, Tara, Sue Reeves, Jaqueline Dabinett, Yvonne M Jeanes and Claus Vogele. 2009. “Effects of Peer Influence on Dietary Intake and Physical Activity in Schoolchildren.”
Public Health Nutrition: 13(3): 376–383.
Fitzgerald, Amanda, Noelle Fitzgerald, and Cian Aherne. “Do Peers Matter? A Review of Peer and/or Friends’ Influence on Physical Activity among American Adolescents.” Journal of Adolescence 35 (2012) 941–958
Flegal, Katherine M., Margaret D. Carroll, Brian K. Kit, and Cynthia L. Ogden. 2012.
37
Foster, G. 2006. "It's not your peers, and it's not your friends: Some progress toward
understanding the educational peer effect mechanism." Journal of Public Economics
90:1455-1475.
Fowler, James H., Jaime E. Settle, and Nicholas A. Christakis. 2011. “Correlated Genotypes in Friendship Networks.” PNAS 108 (5): 1993-1997.
Friedman, Jeffrey M. 2009. “Obesity: Causes and Control of Excess Body Fat.” Nature 459: 340-342.
Gordon-Larsen,Penny, Linda S Adair,Melissa C Nelson, andBarry M Popkin. 2004. “Five- Year Obesity Incidence in the Transition Period between Adolescence and Adulthood: The National Longitudinal Study of Adolescent Health” American Journal of Clinical Nutrition 80 (3): 569-575.
Gropper, Sareen S., Karla P. Simmons, Lenda Jo Connell, and Pemela V. Ulrich. 2012. “Weight and Body Composition Changes during the First Three Years of College.” Journal of Obesity
Guo, Guang, Kari E. North, Penny Gorden-Larsen, Cynthis M. Bulik, and Seulki Choi. 2007. “Body Mass, DRD4, Physical Activity, Sedentary Behavior, and Family Socioeconomic Status: The Add Health Study.” Obesity 15 (5): 1199-1206.
Guo, Guang, Glen H.Elder, Tianji Cai, Hathan Hamilton. 2009. “Gene-environment Interactions: Peers’ Alcohol Use Moderates Genetic Contribution to Adolescent Drinking Behavior.”
Social Science Research 38 (1): 213-224.
Guo, Guang,Yi Li, Hongyu Wang, and Greg Duncan. 2015. “A Natural Experiment of Peer Influences on Youth Alcohol Use.” Social Science Research 52: 193-207.
Guo S, Huang C, Maynard L, et al. 2000. “Body Mass Index during Childhood, Adolescence, and Young Adulthood in Relation to Adult Overweight and Adiposity: the Fels
Longitudinal Study.” International Journal of Obesity 24:1628–1635 Grusec, Joan E. 1992. “Social Learning Theory and Developmental Psychology.”
Developmental psychology 28(5): 776-786.
Haynie, Dana L. 2013. “Delinquent Peers Revisited: Does Network Structure Matter?” American Journal of Sociology 106 (4): 1013-1057.
Haynie, Dana L. and D. Wayne Osgood. 2005. “Reconsidering Peers and Delinquency: How do Peers Matter?” Social Forces 84 (2): 1109-1130.
38
Content Analysis.” Journal of Health Communication 16(9): 976-987.
Hill, J.O. and J.C. Peters. 1998. “Environmental Contributions to the Obesity Epidemic.” Science 280:1371-1374.
Huynh-Hohnbaum, Anh-Luu Thi. 2004. “Understanding Delinquent Peer Influence Using a Social Network Approach.” (dissertation) University of Michigan.
Johnson, R. 1979. Juvenile Delinquency and its Origins. Cambridge, UK: Cambridge University Press.
Jung, M.E., S.R. Bray, K.A.M.Ginis. 2008. “Behavior Change and the Freshman 15: Tracking Physical Activity and Dietary Patterns in 1st-year University Women (report).” Journal of American College Health 56 (5): 523.
Kandel, D. B. 1978. “Homophily, Selection, and Socialization in Adolescent Friendships.”
American Journal of Sociology 84:427-436.
Kenchaiah, S., Evans, J.C., Levy, D., et al., 2002. “Obesity and the risk of heart failure.” New England Journal of Medicine 347: 305–313.
Kipke, M.D., E. Iverson, D.Moore, C.Booker, V.Ruelas, A.L.Peters. 2007. “Food and Park Environments: Neighborhood-level Risks for Childhood Obesity in East Los Angeles.”
Journal of Adolescent Health 40: 325-333.
Kvaavik E, Andersen LF & Klepp KI. 2005. “The Stability of Soft Drinks Intake from
Adolescence to Adult Age and the Association between Long-term Consumption of Soft Drinks and Lifestyle Factors and Body Weight.” Public Health Nutr 8: 149–157.
Lakon, Cynthia M. and Thomas W. Valente. 2012. “Social Integration in Friendship Networks: The Synergy of Network Structure and Peer Influence in Relation to Cigarette Smoking among High Risk Adolescents.” Social Science &Medicine. 74 (9): 1407-1417.
Lariscy, R. W., Reber, B. H., & Paek, H. J. 2010. “Examination of Media Channels and Types as Health Information Sources for Adolescents: Comparisons for Black/White,
Male/Female, Urban/Rural.” Journal of Broadcasting & Electronic Media 54(1): 102-120.
Levitsky, D.A., C.A. Halbmaier, G.Mrdjenovic. 2004. “The Freshman Weight Gain: A Model for the Study of the Epidemic of Obesity.” International Journal of Obesity 28(11): 1435-1442.
39
Vegetable Consumption among Adults in 16 US States: Behavioral Risk Factor
Surveillance System, 1990–1996. American Journal of Public Health, 90 (5): 777–781. Libby Hattersley, Melissa Irwin, Lesley King and Margaret Allman-Farinelli. 2006.
“Determinants and Patterns of Soft Drink Consumption in Young Adults: A Qualitative Analysis.” Public Health Nutrition 12(10), 1816–1822.
Lien, Nanna, Leslie A. Lytle, Knut-lnge, Klepp. 2001. “Stability in Consumption of Fruit, Vegetables, and Sugary Foods in a Cohort from Age 14 to Age 21.” Preventive Medine
33: 217–226.
Lloyd-Richardson E., Bailey S., Fava J. L., Wing R.& The Robert Wood Johnson Foundation Tobacco Etiology Research Network. 2009. “A Prospective Study of Weight Gain during the College Freshman and Sophomore Years.” Preventive Medicine 48: 256-261.
Lyons, Russell. 2011. “The Spread of Evidence-Poor Medicine via Flawed Social-Network Analysis.” Statistics, Politics, and Policy 2(1): 1-26.
Mackey, Carole S. 2015. “Body Mass Index.” http://www.faqs.org/nutrition/Ar-Bu/Body-Mass- Index.html
Maisto, S. A., Carey, K. B., & Bradizza, C. M. 1999. Social learning theory. In: K. E. Leonard, & H. T. Blane (Eds.), Psychological theories of drinking and alcoholism (2nd ed.). New York: Guilford Press.
Manski, C.F. 1993. “Identification of Endogenous Social Effects: The Reflection Problem.”
Review of Economic Studies, 60 (3): 531–542.
Malik V.S., M.B.Schulze, F.B. Hu. 2006. “Intake of Sugar-Sweetened Beverages and Weight Gain: A Systematic Review.” American Journal of Clinical Nutrition 84: 274-288. Malik V.S. and F.B. Hu 2011. “Sugar-sweetened Beverages and Health: Where Does the
Evidence Stand?” American Journal of Clinical Nutrition 94: 1161-1162.
Mare, R.D. 1991. “Five Decades of Educational Assortative Mating.” American Sociological Review 56 (1): 15–32.
McLaren, L. 2007. “Socioeconomic Status and Obesity.” Epidemiologic Reviews 29: 29–48. McPherson, M. L. Smith-Lovin, J.M. Cook. 2001. “Birds of a Feather: Homophily in Social
Networks.” Annual Review of Sociology 27 (1): 415–444.
40
Mehta, Neil K. and Virginia W. Chang. 2009. “Mortality Attributable to Obesity among Middle- aged Adulets in the United States.” Demography. 46 (4): 851-872.
Mitchell, Jonathan A., Calum Mattocks, Andy R. Ness, Sam D. Leary, Russell R. Pate, Marsha Dowda, Steven N. Blair and Chris Riddoch. 2009. “Sedentary Behavior and Obesity in a Large Cohort of Children.” Obesity 17 (8): 1596-1602.
Mokdad,A.H. B.A. Bowman, E.S. Ford, F. Vinicor, J.S. Marks, J.P. Koplan T. 2001. “The Continuing Epidemics of Obesity and Diabetes in the United States.” Journal of American Medical Association 286 (10): 1195–1200
Mokdad, A. H., Earl S. Ford, Barbara A. Bowman, William H. Dietz, Frank Vinicor, Virginia S. Bales, and James S. Marks. 2003. “Prevalence of Obesity, Diabetes, and Obesity-Related Health Risk Factor, 2001.” Journal of the American Medical Association 289: 76–9. Monteiro, C. A., E. C. Moura, W. L. Conde, and B. M. Popkin. 2004. “Socioeconomic Status
and Obesity in Adult Populations of Developing Countries: A Review.” Bulletin of the World Health Organization 82: 940–946.
Morrow, M.L., K.C. Heesch, M.K. Dinger, H.R. Hull, A.W. Kneehans, D.A. Fields. 2006. “Freshman 15: Fact of Fiction?” Obesity 14(8): 1438-1443.
Mouw, Ted. 2006. “Estimating the Causal Effect of Social Capital: A Review of Recent Research.” Annual Review of Sociology. 32:79-102.
Nelson, M.C., M.Story, N.I. Larson, D.Neumark-Sztainer, L.A.Lytle. 2008. “Emerging Adulthood and College-age Youth: An Overlooked Age for Weight-related Behavior Change.” Obesity 16: 2205-2211.
Newell, Ben R. and David R. Shanks. 2014. “Unconscious Influences on Decision Making: A Critical Review.” Behavioral and Brian Sciences 37: 1-61.
Nørgaard, Maria Kümpel, Kathrine Nørgaard Hansen, Klaus G Grunert. 2013. Journal of Social Marketing 3(2): 176-194.
Odlaug, Brian L., Katherine Lust, Cathrine L. Wimmelmann, Samuel R. Chamberlain, Erik L. Mortensen,
Katherine Derbyshire, Gary Christenson, Jon E. Grant. 2015. “Prevalence and Correlates of Being Overweight or Obese in College.” Psychiatry Research 227: 58-64.
41
Osgood, D. Wayne, Janet K. Wilson, Patrick M. O’Malley, Jerald G. Bachman and Lloyd D. Johnston. 1996. “Routine Activities and Individual Deviant Behavior.” American Sociological Review 61:635-55.
Paxton, S.J., H.K.Schutz, E.H.Wertheim and S.L.Muir. 1999. “Friendship Clique and Peer Influences on Body Image Concerns, Dietary Restraint, Extreme Weight-loss Behaviors, and Binge Eating in Adolescent Girls.” Journal of Abnormal Psychology 108: 256-266. Payne, D. and Cornwell, B. 2007. “Reconsidering Peer Influences on Delinquency: Do Less
Proximate Contacts Matter?” Journal of Quantitative Criminology 23: 127-149.
Perry CL, Baranowski T, Parcel GS. 1990. “How Individuals, Environments, and Health Behavior Interact: Social Learning Theory.” In: Glanz K, Lewis FM, Rimer BK, eds. Health Behavior and Health Education. San Francisco: Jossey-Bass: 161-186.
Philipson, T.J. and R.A. Posner. 2003. “The Long-run Growth in Obesity as a Function of Technological Change.” Perspectives in Biology and Medicine 46 (3): 87-108.
Popkin, B.M, G.A. Bray and F. Hu. 2015. “The Role of High Sugar Foods and Sugar-Sweetened Beverages in Weight Gain and Obesity.” Pp. 45-58 in Timothy Gill ed. Managing and Preventing Obesity: Behavioural Factors and Dietary Interventions. Woodhead
Publishing.
Qi, Qibin, Audrey Y. Chu, Jae H. Kang, Majken K. Jensen, Gary C. Curhan, Louis R. Pasquale, Paul M. Ridker, David J. Hunter, Walter C. Willett, Eric B. Rimm, Daniel I. Chasman, Frank B. Hu and Lu Qi.2012. “Sugar-Sweetened Beverages and Genetic Risk of Obesity.” The New England Journal of Medicine 367(15): 1387-1396.
Qi L, Cho YA. 2008. “Gene-environment Interaction and Obesity.” Nutr Rev 66: 684-94. Racette SB, Deusinger SS, Strube MJ, Highstein GR, Deusinger RH. “Weight Changes,
Exercise, and Dietary Patterns during Freshman and Sophomore Years of College.”
Journal of American College Health. 2005(53):245–251.
Romero, N.D., L.H.Epstein and S.J.Salvy. 2009. “Peer Modeling Influence Girls’ Snack Intake.”
Journal of the American Dietetic Association 109: 133-136.
Sacerdote, Bruce, 2001. “Peer Effects with Random Assignment: Results for Dartmouth Roommates”. Quarterly Journal of Economics 116, 681–704.
Salvy, S.J., M.Howard, M.Read, E.Mele. 2009. “The Presence of Friends Increases Food Intake in Youth.” The American Journal of Clinical Nutrition 90: 282-287.
42
Reviews 31: 21–51.
Simons-Monton, Bruce and Tilda Farhat. 2012. “Recent Findings on Peer Group Influence on Adolescent Substance Use.” Journal of Primary Prevention 31(4): 191-208.
Simpson, D. B., Cloud, D. S., Newman, J. L., & Fuqua, D. R. 2008. “Sex and Gender Differences in Religiousness and Spirituality.” Psychology 36(1), 42–52.
Springer, Andrew E., Steven H Kelder, Deanna M. Hoelscher. 2006. “Social Support, Physical Activity and Sedentary Behavior among 6th-grade Girls: A Cross-Sectional Study.”
International Journal of Behavioral Nutrition and Physical Activity 3 (8):1-10. Stacy, Alan W., Steve Sussman, Clyde W. Dent, Burton Dee, and Brian R. Flay. 1992.
“Moderators of Peer Social Influence in Adolescent Smoking.” Personality and Social Psychology Bulletin 18 (2): 163-172.
Steinberg, Laurence and Kathryn C. Monahan. 2007. “Age Differences in Resistance to Peer Influence.” Developmental Psychology 43 (6): 1531-1543.
Stinebrickner, R., & Stinebrickner, T. 2006. “What can be Learned about Peer Effects Using College Roommates? Evidence from New Survey Data and Students from Disadvantaged Backgrounds.” Journal of Public Economics 90(8-9): 1435–1454.
Stone, Lorene Hemphill, Alfred C. Miranne, and Godfrey Ellis. 1979. “Parent-Peer Influence as a Predictor of Marijuana Use.” Adolescence 14 (53): 115-122.
Story, Mary, Dianne Neumark-Sztainer, Simone French. 2002. “American Dietetic Association.”
Journal of the American Dietetic Association: S40-S51.
Sturm, R., 2002. “The effects of obesity, smoking, and drinking on medical problems and costs. Obesity outranks both smoking and drinking in its deleterious effects on health and health costs.” Health Affairs 21:245–253.
Sutherland, E. H. 1947. Principles of Criminology, 4th Ed. . Philadelphia: J. B. Lippincott. Taylor, W, Baranowski T & Sallis J.1994. “Family Determinants of Childhood Physical
Activity: a Social-cognitive Model.” Advances in Exercise Adherence 1: 319–342. Tchernof, A., Lamarche, B., Prud’Homme, D., et al., 1996. “The Dense LDL Phenotype.
Association with Plasma Lipoprotein Levels, Visceral Obesity, and Hyperinsulinemia in Men.” Diabetes Care 19: 629–637.
43
Overweight.” Journal of Health Economics 27(5): 1388-1399.
Urberg, Kathryn A., Serdar M. Degirmencioglu, and Colleen Pilgrim. 1997. “Close Friend and Group Influence on Adolescent Cigarette Smoking and Alcohol Use.” Developmental Psychology 33 (5): 834-844.
—, Tolson, J. M. and Degirmencioglu, S. M. 1998. “Friendship Selection in Adolescent Friendship Networks.” Journal of Social and Personal Relationships 15: 703 – 710. Van der Horst K, Oenema A, Ferreira I, Wendel-Vos W,Giskes K, van Lenthe F & Brug J. 2007.
“A Systematic Review of Environmental Correlates of Obesity-related Dietary Behaviours in Youth.” Health Educ Res 22, 203–226.
Vella-Zarb R. A. and Elgar F. J. 2009. “The ‘freshman 5’: A Meta-Analysis of Weight Gain in the Freshman Year of College. Journal of American College Health 58: 161-166.
Von Post-Skagegard, M., G. Samuelson, B. Karlstrom, R. Mohsen, L. Berglund, L.E. Bratteby. 2002. “Changes in Food Habits in Healthy Swedish Adolescents during the Transition from Adolescence to Adulthood.” European Journal of Clinical Nutrition 56: 532–538. Wadden, T.A. and A.J. Stunkard. 2004. Handbook of Obesity Treatment. New York: The
Guilford Press.
Webb, Jennifer B., Abigail S.Hardin,Suzanne J.Schoenefeld,Mallory F.Fiery,Ying-YiChou 2013.“Acclimating to the High-Octane College Food Environment: Weight Gain Status and Psychological Dimensions of Appetite and Food Intake Regulation Among
Ethnically Diverse First-Year Women.” SAGE Open3:2158244013507435
Wengreen H. J., Moncur C. 2009. “Change in Diet, Physical Activity, and Body Weight among Young-adults during the Transition from High School to College.” Nutrition Journal 8: Article 32.
Wouters, Eveline J., Junilia K. Larsen, Stef P. Kremers, Pieter C. Dagnelie, Rinie Geenen. 2010. “Peer Influence on Snacking Behavior in Adolescence.”Appetite 55 (1): 11-17.
Voigt, Kristin. 2014. Childhood Obesity: Ethical and Policy Issues. Oxford, New York: Oxford University Press.
Xie, Y.H. and N. Singh. 2007. “The Impact of Young Adults’ Socialisation on Consumer Innovativeness.” Journal of Customer Behaviour 6(3): 229-248.
44
Evidence from a Natural Experiment.” Economics and Human Biology 9 (2): 119-132.
Yakusheva, Olga, Kandice A. Kapinos, and Daniel Eisenberg. 2013. "Estimating Heterogeneous and Hierarchical Peer Effects on Body Weight Using Roommate Assignments as a Natural Experiment." The Journal of Human Resources 49:234-261.
Zimmerman, D. J. 2003. "Peer effects in academic outcomes: Evidence from a natural experiment." Review of Economics and Statistics 85:9-23.