Received: April 2, 2015; Revised: June 23, 2015; Accepted: October 13, 2015
© The Author 2015. Published by Oxford University Press. All rights reserved. For Permissions, please e-mail: [email protected].
doi:10.1093/jnci/djv335
First published online November 9, 2015 Article
1 of 8
ar
ticle
article
Phase I Clinical Trials in Acute Myeloid Leukemia:
23-Year Experience From Cancer Therapy Evaluation
Program of the National Cancer Institute
Joshua F. Zeidner, Judith E. Karp, Amanda L. Blackford, Matthew C. Foster,
E. Claire Dees, Gary Smith, S. Percy Ivy, Pamela Harris
Affiliations of authors: University of North Carolina, Lineberger Comprehensive Cancer Center, Chapel Hill, NC (JFZ, MCF, ECD); Johns Hopkins Sidney Kimmel Comprehensive Cancer Center, Baltimore, MD (JEK, ALB); Cancer Therapy Evaluation Program, National Cancer Institute, Rockville, MD (GS, SPI, PH).
Corresponding Author: Joshua F. Zeidner, MD, University of North Carolina, Lineberger Comprehensive Cancer Center, 170 Manning Drive, Physician’s Office Building, 3rd floor, CB# 7305, Chapel Hill, NC 27599-7305 (e-mail: [email protected]).
Abstract
Background: Therapy for acute myeloid leukemia (AML) has largely remained unchanged, and outcomes are unsatisfactory. We sought to analyze outcomes of AML patients enrolled in phase I studies to determine whether overall response rates (ORR) and mortality rates have changed over time.
Methods: A retrospective analysis was performed on 711 adult AML patients enrolling in 45 phase I clinical trials
supported by the Cancer Therapy Evaluation Program of the National Cancer Institute from 1986 to 2009. Changes in ORR and mortality rates for patients enrolled in 1986 to 1990, 1991 to 1995, 1996 to 2000, 2001 to 2005, and 2006 to 2009 were estimated with multivariable logistic regression models. All statistical tests were two-sided.
Results: There was a statistically significant increase in AML patients enrolling in phase I clinical trials over time (1986 to 1990: n = 61; 2006 to 2009: n = 256; P = .03). The ORR for the entire cohort was 15.4% (1986 to 1990: 8.9%, 1991 to 1995: 21.1%; 1996 to 2000: 7.0%; 2001 to 2005: 10.0%; 2006 to 2009: 22.6%), and it statistically significantly improved over time (P < .001). There was a statistically significant improvement in ORRs with novel agents in combination vs single agents (ORR = 22.8% vs 4.7%, respectively, odds ratio = 5.95, 95% confidence interval = 3.22 to 11.9, P < .001). The 60-day mortality rate for the entire cohort was 22.6%, but it statistically significantly improved over time (P = .009).
Conclusions: There has been an encouraging increase in AML patients enrolling in phase I clinical studies over time. The improvement in ORRs appears to be partly because of the increase in combination trials and the inclusion of previously untreated poor-risk AML. Continued enrollment of AML patients in early phase clinical trials is vital for drug development and improvement in therapeutic outcomes.
Over the past four decades, the therapeutic advancements in the management of acute myeloid leukemia (AML) have been mini-mal. “7+3,” defined as seven days of continuous infusion cyta-rabine (100–200 mg/m2/day) and three days of an anthracycline
(most commonly daunorubicin 45–90 mg/m2/day), was originally
studied in the 1970s by Cancer and Leukemia Group B (CALGB) cooperative group studies and remains the standard induction regimen for all patients younger than 65 to 70 years who can
ar
ticle
ar
ticle
five-year OS, from 12.6% in 1997 to 1999 to 14.8% in 2006 to 2008, with no improvement in OS in those age 65 years and older (6).
Excluding all-trans retinoic acid (ATRA) and arsenic trioxide for acute promyelocytic leukemia (APL), no new agents have been approved and incorporated into standard of care for AML since idarubicin was approved in combination (ie, 7+3) in 1990. Induction regimens consisting of idarubicin vs daunorubicin have yielded similar outcomes (7). Gemtuzumab ozogamicin (GO), a monoclo-nal antibody targeting CD33 antigen linked with calicheamicin, received accelerated approval by the United States Federal Drug Administration (FDA) in 2000 after GO showed efficacy as a single agent in relapsed and refractory AML (8,9). However, GO was with-drawn from the United States market by Pfizer in 2010 after a con-firmatory phase III trial revealed toxicity and efficacy concerns (10). A plethora of other new agents with distinct biologic activity have been studied in AML without successful incorporation into standard clinical practice. In 2015, greater than 18 000 patients are expected to be diagnosed with AML, with close to 11 000 deaths in the United States alone, and the incidence of AML is increasing (11,12). New therapies are urgently needed to improve treatment outcomes for these patients.
We retrospectively analyzed outcomes of patients with AML enrolled in National Cancer Institute (NCI) Cancer Therapy Evaluation Program (CTEP)–sponsored phase I clinical trials using the NCI Phase I Clinical Trials Database. Our hypothesis was that outcomes of AML patients enrolled in phase I studies are improving over time as newer and presumably more effec-tive agents are developed.
Methods
Study Design
A retrospective analysis was performed on NCI/CTEP-sponsored phase I clinical studies from 1986 to 2009. The database is main-tained by Theradex, an international contract research organi-zation, and is kept up to date by the investigators performing clinical trials and the CTEP of the NCI.
Participants
Sixty-five phase I studies were identified in leukemia, and 45 of these studies principally enrolled AML patients between 1986 to 2009 (Consort Diagram, Figure 1). Adults age 18 years and older with pathologic confirmation of AML were included in the analysis. Clinical and biologic features were analyzed prior to and after enrollment on study. All studies were conducted in accordance with the Declaration of Helsinki and were approved by the ethics committees of each of the participating centers. Informed consent was obtained from each participant for each of the studies reported.
Statistical Analysis
The primary objectives of this analysis were to estimate overall response rates (ORR: CR +partial remission) and all-cause early mortality, defined as death within 30 or 60 days of initiation of therapy, for the whole study and within specific subgroups of patients. CR with incomplete blood count recovery (CRi) was utilized as an ORR criterion after it was incorporated into the International Working Group Response Criteria for AML in 2003 (13). Differences in the rates of mortality and ORR over time were explored by categorizing time into five subgroups roughly divided into five-year increments: 1986 to 1990, 1991 to 1995,
1996 to 2000, 2001 to 2005, and 2006 to 2009. Changes in ORR and mortality rates across these year groups were estimated with multivariable logistic regression models adjusting for patient age, number of prior therapies, and white blood cell count (WBC) at the start of therapy. The overall effect of year group was tested using a Wald test of nested regression models. To determine if the differences in ORR and mortality by year groups was modi-fied by patient age, number of prior therapies, or single-agent vs combination therapy, the corresponding interactions terms were included in the models and retained in the final model if statistically significant (P < .05). The average change in the yearly number of patients enrolled was estimated with a simple linear regression model. Differences in patient characteristics were described by Fisher’s exact test with a two-sided P value.
Results
Patient Characteristics
A total of 711 AML patients in 45 phase I clinical trials conducted between 1986 and 2009 were included in this study (Figure 1). Three patients were excluded from the analysis because of insufficient information. No AML patients were enrolled in NCI-sponsored phase I clinical trials during the years 1989, 1994, 1999 and 2004; thus, each subgroup consisted of four years of patient enrollment. As demonstrated in Figure 2, there was a statistically significant increase in AML patients enrolling in phase I clinical trials over time (1986 to 1990: n = 61; 2006 to 2009: n = 256; slope = 2.3 patients/year, 95% confidence interval [CI] = 0.45 to 4.1, P = .03).
Table 1 displays the patient characteristics and clinical out-comes subdivided by dates of enrollment. The median age of the entire patient population was 60 years (range = 18–96), with 51.5% of patients age 60 years and older. The median age of patients that enrolled in phase I clinical trials increased over time from 47 years in 1986 to 1990 to 68 years in 2006 to 2009. The proportion of older patients (≥60 years) that enrolled in these studies increased substantially from 1986 to 1990 (18.0%) to 2006 to 2009 (63.7%). The median number of prior therapies was four (range = 0–29), with 63.3% having three or more prior therapies. However, the proportion of patients with three or more prior therapies decreased over time (1986 to 1990: 68.9%; 2006 to 2009: 54.3%). Accordingly, the most recent cohort (2006 to 2009) had the largest proportion of patients with 0 prior ther-apies (24.2%), reflecting the incorporation of newly diagnosed poor-risk and/or older age patient populations into phase I trials. Median white blood cell (WBC) count was 3600/mm3
(range = 100-342 800/mm3). Twenty-five out of 45 (55.6%) AML
phase I studies were identified as single-agent clinical trials. The proportion of patients enrolling in a single-agent phase I study (40.6% overall) appeared to decrease over time (1986 to 1990: 52.5%; 1991 to 1995: 67.3%; 1996 to 2000: 51.5%; 2001 to 2005: 43.1%; 2006 to 2009: 20.3%), with a reciprocal increase in enrollment to combination studies.
Treatment Outcomes: Response Rates
ar
ticle
ar
ticle
agent vs combination). As shown in Figure 3A, the ORRs for each subgroup were: 1986 to 1990: 8.9% (single agent: 0% vs combination: 19.2%), 1991 to 1995: 21.1% (single agent: 6.2% vs combination: 51.6%), 1996 to 2000: 7.0% (single agent: 1.5% vs combination: 12.5%), 2001 to 2005: 10.0% (single agent: 4.5%
vs combination: 14.5%), and 2006 to 2009: 22.6% (single agent: 10.2% vs combination: 25.8%).
Table 2 provides estimates of odds ratios for year sub-group and ORR. While there was a statistical difference in ORR between year groups, particularly an improvement in 2006
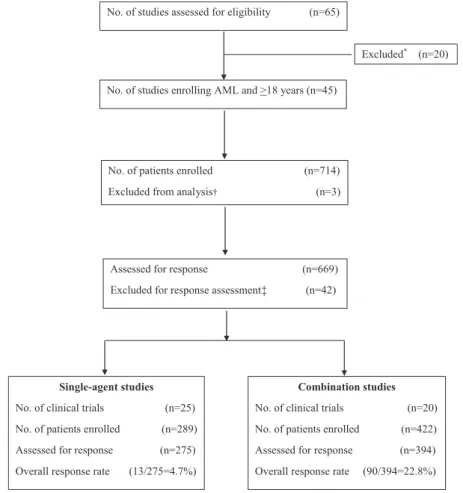
No. of studies assessed for eligibility (n=65)
No. of studies enrolling AML and >18 years (n=45)
Excluded* (n=20)
No. of patients enrolled (n=714)
Excluded from analysis† (n=3)
Assessed for response (n=669)
Excluded for response assessment‡ (n=42)
Single-agent studies
No. of clinical trials (n=25)
No. of patients enrolled (n=289)
Assessed for response (n=275) Overall response rate (13/275=4.7%)
Combination studies
No. of clinical trials (n=20)
No. of patients enrolled (n=422)
Assessed for response (n=394)
Overall response rate (90/394=22.8%)
Figure 1. Sixty-five Cancer Therapy Evaluation Program–sponsored clinical studies enrolled leukemia patients from 1986–2009. Acute myeloid leukemia (AML) patients age 18 years and older enrolled in 45 of these studies. *Patients younger than age 18 years and/or with a diagnosis other than AML were excluded. †Three patients were excluded from analysis given insufficient clinical information. ‡Forty-two patients did not have a response assessment documented and were thus excluded from this analysis. AML = acute myeloid leukemia.
1986−1990 1991−1995 1996−2000 2001−2005 2006−2009
0 27 63 99 135 171 207 243 279 315 351 387 423 459 495 531 567 603 639 675 711
N=61
N=159
N=295
N=455
N=711
Within-year interval Cumulative
0% 4% 9% 14% 19% 24% 29% 34% 39% 44% 49% 54% 59% 65% 70% 75% 80% 85% 90% 95% 100% Proportion of total patients
No. of AML patients enrolled
ar
ticle
ar
ticle
to 2009 compared with earlier years (P < .001), the difference seems to be largely driven by increased use of combination therapies. When comparing the overall effect of year groups on the probability of response (Supplementary Table 1, avail-able online), there was a statistically significant improvement of ORRs over time in patients younger than age 60 years (P = .01) and a nonsignificant trend of improved ORRs in patients age 60 years and older (P = .10). Notably, the ORR for those younger than age 60 years and age 60 years and older in 2006 to 2009 was 26.4% and 20.4%, respectively. A test for interaction did not reveal any statistical differences in ORRs between age and year group (P = .58). Comparison of ORRs stratified by number of prior therapies (0 vs 1–2 vs ≥3) revealed no differences in ORR among those receiving zero or one to two prior therapies but statisti-cally significant improvement over time in patients with three or more prior therapies (P = .001). Finally, there was also a sta-tistically significant improvement in ORR over time in patients treated on combination studies (P = .03) but not on single-agent trials (P = .43). Test for interaction did not reveal any statistical
differences in ORRs between type of study (ie, single agent vs combination) and year group (P = .51).
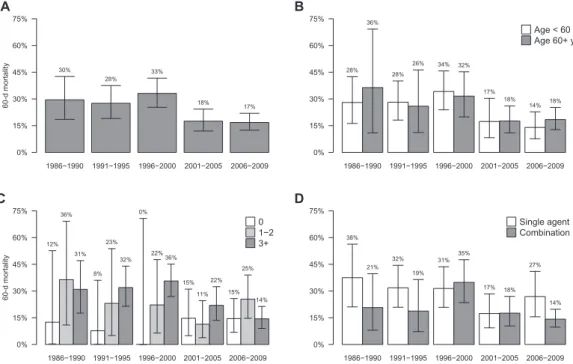
Treatment Outcomes: Early Mortality
All-cause early mortality was subdivided into 30-day and 60-day mortality rates. The 30-day and 60-day mortality rates for the entire cohort were 11.1% (single agent: 13.8% vs combination: 9.2%) and 22.6% (single agent: 28.0% vs combi-nation: 19.0%), respectively. Thirty-day mortality did not sta-tistically significantly change over time (1986 to 1990: 11.5% vs 2006 to 2009: 8.6%), whereas 60-day mortality rates were statistically significantly higher in earlier years compared with 2006 to 2009 (P = .009). Given the apparent improve-ment in 60-day mortality rates (when compared with 30-day mortality), we analyzed 60-day mortality rates as a function of age, number of prior therapies, and type of clinical study.
Figure 4 depicts the 60-day mortality rates among each sub-group for (A) the whole cohort and stratified by (B) age, (C)
Table 1. Patient characteristics
Patient characteristics All patients 1986–1990 1991–1995 1996–2000 2001–2005 2006–2009
No. patients enrolled
No. active studies/no. new studies initiated Age, median (range), y
711 45/-60 (18–96)
61 11/-47 (18–74)
98 14/10 50 (18–79)
136 11/9 57 (18–76)
160 14/11 65 (20–96)
256 11/4 68 (20–93)
<60, No. (%) 345 (48.5) 50 (81.9) 71 (72.4) 79 (58.1) 52 (32.5) 93 (36.3)
≥60, No. (%) 366 (51.5) 11 (18.0) 27 (27.6) 57 (41.9) 108 (67.5) 163 (63.7)
No. prior therapies, median (range, %) 4 (0–29) 4 (0–13) 4 (0–17) 4 (0–29) 3 (0–20) 3 (0–23)
0, No. (%) 120 (16.9) 8 (13.1) 13 (13.3) 3 (2.2) 34 (21.2) 62 (24.2)
1–2, No. (%) 141 (19.8) 11 (18.0) 13 (13.3) 18 (13.2) 44 (27.5) 55 (21.5)
≥3, No. (%) 450 (63.3) 42 (68.9) 72 (73.5) 115 (84.6) 82 (51.3) 139 (54.3)
WBC*, median (range) 3.6 (0.1–342.8) 5.8 (0.1–161.5) 3.6 (0.1–342.8) 3.3 (0.1–99.8) 3.3 (0.2–102) 3.5 (0.2–115.3)
Single agent studies, No. (%) 289 (40.6) 32 (52.5) 66 (67.3) 70 (51.5) 69 (43.1) 52 (20.3)
* White blood cell count reported as k/mm3. WBC = white blood cell.
1986−1990 1991−1995 1996−2000 2001−2005 2006−2009
Overall response rate
Overall response rat
e
9% 21%
7% 10%
23%
0% 15% 30% 45% 60% 75%
A
1986−1990 1991−1995 1996−2000 2001−2005 2006−2009 11%
0% 26%
8% 9%
4% 8% 11%
26%
20%
0% 15% 30% 45% 60% 75%
Age < 60 y Age 60+ y
B
1986−1990 1991−1995 1996−2000 2001−2005 2006−2009 14%
9%
8% 38%
17%
19%
0% 12%
6% 16%
12%
6% 21%23%23%
0% 15% 30% 45% 60% 75%
0 1−2 3+
C
1986−1990 1991−1995 1996−2000 2001−2005 2006−2009 0%
19%
6% 52%
2% 12%
4% 14% 10%
26%
0% 15% 30% 45% 60% 75%
Single agent Combination
D
ar
ticle
ar
ticle
number of prior therapies, and (D) type of study (ie, single agent vs combination).
Table 2 provides estimates of odds ratios for year subgroup and 60-day mortality rates. There was a statistically significant improvement in 60-day mortality rates over time (P = .009). When comparing 60-day mortality rates for patient subgroups by year group (Supplementary Table 1, available online), there was a statistically significant improvement in 60-day mortality rates in patients younger than age 60 years (P = .004) but not in patients age 60 years and older (P = .20). However, a test for interaction did not reveal any statistical differences in 60-day mortality rates between age and year group (P = .31). Similar to ORRs, 60-day mortality rates statistically significantly improved in heavily pretreated patients (ie, ≥3 prior therapies, P < .001) but not in patients with zero or one to two prior therapies. Finally, there was an improvement of 60-day mortality rates in the 2006 to 2009 subgroup compared with earlier years in patients treated on combination studies (P = .08). A test for interaction showed no significant differences between year groups and type of study on the probability of 60-day mortality (P = .76).
Discussion
The persistently poor outcome of AML patients underscores the need for the development and implementation of novel
agents. This retrospective analysis of CTEP-sponsored phase I clinical trials demonstrates an increase in the overall enroll-ment of AML patients on phase I clinical trials over the last 23 years. The concomitant increase in combination stud-ies and inclusion of patients with newly diagnosed AML has been accompanied by an improvement in ORRs and all-cause early mortality rates, with a promising ORR of 22.6% from 2006 to 2009. ORRs were shown to be improving particularly in younger patients (ie, <60 years) and heavily pretreated patients. Although causes of death were not identified in this analysis, early mortality improvements may be partly because of the advances in supportive care and antimicrobial use, rather than a superior safety profile of novel antileukemic agents.
The American Society of Clinical Oncology (ASCO) Policy Statement Update by Weber et al. (14) recently commented on the critical importance of phase I clinical trials in cancer. The primary objective of phase I clinical trials is to define the safety and tolerability of a new drug or treatment regimen and to describe the dose-limiting toxicities observed during dose determination. The majority of phase I clinical trials also evaluate efficacy as a secondary endpoint. Once a tolerable dose and schedule are defined, clinical studies evaluating new oncology agents proceed only if preliminary antitumor activ-ity is demonstrated. Thus, evaluation of response rate as a
Table 2. Odds ratios for overall response rates and 60-day mortality by year subgroup*
Patient outcome
1984–1990 vs 2006–2009 OR (95% CI)
1991–1995 vs 2006–2009 OR (95% CI)
1996–2000 vs 2006–2009 OR (95% CI)
2001–2005 vs 2006–2009
OR (95% CI) P†
Overall response rate 0.35 (0.12 to 1) 0.77 (0.41 to 1.45) 0.25 (0.12 to 0.55) 0.35 (0.19 to 0.66) <.001
60-d mortality 1.96 (0.92 to 4.15) 2.12 (1.16 to 3.87) 2.40 (1.42 to 4.07) 1.19 (0.69 to 2.04) .009
* Odds ratios (95% confidence intervals) from multivariable logistic regression models for the association between categories of time (year on study) and overall re-sponse rate adjusted for age (continuous), number of prior therapies, and white blood cell count. Year was grouped and compared with the reference group of studies in 2006–2009. CI = confidence interval; OR = odds ratio.
† P values for Wald tests from nested models for the overall effect of year groups on the probability of response or 60-day mortality.
1986−1990 1991−1995 1996−2000 2001−2005 2006−2009
60-d mortalit
y
30% 28%
33%
18% 17%
0% 15% 30% 45% 60% 75%
A
1986−1990 1991−1995 1996−2000 2001−2005 2006−2009 28%
36%
28%
26% 34% 32%
17% 18%
14% 18%
0% 15% 30% 45% 60% 75%
Age < 60 y Age 60+ y
B
1986−1990 1991−1995 1996−2000 2001−2005 2006−2009
60-d mortalit
y
12% 36%
31%
8% 23%
32% 0%
22%36%
15% 11%
22% 15%
25%
14%
0% 15% 30% 45% 60% 75%
0 1−2 3+
C
1986−1990 1991−1995 1996−2000 2001−2005 2006−2009 38%
21% 32%
19%
31% 35%
17% 18%
27%
14%
0% 15% 30% 45% 60% 75%
Single agent Combination
D
ar
ticle
ar
ticle
secondary endpoint is an important indicator of success in the design of phase I clinical studies. In fact, pembrolizumab and the combination of dabrafenib and trametinib were recently FDA approved for the treatment of melanoma based on the activity seen in the expansion cohorts of phase I trials (15,16).
Response rates are generally low in phase I clinical trials for all cancer subtypes. Horstmann et al. analyzed 460 phase I clinical trials involving 11 935 oncology patients from 1991 to 2002 and reported a stable ORR over time of 10.6%, with an ORR of less than 5% in single-agent phase I clinical studies (17). Estey et al. reported an ORR of 6.4% in leukemia patients enrolling in phase I studies sponsored by the NCI/CTEP from 1974 to 1982 (18). The ORR in AML patients seen on this study (15.4%) appears at least similar to these reports with a 4.7% ORR in single-agent studies vs 22.8% ORR in combination studies. The 2006 to 2009 subgroup in our evaluation enrolled the largest number of patients and had the highest ORR (22.6%) when compared with the other subgroups. Possible explanations for the promising ORR in the most recent cohort are the increased proportion of patients enrolling in combi-nation clinical studies (79.7%) compared with single agents and the inclusion of newly diagnosed and/or non–heavily pre-treated patients.
Over the last five years, there have been 23 new therapeu-tic agents approved by the FDA for hematologic malignancies (chronic myeloid leukemia, n = 5; chronic lymphocytic leuke-mia, n = 5; lymphomas, n = 5; acute lymphoblastic leukeleuke-mia, n = 4; multiple myeloma, n = 3; myelofibrosis/polycythemia vera, n = 1). In contrast, no new agents have been approved by the FDA for non-APL AML since 1990, with the exception of GO, which received accelerated approval in 2000 but was withdrawn from the market in 2010 because of safety and effi-cacy concerns. Limitations in AML drug development include: 1) lack of consistent and standard treatment approaches in AML, which confounds the analyses of OS and disease-free survival endpoints, 2) inherent molecular and clinical heter-ogeneity of patients with AML, 3) variability in the monitor-ing and treatment of minimal residual disease, and 4) initial evaluation of new agents restricted to patients with chemo-resistant/refractory disease, posing heightened challenges for establishing markers of efficacy in an extremely poor-risk patient population (19,20). Designing and implementing clini-cal trials in specific subpopulations of AML patients with con-comitant pharmacodynamic studies to identify biomarkers of drug sensitivity and response may help to circumvent some of these shortcomings.
Given the underlying complexity in AML pathogenesis and the inherent heterogeneity of the AML population as a whole, sustained single-agent activity is unlikely. Therefore, the investigation of new agents in combination with mecha-nistically complementary agents should be evaluated early in the drug development process. Precision-targeted approaches to identify patients for specific therapeutic interventions and immunotherapeutic strategies show tremendous promise in cancer. Such approaches should be evaluated early to iden-tify effective combinatorial approaches and to accelerate drug approval in AML. Newly diagnosed poor-risk AML patients, particularly in the elderly population, should be included in early-phase clinical trials to increase the probability of identifying antileukemic activity in a non–heavily pretreated subgroup.
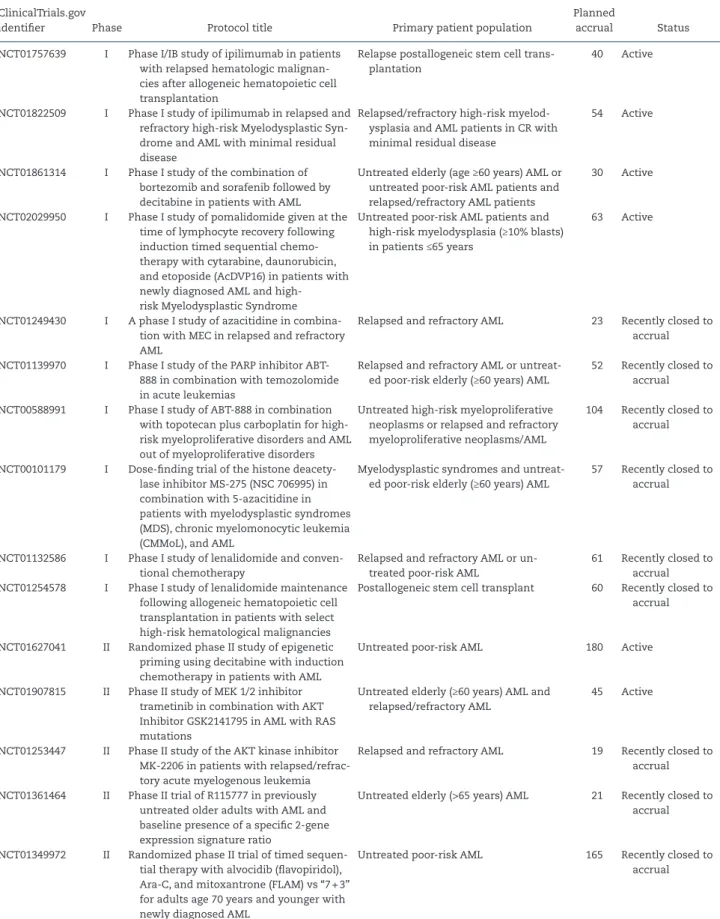
There are currently six active CTEP-sponsored clinical studies in AML patients (Table 3). An additional six phase I and three phase II trials in AML have completed accrual within the past two years. The active studies have a total planned enrollment of 412 patients. Four studies involve complementary combinatorial agents in newly diagnosed untreated patients, while two phase Ib studies examine single-agent ipilimumab in AML patients in CR and relapsed hematologic malignancies post allogeneic stem cell trans-plantation, respectively.
This is the first comprehensive study to analyze and evalu-ate outcomes of patients with AML treevalu-ated on phase I stud-ies, to our knowledge. This analysis was limited to phase I studies in order to comprehensively assess whether out-comes are being improved early in the drug development process. This provides a vantage point to evaluate whether the appropriate patient populations and disease settings are being addressed early in the investigation of novel agents and the changes over time. Nonetheless, our evaluation of AML patients in early-phase clinical trials has limitations that may affect the generalizability of these observations. Given that this analysis focused only on phase I clinical studies, it would be important to compare these results to later-phase clini-cal trials (ie, phase II and III) to determine whether the same trends and changes are occurring over time. Moreover, these findings relate exclusively to NCI/CTEP-sponsored phase I tri-als; these results may be disparate when analyzing industry-sponsored or cooperative group studies in AML. Additionally, a limited number of clinical variables were available for our analysis. We did not have access to cytogenetic or molecular abnormalities, types of prior therapies, performance status, or disease-free survival. Secondary AML (treatment related AML or AML preexisting from an antecedent hematologic dis-order), a subtype of AML with an extremely poor prognosis, was not predefined in our database. It is likely that second-ary AML comprised a substantial proportion of the patient population enrolled in these studies, particularly in the most recent cohorts, as newly diagnosed poor-risk AML patients were increasingly included in the eligibility of phase I stud-ies. Comparing outcomes for de novo AML vs secondary AML would be important in the evaluation of any differences in ORRs and mortality rates on phase I clinical trials in these subsets of patients. Despite these limitations, our findings encompass results from 711 patients enrolled in 45 phase I studies over a 23-year time period. These findings, at least in part, reflect the general trends seen in AML accrual in the United States and clinical outcomes on AML phase I studies over time.
ar
ticle
ar
ticle
Table 3. Selected active and recently completed CTEP-sponsored phase I/II studies in AML*
ClinicalTrials.gov
identifier Phase Protocol title Primary patient population
Planned
accrual Status
NCT01757639 I Phase I/IB study of ipilimumab in patients
with relapsed hematologic malignan-cies after allogeneic hematopoietic cell transplantation
Relapse postallogeneic stem cell trans-plantation
40 Active
NCT01822509 I Phase I study of ipilimumab in relapsed and
refractory high-risk Myelodysplastic Syn-drome and AML with minimal residual disease
Relapsed/refractory high-risk myelod-ysplasia and AML patients in CR with minimal residual disease
54 Active
NCT01861314 I Phase I study of the combination of
bortezomib and sorafenib followed by decitabine in patients with AML
Untreated elderly (age ≥60 years) AML or untreated poor-risk AML patients and relapsed/refractory AML patients
30 Active
NCT02029950 I Phase I study of pomalidomide given at the
time of lymphocyte recovery following induction timed sequential chemo-therapy with cytarabine, daunorubicin, and etoposide (AcDVP16) in patients with newly diagnosed AML and high- risk Myelodysplastic Syndrome
Untreated poor-risk AML patients and high-risk myelodysplasia (≥10% blasts) in patients ≤65 years
63 Active
NCT01249430 I A phase I study of azacitidine in
combina-tion with MEC in relapsed and refractory AML
Relapsed and refractory AML 23 Recently closed to
accrual
NCT01139970 I Phase I study of the PARP inhibitor ABT-
888 in combination with temozolomide in acute leukemias
Relapsed and refractory AML or untreat-ed poor-risk elderly (≥60 years) AML
52 Recently closed to
accrual
NCT00588991 I Phase I study of ABT-888 in combination
with topotecan plus carboplatin for high-risk myeloproliferative disorders and AML out of myeloproliferative disorders
Untreated high-risk myeloproliferative neoplasms or relapsed and refractory myeloproliferative neoplasms/AML
104 Recently closed to
accrual
NCT00101179 I Dose-finding trial of the histone
deacety-lase inhibitor MS-275 (NSC 706995) in combination with 5-azacitidine in patients with myelodysplastic syndromes (MDS), chronic myelomonocytic leukemia (CMMoL), and AML
Myelodysplastic syndromes and untreat-ed poor-risk elderly (≥60 years) AML
57 Recently closed to
accrual
NCT01132586 I Phase I study of lenalidomide and
conven-tional chemotherapy
Relapsed and refractory AML or un-treated poor-risk AML
61 Recently closed to
accrual
NCT01254578 I Phase I study of lenalidomide maintenance
following allogeneic hematopoietic cell transplantation in patients with select high-risk hematological malignancies
Postallogeneic stem cell transplant 60 Recently closed to
accrual
NCT01627041 II Randomized phase II study of epigenetic
priming using decitabine with induction chemotherapy in patients with AML
Untreated poor-risk AML 180 Active
NCT01907815 II Phase II study of MEK 1/2 inhibitor
trametinib in combination with AKT Inhibitor GSK2141795 in AML with RAS mutations
Untreated elderly (≥60 years) AML and relapsed/refractory AML
45 Active
NCT01253447 II Phase II study of the AKT kinase inhibitor
MK-2206 in patients with relapsed/refrac-tory acute myelogenous leukemia
Relapsed and refractory AML 19 Recently closed to
accrual
NCT01361464 II Phase II trial of R115777 in previously
untreated older adults with AML and baseline presence of a specific 2-gene expression signature ratio
Untreated elderly (>65 years) AML 21 Recently closed to
accrual
NCT01349972 II Randomized phase II trial of timed
sequen-tial therapy with alvocidib (flavopiridol), Ara-C, and mitoxantrone (FLAM) vs “7 + 3” for adults age 70 years and younger with newly diagnosed AML
Untreated poor-risk AML 165 Recently closed to
accrual
ar
ticle
ar
ticle
Funding
This work was supported by the National Cancer Institute. JFZ received a 2013 Conquer Cancer Foundation Young Investigator Award, in memory of Dr. John R. Durant, and is a 2014 to 2017 Leukemia and Lymphoma Society Special Fellow in Clinical Research.
Notes
The study funder had no role in the design or conduct of the study; collection, management, analysis, or interpretation of the data; preparation, review or approval of the manuscript; nor decision to submit the manuscript for publication.
The authors declare that GS, SPI, and PH are employed by the National Cancer Institute. The authors declare that there are no additional conflicts of interest regarding the present study.
The authors would like to thank the researchers and inves-tigators, who were responsible for conducting each of the trials reported here, as well as the patients and their families, who contributed significant information. We would also like to thank the staff at Theradex for providing the unique datasets used for this analysis.
This study was presented in abstract form as a poster pres-entation at the 2014 American Society of Hematology (ASH) Conference in San Francisco, CA on December 7, 2014.
Author Contributions: conception and design: JFZ and PH; acquisition, analysis, or interpretation of data: JFZ, JEK, ALB, MCF, ECD, GS, SPI, PH; drafting of the manuscript: JFZ; review and/or revision of manuscript: JEK, ALB, MCF, ECD, GS, SPI, PH; statistical analysis: ALB.
References
1. Rai KR, Holland JF, Glidewell OJ, et al. Treatment of acute myelocytic leuke-mia: a study by cancer and leukemia group B. Blood. 1981;58(6):1203–1212. 2. Yates J, Glidewell O, Wiernik P, et al. Cytosine arabinoside with daunorubicin
or adriamycin for therapy of acute myelocytic leukemia: a CALGB study.
Blood. 1982;60(2):454–462.
3. Preisler H, Davis RB, Kirshner J, et al. Comparison of three remission induc-tion regimens and two postinducinduc-tion strategies for the treatment of acute nonlymphocytic leukemia: a cancer and leukemia group B study. Blood. 1987;69(5):1441–1449.
4. Fernandez HF, Sun Z, Yao X, et al. Anthracycline dose intensification in acute myeloid leukemia. N Engl J Med. 2009;361(13):1249–1259.
5. Appelbaum FR, Gundacker H, Head DR, et al. Age and acute myeloid leuke-mia. Blood. 2006;107(9):3481–3485.
6. Sant M, Minicozzi P, Mounier M, et al. Survival for haematological malignan-cies in Europe between 1997 and 2008 by region and age: results of EURO-CARE-5, a population-based study. Lancet Oncol. 2014;15(9):931–942. 7. Tefferi A, Letendre L. Going beyond 7 + 3 regimens in the treatment of adult
acute myeloid leukemia. J Clin Oncol. 2012;30(20):2425–2428.
8. Sievers EL, Larson RA, Stadtmauer EA, et al. Efficacy and safety of gemtu-zumab ozogamicin in patients with CD33-positive acute myeloid leukemia in first relapse. J Clin Oncol. 2001;19(13):3244–3254.
9. Rowe JM, Lowenberg B. Gemtuzumab ozogamicin in acute myeloid leuke-mia: a remarkable saga about an active drug. Blood. 2013;121(24):4838–4841. 10. Petersdorf SH, Kopecky KJ, Slovak M, et al. A phase III study of gemtuzumab
ozogamicin during induction and postconsolidation therapy in younger patients with acute myeloid leukemia. Blood. 2013;121(24):4854–4860. 11. Siegel R, Ma J, Zou Z, Jemal A. Cancer statistics, 2014. CA Cancer J Clin.
2014;64(1):9–29.
12. Emadi A, Karp JE. The state of the union on treatment of acute myeloid leu-kemia. Leuk Lymphoma. 2014;55(11):2423–2425.
13. Cheson BD, Bennett JM, Kopecky KJ, et al. Revised recommendations of the International Working Group for Diagnosis, Standardization of Response Criteria, Treatment Outcomes, and Reporting Standards for Therapeutic Tri-als in Acute Myeloid Leukemia. J Clin Oncol. 2003;21(24):4642–4649. 14. Weber JS, Levit LA, Adamson PC, et al. American Society of Clinical
Oncol-ogy Policy Statement Update: The Critical Role of Phase I Trials in Cancer Research and Treatment. J Clin Oncol. 2015;33(3):278–284.
15. Hamid O, Robert C, Daud A, et al. Safety and tumor responses with lambroli-zumab (anti-PD-1) in melanoma. N Engl J Med. 2013;369(2):134–144. 16. Flaherty KT, Infante JR, Daud A, et al. Combined BRAF and MEK inhibition in
melanoma with BRAF V600 mutations. N Engl J Med. 2012;367(18):1694–1703. 17. Horstmann E, McCabe MS, Grochow L, et al. Risks and benefits of phase I
oncology trials, 1991 through 2002. N Engl J Med. 2005;352(9):895–904. 18. Estey E, Hoth D, Simon R, Marsoni S, Leyland-Jones B, Wittes R.
Therapeu-tic response in phase I trials of antineoplasTherapeu-tic agents. Cancer Treat Rep. 1986;70(9):1105–1115.
19. Walter RB, Appelbaum FR, Tallman MS, Weiss NS, Larson RA, Estey EH. Short-comings in the clinical evaluation of new drugs: acute myeloid leukemia as paradigm. Blood. 2010;116(14):2420–2428.
20. Estey E, Levine RL, Lowenberg B. Current challenges in clinical develop-ment of “targeted therapies”: the case of acute myeloid leukemia. Blood. 2015;125(16):2461–2466.