UC Irvine
UC Irvine Previously Published Works
Title
Modeling age-related changes in muscle-tendon dynamics during cyclical contractions in the rat gastrocnemius
Permalink
https://escholarship.org/uc/item/2869b99z
Journal
JOURNAL OF APPLIED PHYSIOLOGY, 121(4)
ISSN
8750-7587
Authors
Danos, N Holt, NC Sawicki, GS et al.
Publication Date
2016-10-01
DOI
10.1152/japplphysiol.00396.2016
Modeling age-related changes in muscle-tendon dynamics during
1
cyclical contractions in the rat gastrocnemius
2
Nicole Danos*1,2, Natalie Holt1, Gregory S. Sawicki3 and Emanuel Azizi1
3
4
1Ecology and Evolutionary Biology, University of California Irvine, 321 Steinhaus
5
Hall, Irvine CA 92697
6
2 current address: Biology department, Tufts University, 200 Boston Ave., Suite
7
4700, Medford MA 02155
8
3Joint Department of Biomedical Engineering, North Carolina State University
9
and University of North Carolina at Chapel Hill, Raleigh, NC 27695
10
11
12
* [email protected] (corresponding author)
13
14
15
16
Running head: Gastrocnemius MTU dynamics with aging
17
18
Articles in PresS. J Appl Physiol (August 4, 2016). doi:10.1152/japplphysiol.00396.2016
by 10.220.32.247 on March 2, 2017
http://jap.physiology.org/
Abstract
19 20
Efficient muscle-tendon performance during cyclical tasks is dependent on both
21
active and passive mechanical tissue properties. Here we examine whether
age-22
related changes in the properties of muscle-tendon units (MTUs) compromise
23
their ability to do work and utilize elastic energy storage. We empirically
24
quantified passive and active properties of the medial gastrocnemius muscle and
25
material properties of the Achilles tendon in young (~6 mos) and old (~32 mos)
26
rats. We then used these properties in computer simulations of a Hill-type muscle
27
model operating in series with a Hookean spring. The modeled MTU was driven
28
through sinusoidal length changes and activated at a phase that optimized
29
muscle-tendon tuning to assess the relative contributions of active and passive
30
elements to the force and work in each cycle. In physiologically realistic
31
simulations where young and old MTUs started at similar passive forces and
32
developed similar active forces, the capacity of old MTUs to store elastic energy
33
and produce positive work was compromised. These results suggest that the
34
observed increase in the metabolic cost of locomotion with aging may be in part
35
due to the recruitment of additional muscles to compensate for the reduced work
36
at the primary MTU. Furthermore, the age-related increases in passive stiffness
37
coupled with a reduced active force capacity in the muscle can lead to shifts in
38
the force-length and force-velocity operating range that may significantly impact
39
mechanical and metabolic performance. Our study emphasizes the importance of
40
the interplay between muscle and tendon mechanical properties in shaping MTU
41
performance during cyclical contractions.
42
by 10.220.32.247 on March 2, 2017
http://jap.physiology.org/
43
New & Noteworthy: The age-related increase in muscle and tendon tissue
44
stiffness and reduction in active force capacity of the muscle compromise elastic
45
energy utilization and positive work production, which may require the
46
recruitment of additional muscle volume potentially contributing to the increased
47
cost of locomotion observed in older individuals.
48
49
keywords: aging, elastic energy, cost of locomotion, fibrosis, ankle joint work
50
51
by 10.220.32.247 on March 2, 2017
http://jap.physiology.org/
52 53
1 INTRODUCTION
54
55
Locomotion is more energetically costly in older individuals. A comparison
56
of healthy young men (~27yo) and healthy older men (~74yo) walking at varying
57
speeds found that the metabolic cost of walking increased by an average of 31%
58
in older men (39). Similarly, during running, older individuals have decreased
59
overall efficiency, requiring muscle to consume significantly more metabolic
60
energy per unit mechanical work with each step (15). While this may be partially
61
due to a decreased efficiency of muscle contraction (16), a reduction in effective
62
energy storage could also contribute to an increase in the metabolic cost of
63
locomotion.
64
The dynamic function of tendon is integral to reducing the metabolic cost
65
of locomotion. These energetic savings may occur by changing where muscles
66
operate on their force-length and force-velocity curves (35), by reducing muscle
67
work (6) or by reducing active muscle volume (24). Regardless of the mechanism
68
by which tendons reduce the metabolic cost of muscle contraction, changes in
69
the active and passive mechanical properties of muscles and tendons could
70
reduce the ability of a muscle-tendon unit to effectively use these cost saving
71
mechanisms.
72
The mechanical properties of tendon are critical in determining tendon
73
dynamics and function (8). However, there is little consensus on how aging
74
affects tendon properties. Changes in modulus and cross sectional area can alter
75
by 10.220.32.247 on March 2, 2017
http://jap.physiology.org/
cyclical tasks such as walking and running. Additionally, changes in the tendon
77
stiffness will lead to changes in the natural frequency of muscle-tendon units and
78
limbs, potentially compromising the effective use of resonance during such tasks
79
(56). Increases in tendon cross-sectional area (37, 54) and collagen cross-linking
80
due to an accumulation of advanced glycation end products (32), have been
81
demonstrated with age. These changes are likely to increase tendon stiffness
82
(48). The majority of experimental data comparing young and old connective
83
tissues in various animal systems support this and suggest an increase in elastic
84
modulus with age (1,13, 14, 18, 21, 54). Some studies, however, especially in
85
vivo studies on humans, have shown a decrease in the Young’s modulus of
86
tendons (9, 29, 30, 33, 43, 44, 59).The lack of consensus in the literature
87
suggests that the effect of aging on the material properties of tendon may vary
88
based on preparation, the tendon being studied, the study species and the age
89
cohorts being compared. This lack of consensus has made it difficult to relate
90
changes in tendon properties to the metabolic cost of movement.
91
Age-related reduction in the force capacity of older muscles is well
92
established. A reduction in maximum isometric force can be as high as 2% per
93
year (55) and is often associated with dimensional changes in the muscles and
94
an overall loss of muscle mass due to atrophy (60). However, a reduction in
95
muscle mass or cross-sectional area (CSA) does not fully explain the decline in
96
force output in the elderly. Maximum isometric stress (force/CSA) also decreases
97
significantly with age. This has been attributed to age-related increases in
non-98
contractile tissues such as fat and collagen (21, 31, 47), changes in muscle
99
by 10.220.32.247 on March 2, 2017
http://jap.physiology.org/
architecture (42, 57), and increased stiffness of intramuscular connective tissues
100
(31). The age related reduction in muscle force can decrease the ability of a
101
muscle to stretch its external tendon, and compromise the storage and return of
102
elastic energy.
103
The purpose of this study was to examine the age-related changes in
104
muscle-tendon unit function. We use a well-established animal model of aging,
105
the F344xBN rat (5,25). The use of an animal model provides a more controlled
106
system than the cross sectional studies of humans, which are often fraught with
107
significant inter-individual variation and a more practical system than longitudinal
108
studies of human subjects that can extend over several decades. In addition, the
109
use of an animal model allows us to study both isolated components of the
110
musculoskeletal system as well as the integrated and intact system in order to
111
better understand the specific structures responsible for functional decrements.
112
Finally, the rat strain used in the study (developed by the National Institute of
113
Aging) is well suited for studies of healthy aging without the confounding
114
pathologies common in other model systems. In this study we first measured the
115
contractile, morphological and mechanical properties of the medial
116
gastrocnemius muscle and tendon. We then used these experimental variables
117
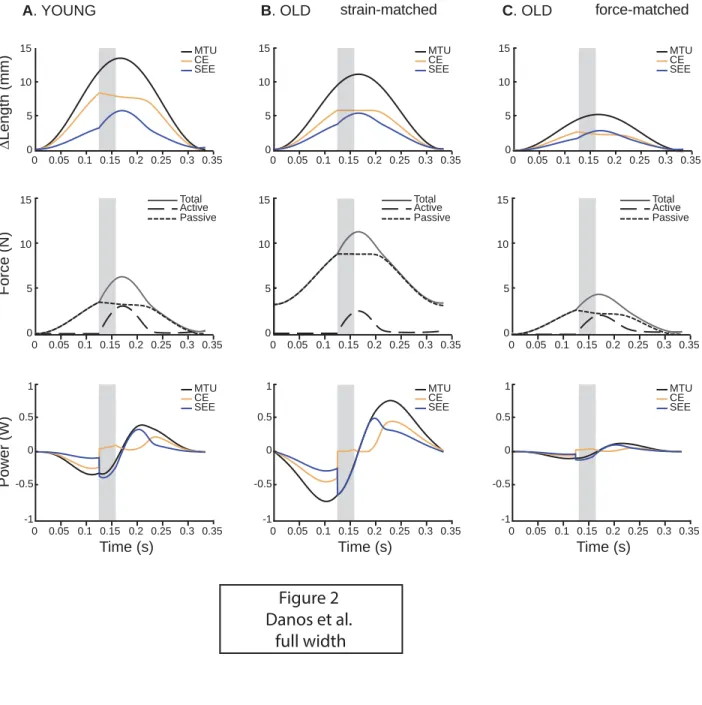
as inputs to a muscle-tendon model (Hill-type model operating with an in-series
118
spring) to simulate cyclic contractions (i.e., work loops) and test: 1) whether old
119
MTU’s can perform as much mechanical work as young ones, and 2) whether
120
elastic energy storage and return is compromised in old MTUs as a result of
non-121
optimal interaction between active and passive MTU properties.
122
by 10.220.32.247 on March 2, 2017
http://jap.physiology.org/
123
2 MATERIALS AND METHODS
124
2.1 Experimentally measured muscle-tendon properties
125
Active and passive muscle-tendon unit properties (Table 1) were
126
measured in situ in young (n=8, age 5-9 months, body mass 362±32 g) and old
127
(n=8, age 33-34 months, body mass 489±19 g) male Brown Norway x F344 F1
128
hybrid rats, Rattus norwegicus, from the National Institutes of Aging (F344BN;
129
National Institute on Aging, Bethesda, MD). The animal ages were chosen to
130
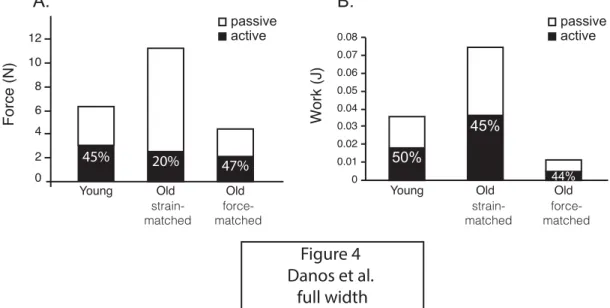
ensure that the effect we documented was one of senescence and not
131
developmental maturation (41). The medial gastrocnemius (MG) was identified
132
as a good muscle model because of its size and accessibility, and its significant
133
contribution to ankle power. All experimental procedures involving animals were
134
approved by the Institutional Animal Care and Use Committee at the University of
135
California, Irvine.
136
137
The passive and active force-length properties of the intact muscle were
138
first determined in situ as previously described in (23). The rats were
139
anaesthetized using 2% isoflurane, maintained on a closed system anesthesia
140
machine (Parkland Scientific, Coral Springs, FL) and placed, prone, on a heat
141
mat. The sciatic nerve was exposed via a small incision running from the caudal
142
midline of the hind limb towards the base of the tail. A nerve cuff containing a
143
stimulus and a ground electrode was placed around the nerve and the nerve was
144
severed proximally. The area around the electrode was filled with warmed
145
by 10.220.32.247 on March 2, 2017
http://jap.physiology.org/
mineral oil and sutured closed. The Achilles tendon was then exposed and all
146
tendons, except that of the gastrocnemius, were severed. The calcaneus was cut
147
leaving a small amount of bone attached to the MG tendon. This bone and
148
tendon were secured in a custom-made clamp, as close to the end of the muscle
149
fibers as possible. An incision was made on the lateral aspect of the thigh and
150
the femur clamped into a stereotaxic frame. The distal clamp was connected to
151
the lever arm of an ergometer (310 B-LR, Aurora Scientific Inc., Ontario, Canada)
152
using steel cable (10 cm). Care was taken to minimize the compliance of the
153
setup. The muscle was wrapped in saline-moistened gauze and Saran wrap and
154
muscle temperature was maintained at 37 °C using a heat lamp.
155
Isometric, fixed end, twitch contractions were elicited, by applying a single
156
stimulus pulse to the sciatic nerve, at a range of lengths to produce a twich
force-157
length curve (Grass S48 stimulator, Grass medical instruments, Quincy, MA,
158
USA). This allowed us to quantify the optimal length of the muscle. Force and
159
ergometer position data were collected at 1000 Hz using a National Instruments
160
AD board (NI USB-6212) and recorded using Igor Pro 6.31 software
161
(Wavemetrics Inc., Lake Oswego, OR, USA). A single tetanic contraction was
162
elicited at the optimal muscle length (L0 muscle, Table 1) by applying a train of 0.2
163
ms square wave pulses at 100 Hz for 400 ms (Fmax, Table 1). Because the lateral
164
gastrocnemius (LG) was still attached to the MG and was also stimulated by the
165
sciatic nerve, force values (Fmax) were corrected based on the relative size of the
166
two muscles.
167
by 10.220.32.247 on March 2, 2017
http://jap.physiology.org/
After-loaded isotonic tetanic contractions were used to determine the
168
force-velocity relationship of the muscle with the same stimulation protocol used
169
for isometric tetanic contractions (23). Force was allowed to rise to a defined
170
level (10, 30, 50, 70 or 90% of Fmax) and the muscle allowed to shorten to
171
maintain a constant force. The order of force levels was randomized and a 5
172
minute rest period allowed for recovery between contractions. Another isometric
173
contraction was performed after the series of isometric contractions to monitor
174
muscle fatigue and health; muscle force never fell below 90% of its original value.
175
Vmax was obtained by fitting the Hill equation to the pooled data for each age
176
group. Activation (tact) and deactivation (tdeact) time constants were defined based
177
on activation equations from (61) and were chosen to match the force profile of a
178
representative tetanus for each age group.
179
Passive stiffness of the muscle (kmuscle, Table 1) was measured during a
180
passive stretch and calculated from the slope of a linear fit to passive force vs.
181
muscle strain (relative to L0 muscle) in Igor Pro 6.31 (Wavemetrics Inc., OR, USA)
182
(Fig. 1). The length of the contralateral MG tendon (L0 tendon) was measured in situ
183
using calipers with the knee and ankle at 90°. The tendon was harvested
184
immediately following euthanasia and frozen in physiological saline for up to 1
185
year before testing. Tendon stiffness (ktendon) was measured as follows. One end
186
of the tendon was attached by Kevlar thread to an ergometer (model 360C,
187
Aurora Scientific Inc., Ontario, Canada) and the other was held in place with a
188
stationary clamp. Each tendon was repeatedly stretched to 2% and 5% of its
189
resting length for five cycles at two frequencies, 2.5Hz (2 sec) and 5Hz (1 sec).
190
by 10.220.32.247 on March 2, 2017
http://jap.physiology.org/
The strain profiles selected encompassed the predicted tendon strains during
191
walking and running (25), reached linear stress-strain profile and avoided plastic
192
deformation. Tendon stiffness (N/mm) was calculated as the slope of the linear
193
region of the third stretching cycle.
194
195
2.2 Computational muscle-tendon model
196
We used Simulink (MathWorks®, Natick, MA) to develop a computational
197
model (50) and ran simulations using empirical data from either young or old
198
muscles. Briefly, the models consisted of a Hill-type muscle model with nonlinear
199
F-L and F-V properties in series with a linearly elastic tendon. Muscle activation
200
was modeled after Zajac (61). The young and old models were validated by
201
comparing the force profiles of tetanic contractions measured in situ in young and
202
old muscles with the simulated output force profile of the models (Fig. 1).
203
Once validated, young and old muscle tendon unit models were oscillated
204
through 3 Hz stretch-shorten cycles with an amplitude that corresponded to 25%
205
of their resting length (muscle L0 plus tendon slack length, Lslack tendon; 13.5mm for
206
young) starting at 1.1L0. In length matched simulations, old muscle tendon unit
207
models were also oscillated through 3 Hz stretch-shorten cycles with an
208
amplitude that corresponded to 25% of their resting length (muscle L0 plus
209
tendon slack length, Lslack tendon; 11.2mm). However, the differences in the
210
empirically derived passive stiffness of the young and old muscles (Table 1)
211
meant that while these simulations provided a length matched comparison
212
between young and old muscle, they did not provide a reasonable force matched
213
by 10.220.32.247 on March 2, 2017
http://jap.physiology.org/
comparison. In order to achieve a force-matched simulation, we also cycled old
214
muscle through a 3 Hz stretch-shorten cycle with a starting length of 1.0L0 and
215
an amplitude corresponding to 12% MTU strain. This resulted in more
216
comparable passive forces both at the beginning of the cycle and throughout the
217
stretch-shorten cycle.
218
In all simulations, the muscle was stimulated for 10% of the cycle. The
219
stimulus was applied at 12.5% intervals to find the timing of stimulation that
220
minimized net muscle work. In all simulations the optimal phase, resulting in the
221
least net work was 37.5% where 0% is the beginning of lengthening (Fig. 2).
222
223
3 RESULTS
224
Our empirical measurements are largely consistent with previous studies
225
describing age-related changes to muscle and tendon. We found that aging
226
results in a decrease in both maximum isometric force (Fmax) and maximum
227
shortening velocity (Vmax) (Table 1). The passive stiffness of the muscle was
228
higher and passive tension developed at shorter lengths (1.0L0) in old muscles,
229
compared to young muscles (1.1L0) (Table 1). We also found that the stiffness of
230
the series elastic tendon was higher in old compared to young muscles (Table 1).
231
Activation time constant (tact) was not different between young and old muscles,
232
but old muscles took longer to deactivate (tdeact; Table 1) as has been observed
233
elsewhere (10).
234
To validate the outputs of the muscle-tendon model, we compared an
235
empirical tetanic contraction from an in situ preparation with the predicted force
236
by 10.220.32.247 on March 2, 2017
http://jap.physiology.org/
profile from a model simulation (Fig. 1). To simulate the removal of the tendon
237
from the in situ preparation we set tendon stiffness to an unrealistically high value
238
prior to our validation trials. The model predicted the path of force rise and decay
239
reasonably well, with the most obvious difference lying in the rate of force decay.
240
In the empirical tetanic contractions, force dropped at a faster rate than in the
241
computational model (Fig. 1).
242
First we compared young and old MTUs under strain-matched conditions
243
where the length trajectories imposed on the virtual MTUs were identical. Both
244
young and old muscles start the work loop cycle at 1.0L0 and undergo sinusoidal
245
length changes with 25% MTU strain (Fig. 2A, B). The young contractile element
246
(CE; Fig. 2A) initially shortens internally against the tendon while the old CE
247
produces force nearly isometrically. Additionally, in the young MTU the CE
248
makes up nearly twice as much of the total MTU strain as the SEE, but a larger
249
proportion of MTU strain is due to the stretch of the tendon (SEE) in the old MTU
250
(Fig. 2B). On the other hand, as the MTU is being passively stretched prior to
251
stimulation, the increased stiffness of the old muscle and tendon result in higher
252
initial and maximum passive forces in the old MTU (Fig. 2B). Under these
strain-253
matched conditions, old MTUs seemed better tuned for elastic energy utilization
254
than young MTUs. The old CE performed less active work and the SEE cycled
255
nearly 100% of the elastic energy stored in it (Fig. 3A, B).
256
Second, we compared young and old MTUs under force-matched
257
conditions, where the length trajectories imposed on the virtual MTU were
258
adjusted to produce similar passive forces prior to activation. This resulted in a
259
by 10.220.32.247 on March 2, 2017
http://jap.physiology.org/
passive force of 3.5N for the young MTU and 2.7N in the old MTU under force
260
matched conditions, compared to a passive force prior to stimulation of 8.8N in
261
the old MTU under strain-matched conditions. To match passive force profiles,
262
old work loops were performed with shorter initial muscle length (1.0 vs. 1.1 L0
263
muscle) and at nearly half the amplitude (12% vs. 25% MTU strain) when 264
compared to young (Fig. 2C). Under these conditions, muscle and tendon took
265
up equal amounts of the imposed MTU strain prior to stimulation. At stimulation
266
the muscle shortened against the tendon but produced less active force than the
267
young muscle (Fig. 2C). Under these force-matched conditions positive MTU
268
work was reduced to nearly a third of young MTU work (Fig. 3C)
269
We also compared the absolute and relative contributions of active and
270
passive forces to total force and work (Fig. 4). Young MTUs produced a
271
maximum force of 6N while strain-matched old MTUs produced nearly twice as
272
much force (11.1N). However, 80% of the total force came from passive tissues
273
in the old MTU, compared to 55% in the young MTU (Fig. 4A). Under
force-274
matched conditions, the proportion of passive to total force in old MTUs dropped
275
to 53%, similar to young MTUs. We also calculated the amount of positive work
276
done by the muscle (active) and series elastic elements (passive) and the
277
proportion of total positive work (CE + SEE) done by each element (Fig. 4B).
278
Although the proportion of elastic potential energy, calculated as the product of
279
total force and SEE length change, was similar in all three simulation conditions
280
(44% to 50%) the absolute magnitudes of these differed greatly, with old MTUs
281
by 10.220.32.247 on March 2, 2017
http://jap.physiology.org/
under strain-matched conditions producing the most work but old MTUs in the
282
force-matched model producing the least.
283
To examine whether age-related changes affected where muscles
284
operated on the force-length and force-velocity curves we plotted the active
285
muscle lengths and shortening velocities on empirically derived force-length and
286
force-velocity curves (Fig. 5). The operating length of the muscle was largely
287
determined by the initial length of the MTU and prescribed strain patterns.
288
Therefore, during strain-matched simulations young and old muscles operated
289
over similar regions of the force-length curve (I and II, Fig. 5A). However, during
290
force-matched simulations old MTUs operated on the plateau and underwent
291
less length change (III, Fig. 5A). Young MTUs underwent significant periods of
292
active shortening (positive V/Vmax) and also operated eccentrically near Fmax for
293
part of the cycle (I, Fig. 5B). In the strain-matched condition, old MTUs never
294
shortened and operated closer to Fmax (II, Fig. 5B). In force-matched conditions
295
however, they behave more like the young MTU, undergoing both con- and
296
eccentric contractions albeit at lower average lengthening velocities (III, Fig. 5B).
297
298
4 DISCUSSION
299
We used empirically informed simulations to assess how age-related
300
changes in the mechanical properties of an MTU affect how mechanical work is
301
distributed between the muscle and the series elastic elements during cyclical
302
contractions and how such changes affect muscle operating lengths and
303
velocities.
304
by 10.220.32.247 on March 2, 2017
http://jap.physiology.org/
305
4.1 Changes in MTU Mechanical Properties with Age
306
We found that in the rat gastrocnemius both the muscle and tendon
307
increased in stiffness with advanced aging, similar to what has been reported in
308
other studies (1,13, 14, 18, 21, 54) (Table 1). Muscle fibrosis and increased
309
deposition of collagen in the extracellular matrix (ECM) is common amongst
310
neuromuscular pathologies, atrophy, and aging (36). During aging, muscle stem
311
cells disproportionately shift from a myogenic (forming muscle cells) fate to a
312
fibrogenic fate and cause a relative increase in collagen content, leading to a
313
“fibrotic” muscle phenotype (1, 21, 32). Fibrotic muscles have increased passive
314
stiffness and develop passive tension at shorter relative lengths (Table 1; 36).
315
Despite numerous studies that have measured the tensile properties of
316
tendons, there has been no consensus on whether advanced aging increases
317
(13, 54), decreases (9, 30, 59) or has no effect (29, 40) on tendon stiffness or
318
modulus. This is surprising given the observed decrease in the crimp angle of
319
collagen and increased fiber cross-linking with aging (18), which suggest that
320
structural changes should lead to an increase in Young’s modulus (18, 58).
321
However, none of these studies concerned the Achilles tendon of rats. Tendons
322
have been shown to have varying structural and material properties depending
323
on their in vivo function (8, 54). Therefore, it is worth conducting future studies to
324
explore how age-related effects might differ among muscle-tendon groups with
325
varying functions.
326
by 10.220.32.247 on March 2, 2017
http://jap.physiology.org/
We also documented a reduction of maximum isometric muscle force with
327
aging (Table 1) similar to numerous other studies. However, our results suggest
328
that at longer MTU lengths passive forces may compensate for the loss of active
329
force capacity in old muscles (Fig. 2). This result may help explain previous
330
findings that have shown that the age-related loss of force is more pronounced
331
during concentric or isometric tasks compared to eccentric tasks where passive
332
forces are more likely to contribute (27).
333
334
4.2 MTU strain and work
335
In the old MTU, we matched either total MTU strain (strain-matched simulation)
336
or total MTU passive force (force-matched simulation) to the values seen in
337
young MTUs. The reduction in active force capacity coupled with the increased
338
stiffness of the muscle and series elastic elements meant that when young and
339
old MTUs undergo the same strain cycle, passive forces contributed much more
340
to the total MTU force and positive work in old MTUs. However the passive
341
stretch of the old muscle requires more force production, either by the contraction
342
of antagonists or by the generation of increased inertial loads, both of which are
343
likely to bear an energetic burden. The strain-matched conditions are highly
344
unlikely under physiologically realistic conditions. Firstly, antagonist muscles are
345
likely to show a similar decline in active force capacity and therefore may not be
346
able to generate sufficient forces to stretch muscles to such high passive
347
tensions. Similarly, given that body mass is unlikely to increases in old animals
348
and vertical velocity during walking is actually reduced (25, 45), the
349
by 10.220.32.247 on March 2, 2017
http://jap.physiology.org/
inertial/gravitational forces loading the muscle-tendons would not be high enough
350
to stretch old muscle to lengths that correspond to significant passive force. The
351
reduction in MTU amplitude from 25% to 12% in the force-matched simulations is
352
likely still an over estimate of the strain antagonist muscles would be able to
353
impose given the high passive stiffness of gastrocnemius MTU and the 50%
354
reduction in force producing capacity in old rats (Table 1).
355
The force-matched simulations are therefore more likely to represent the
356
realistic conditions to compare under the young and old MTU. It has been
357
previously shown that variation in the passive stiffness of a muscle shifts the
358
operating length such that muscles are recruited at similar passive forces rather
359
than similar lengths (4). The results of the force-matched model potentially
360
explain some of the distinct gait changes that occur with aging in a diversity of
361
animal groups including humans (25, 53). Under such conditions an old MTU
362
performs about one third of the work per stride compared to young MTUs (Fig.
363
4A). This result is consistent with the reduction in preferred walking speed with
364
age in humans (38) and the lower stride length observed in older humans and
365
animals (25, 53). Therefore, a scenario of muscles operating at shorter lengths
366
and undergoing lower muscle excursions may be more representative of in vivo
367
muscle conditions in older animals and humans.
368
The reduction in operating lengths and strain amplitude suggested by our
369
simulations (Fig. 5A) may also protect old muscle from damage. Operating on the
370
descending limb of the force-length relationship and undergoing larger
371
lengthening strains are associated with an increase in the likelihood of muscle
372
by 10.220.32.247 on March 2, 2017
http://jap.physiology.org/
damage (22). Avoiding such longer lengths may be particularly beneficial as
373
fibers from old muscles are more prone to being damaged (12), and less efficient
374
at recovering from injury (11).
375
Elastic energy storage was not always compromised in old MTUs. From
376
the strain-matched models we could see that if there was enough force available
377
to stretch the MTU to similar strains in the aged animals elastic energy storage
378
would increase due to the increased stiffness of the muscle and tendon (Fig. 4).
379
Although the absolute amount of elastic energy stored is much reduced in the
380
force-matched model, the proportion of total work done by the passive elements
381
is actually slightly increased. Hence, whilst the total work of the system may
382
decrease with age, the contribution of the tendon does not necessarily change.
383
384
4.3 Energetic implications of changes in MTU properties due to aging
385
The physiologically more relevant force-matched simulations of the old
386
MTU may have some potential implications for the energetic cost of locomotion.
387
The reduced work production by the gastrocnemius in this condition will reduce
388
the range of motion at the ankle, the primary joint where work is done during
389
push off (19). This will require more work to be done by the more proximal
390
muscles around the knee and hip joints (26). This shift in joint work results in a
391
shift in the architecture of the muscles used from short fibered pennate muscles
392
with long tendons in the distal limb to long fibered parallel muscles with little
393
external tendon in the proximal limb. This shift in the architecture of muscles
394
used may increase the cost of generating mechanical work (34, 49). Smaller
395
by 10.220.32.247 on March 2, 2017
http://jap.physiology.org/
muscle moment arms during crouched postures (7, 25) further contribute to a
396
reduction in ankle work. Similar kinematic and energetic changes were observed
397
when ankle excursion and work were limited by a rigid ankle orthotic prosthesis
398
in humans (28).
399
Additionally, there is a well-documented increase in both synergist and
400
antagonist muscle co-contraction with aging (20, 39, 46). It has been
401
hypothesized that co-contraction of antagonists may provide additional joint
402
stability to support the body weight (39) given the reduced capacity of each
403
muscle to produce force. Furthermore, the results of our force-matched
404
simulations show that co-contraction of synergistic muscles is a means of
405
compensating for reduced work due to the changes in active and passive
406
mechanical properties of the MTU. If the age-related changes we observe in rats
407
are similar in humans then the recruitment of additional muscles may contribute
408
to the additional metabolic cost of locomotion in the elderly; co-contraction of
409
knee extensors and flexors alone can account for 28-52% of the increased
410
metabolic cost of walking (39).
411
Changes in the stiffness of an MTU also alter its natural frequency.
412
Resonance occurs when a system is driven at its natural frequency, and has
413
been shown to significantly affect both MTU dynamics (51) and the metabolic
414
efficiency of locomotion (17). However, in our analyses we used a single driving
415
frequency for two different mechanical systems. This could explain why we
416
observed no shift in the stimulation onset that minimized active muscle work,
417
similar to what has been observed in the onset of gastrocnemius activity in a
418
by 10.220.32.247 on March 2, 2017
http://jap.physiology.org/
speed-matched study of young and old men walking (39). In an unconstrained
419
work loop experiment it was shown that when MTUs of different mechanical
420
properties were cycled at their natural frequency, stimulation onset shifted
421
relative to length changes to tune MTUs for maximum force and elastic energy
422
storage (51). By constraining the driving frequency of the MTU or during
speed-423
matched in vivo studies we are likely forcing energy inefficient dynamics onto
424
systems whose stiffness differs by nearly two-fold.
425
426
4.4 Potential Limitations
427
There were a number of simplifications we made to the structural
428
morphology of our MTU model that are worth addressing. First, our model is a
429
one dimensional muscle model that can account for the functional effects of
430
certain morphological changes along the line of action of the free tendon (e.g.
431
reduction in the cross-sectional area of muscles and tendon) but cannot address
432
off-axis shape changes that occur during in vivo contractions. For example, our
433
simulations do not account for three-dimensional effects such as muscle gearing
434
(2) that have been shown to be significantly affected by age (23). In addition, our
435
simulations used a series elastic element with a linear stress-strain relationship
436
and a constant stiffness. The stress-strain curve of tendons has a non-linear
437
stiffness at lower strains (toe region), which may have some small impact on
438
MTU dynamics at the lowest force levels. In addition, aponeuroses have been
439
shown to deform biaxially during stretch-shorten cycles and to function as
440
variable stiffness springs (3). Thus, it is possible that the effects of aging on the
441
by 10.220.32.247 on March 2, 2017
http://jap.physiology.org/
dynamic changes in aponeurosis stiffness may also alter the length trajectory of
442
an MTU.
443
Aspects of our work loop protocol may also deviate from capturing all of
444
the features of in vivo MTU dynamics. Work loops that strictly enforce MTU
445
length change patterns and muscle stimulation phase provide a highly controlled
446
experimental framework that is useful for gaining initial insights (52). However,
447
while our imposed length trajectories were symmetrical sine waves, the actual
448
length trajectories of MTUs like the gastrocnemius may be more accurately
449
characterized as asymmetrical (51). In addition, we note that cyclic contractions
450
in freely moving animals are more likely the result of the dynamic interaction
451
between MTU force output, the load of the body and the dynamics of the
452
environment (51). Finally, any extrapolation from our results to the mechanics
453
and energetics of human locomotion are based on the assumption that
454
mechanical changes that occur with age are shared between our rodent model
455
and humans. Despite these limitations, our study is the first to use empirically
456
informed simulations to compare the dynamics of old and young MTUs and
457
provides fundamental insight into the mechanical interactions of muscles and
458
tendons.
459
460
4.5 Conclusions
461
In this study we used an empirically driven simulation of muscle-tendon unit
462
dynamics to explore the effect of age-related disruptions to active and passive
463
by 10.220.32.247 on March 2, 2017
http://jap.physiology.org/
suggest that the ability to store and return energy in tendons is not always
465
compromised with age as passive forces compensate for a decline in active force
466
production. However, age-related increases in passive stiffness are likely to
467
reduce MTU strain, and therefore mechanical work. This reduced work capacity
468
is likely to significantly impact energetic performance as more muscle mass may
469
be required to retain comparable joint dynamics.
470
Acknowledgements
471
We would like to thank Emily Abbott for help during experiments and for useful
472
discussions at the early stages of this study.
473
Grants
474
This study was funded by National Institute of Health grant AR055295 and
475
National Science Foundation grant 1436476.
476
Disclosures
477
The authors declare no conflicts of interest.
478
References
479
1. Alnaqeeb MA, Zaid Al NS, Goldspink G. Connective tissue changes and
480
physical properties of developing and ageing skeletal muscle. J Anat 139 (
481
Pt 4): 677–689, 1984.
482
2. Azizi E, Brainerd EL, Roberts TJ. Variable gearing in pennate muscles.
483
Proc Natl Acad Sci USA 105: 1745–1750, 2008. 484
3. Azizi E, Roberts TJ. Biaxial strain and variable stiffness in aponeuroses.
485
The Journal of Physiology 587: 4309–4318, 2009. 486
4. Azizi E. Locomotor function shapes the passive mechanical properties
487
and operating lengths of muscle. Proceedings of the Royal Society B:
488
Biological Sciences 281: 20132914–20132914, 2014. 489
5. Ballak SB, Degens H, de Haan A, Jaspers RT. Aging related changes in
490
determinants of muscle force generating capacity: A comparison of
491
muscle aging in men and male rodents. Ageing Res Rev 14: 43–55, 2014.
492
6. Biewener AA, Roberts TJ. Muscle and tendon contributions to force,
493
work, and elastic energy savings: a comparative perspective. Exercise
494
by 10.220.32.247 on March 2, 2017
http://jap.physiology.org/
Muscle Mechanics. Science 245: 45–48, 1989. 497
8. Birch HL. Tendon matrix composition and turnover in relation to functional
498
requirements. Int J Exp Pathol 88: 241–248, 2007.
499
9. Blevins FT, Hecker AT, Bigler GT, Boland AL, Hayes WC. The Effects
500
of Donor Age and Strain-Rate on the Biomechanical Properties of
Bone-501
Patellar Tendon-Bone Allografts. Am J Sports Med 22: 328–333, 1994.
502
10. Brooks SV, Faulkner JA. Contractile properties of skeletal muscles from
503
young, adult and aged mice. The Journal of Physiology 404: 71–82, 1988.
504
11. Brooks SV, Faulkner JA. Contraction-Induced Injury - Recovery of
505
Skeletal-Muscles in Young and Old Mice. Am J Physiol 258: C436–C442,
506
1990.
507
12. Brooks SV, Faulkner JA. The magnitude of the initial injury induced by
508
stretches of maximally activated muscle fibres of mice and rats increases
509
in old age. The Journal of Physiology 497: 573–580, 1996.
510
13. Canon F, Gamet D, Perot C. Passive stiffness of rat soleus muscle from
511
weaning to senescence. Computer Methods in Biomechanics and
512
Biomedical Engineering 11: 49–50, 2008. 513
14. Carroll CC, Dickinson JM, Haus JM, Lee GA, Hollon CJ, Aagaard P,
514
Magnusson SP, Trappe TA. Influence of aging on the in vivo properties
515
of human patellar tendon. Journal of Applied Physiology 105: 1907–1915,
516
2008.
517
15. Cavagna GA, Legramandi MA, Peyre-Tartaruga LA. Old men running:
518
mechanical work and elastic bounce. Proc Biol Sci 275: 411–418, 2008.
519
16. Conley KE. Mitochondria to motion: optimizing oxidative phosphorylation
520
to improve exercise performance. Journal of Experimental Biology 219:
521
243–249, 2016.
522
17. Dean JC, Kuo AD. Energetic costs of producing muscle work and force in
523
a cyclical human bouncing task. J Appl Physiol 110: 873–880, 2011.
524
18. Diamant J, Keller A, Baer E, Litt M, Arridge R. Collagen; ultrastructure
525
and its relation to mechanical properties as a function of ageing. Proc Biol
526
Sci 180: 293–315, 1972.
527
19. Farris DJ, Sawicki GS. The mechanics and energetics of human walking
528
and running: a joint level perspective. Journal of The Royal Society
529
Interface (May 25, 2011). doi: 10.1098/rsif.2011.0182. 530
20. Franz JR, Kram R. How does age affect leg muscle activity/coactivity
531
during uphill and downhill walking? Gait Posture 37: 378–384, 2013.
532
21. Gao Y, Kostrominova TY, Faulkner JA, Wineman AS. Age-related
533
changes in the mechanical properties of the epimysium in skeletal
534
muscles of rats. Journal of Biomechanics 41: 465–469, 2008.
535
22. Gosselin LE, Burton H. Impact of initial muscle length on force deficit
536
following lengthening contractions in mammalian skeletal muscle. Muscle
537
Nerve 25: 822–827, 2002. 538
23. Holt NC, Danos N, Roberts TJ, Azizi E. Stuck in gear: age-related loss
539
of variable gearing in skeletal muscle. Journal of Experimental Biology
540
219: 998–1003, 2016.
541
by 10.220.32.247 on March 2, 2017
http://jap.physiology.org/
unit activation on whole-muscle mechanical performance: the size
543
principle may not pose a mechanical paradox. Proceedings of the Royal
544
Society B: Biological Sciences 281: 20140002–20140002, 2014. 545
25. Horner AM, Russ DW, Biknevicius AR. Effects of early-stage aging on
546
locomotor dynamics and hindlimb muscle force production in the rat.
547
Journal of Experimental Biology 214: 3588–3595, 2011. 548
26. Hortobágyi T, Finch A, Solnik S, Rider P, DeVita P. Association
549
between muscle activation and metabolic cost of walking in young and old
550
adults. J Gerontol A Biol Sci Med Sci 66: 541–547, 2011.
551
27. Hortobágyi T, Zheng D, Weidner M, Lambert NJ, Westbrook S,
552
Houmard JA. The influence of aging on muscle strength and muscle fiber
553
characteristics with special reference to eccentric strength. J Gerontol A
554
Biol Sci Med Sci 50: B399–406, 1995. 555
28. Huang T-WP, Shorter KA, Adamczyk PG, Kuo AD. Mechanical and
556
energetic consequences of reduced ankle plantar-flexion in human
557
walking. Journal of Experimental Biology 218: 3541–3550, 2015.
558
29. Johnson GA, Tramaglini DM, Levine RE, Ohno K, Choi NY, Woo SL.
559
Tensile and viscoelastic properties of human patellar tendon. J Orthop
560
Res 12: 796–803, 1994.
561
30. Karamanidis K, Arampatzis A. Mechanical and morphological properties
562
of different muscle-tendon units in the lower extremity and running
563
mechanics: effect of aging and physical activity. Journal of Experimental
564
Biology 208: 3907–3923, 2005. 565
31. Kent-Braun JA, Ng AV, Young K. Skeletal muscle contractile and
566
noncontractile components in young and older women and men. J Appl
567
Physiol 88: 662–668, 2000. 568
32. Kragstrup TW, Kjaer M, Mackey AL. Structural, biochemical, cellular,
569
and functional changes in skeletal muscle extracellular matrix with aging.
570
Scand J Med Sci Sports 21: 749–757, 2011. 571
33. Kubo K, Kanehisa H, Miyatani M, Tachi M, Fukunaga T. Effect of
low-572
load resistance training on the tendon properties in middle-aged and
573
elderly women. Acta Physiol Scand 178: 25–32, 2003.
574
34. Lichtwark GA, Wilson AM. Effects of series elasticity and activation
575
conditions on muscle power output and efficiency. J Exp Biol 208: 2845–
576
2853, 2005.
577
35. Lichtwark GA, Wilson AM. In vivo mechanical properties of the human
578
Achilles tendon during one-legged hopping. J Exp Biol 208: 4715–4725,
579
2005.
580
36. Lieber RL, Ward SR. Cellular Mechanisms of Tissue Fibrosis. 4.
581
Structural and functional consequences of skeletal muscle fibrosis. Am. J.
582
Physiol-cell physiology 305: C241–C252, 2013. 583
37. Magnusson SP, Hansen P, Aagaard P, Brond J, Dyhre-Poulsen P,
584
Bojsen-Moller J, Kjaer M. Differential strain patterns of the human
585
gastrocnemius aponeurosis and free tendon, in vivo. Acta Physiol Scand
586
177: 185–195, 2003.
587
by 10.220.32.247 on March 2, 2017
http://jap.physiology.org/
C, Caillaud C. Aerobic determinants of the decline in preferred walking
589
speed in healthy, active 65-and 80-year-olds. Pflugers Arch 447: 915–921,
590
2004.
591
39. Mian OS, Thom JM, Ardigò LP, Narici MV, Minetti AE. Metabolic cost,
592
mechanical work, and efficiency during walking in young and older men.
593
Acta Physiol (Oxf) 186: 127–139, 2006. 594
40. Nakagawa Y, Hayashi K, Yamamoto N, Nagashima K. Age-related
595
changes in biomechanical properties of the Achilles tendon in rabbits. Eur
596
J Appl Physiol Occup Physiol 73: 7–10, 1996. 597
41. Narici MV, Maffulli N. Sarcopenia: characteristics, mechanisms and
598
functional significance. Br Med Bull 95: 139–159, 2010.
599
42. Narici MV, Maganaris CN, Reeves ND, Capodaglio P. Effect of aging on
600
human muscle architecture. J Appl Physiol 95: 2229–2234, 2003.
601
43. Noyes FR, Grood ES. The strength of the anterior cruciate ligament in
602
humans and Rhesus monkeys. J Bone Joint Surg Am 58: 1074–1082,
603
1976.
604
44. Onambele GL, Narici MV, Maganaris CN. Calf muscle-tendon properties
605
and postural balance in old age. J Appl Physiol 100: 2048–2056, 2006.
606
45. Ortega JD, Farley CT. Minimizing center of mass vertical movement
607
increases metabolic cost in walking. J Appl Physiol 99: 2099–2107, 2005.
608
46. Ortega JD, Farley CT. Effects of aging on mechanical efficiency and
609
muscle activation during level and uphill walking. Journal of
610
Electromyography and Kinesiology 25: 193–198, 2015. 611
47. Ramaswamy KS, Palmer ML, van der Meulen JH, Renoux A,
612
Kostrominova TY, Michele DE, Faulkner JA. Lateral transmission of
613
force is impaired in skeletal muscles of dystrophic mice and very old rats.
614
The Journal of Physiology 589: 1195–1208, 2011. 615
48. Reddy GK, Stehno-Bittel L, Enwemeka CS. Glycation-Induced Matrix
616
Stability in the Rabbit Achilles Tendon. Archives of Biochemistry and
617
Biophysics 399: 174–180, 2002. 618
49. Roberts TJ. The integrated function of muscles and tendons during
619
locomotion. Comp Biochem Physiol, Part A Mol Integr Physiol 133: 1087–
620
1099, 2002.
621
50. Robertson BD, Sawicki GS. Exploiting elasticity: Modeling the influence
622
of neural control on mechanics and energetics of ankle muscle-tendons
623
during human hopping. J. Theoretical Biology 353: 121–132, 2014.
624
51. Robertson BD, Sawicki GS. Unconstrained muscle-tendon workloops
625
indicate resonance tuning as a mechanism for elastic limb behavior during
626
terrestrial locomotion. Proc Natl Acad Sci USA 112: E5891–8, 2015.
627
52. Sawicki GS, Robertson BD, Azizi E, Roberts TJ. Timing matters: tuning
628
the mechanics of a muscle-tendon unit by adjusting stimulation phase
629
during cyclic contractions. Journal of Experimental Biology 218:
630
jeb.121673–3159, 2015.
631
53. Schultz AB. Mobility impairment in the elderly: challenges for
632
biomechanics research. Journal of Biomechanics 25: 519–528, 1992.
633
by 10.220.32.247 on March 2, 2017
http://jap.physiology.org/
related to function and age. J. Appl. Physiol. 635
55. Skelton DA, Greig CA, Davies JM, Young A. Strength, power and
636
related functional ability of healthy people aged 65-89 years. Age Ageing
637
23: 371–377, 1994.
638
56. Takeshita D, Shibayama A, Muraoka T, Muramatsu T, Nagano A,
639
Fukunaga T, Fukashiro S. Resonance in the human medial
640
gastrocnemius muscle during cyclic ankle bending exercise. J Appl
641
Physiol 101: 111–118, 2006. 642
57. Thom JM, Morse CI, Birch KM, Narici MV. Influence of muscle
643
architecture on the torque and power-velocity characteristics of young and
644
elderly men. Eur J Appl Physiol 100: 613–619, 2007.
645
58. Thompson JI, Czernuszka JT. The effect of two types of cross-linking on
646
some mechanical properties of collagen. Biomed Mater Eng 5: 37–48,
647
1995.
648
59. Vogel HG. Influence of maturation and aging on mechanical and
649
biochemical properties of connective tissue in rats. Mech. Ageing Dev.
650
60. Young A, Stokes M, Crowe M. The Size and Strength of the Quadriceps
651
Muscles of Old and Young Men. Clin Physiol 5: 145–154, 1985.
652
61. Zajac FE. Muscle and Tendon - Properties, Models, Scaling, and
653
Application to Biomechanics and Motor Control. Crit Rev Biomed Eng 17:
654
359–411, 1989.
655
656 657 658 659 660 661 662
by 10.220.32.247 on March 2, 2017
http://jap.physiology.org/
Figure Captions
663
Table 1. Empirically derived model parameters (mean± S.D.) for young and old
664
rat medial gastrocnemius (MG) muscle-tendon unit.
665
666
Figure 1. Simulated and experimental tetanic contractions. Experimental data
667
(solid lines) consists of a single tetanic contraction of the intact medial
668
gastrocnemius, at L0, with a 450 ms stimulation. Computational simulations
669
(dotted lines) match experimental data reasonably well in both the young (A) and
670
old (B) cases, with the most obvious difference being a slower rate of force decay
671
in the modeled data. Fmax is the maximum isometric force.
672
673
Figure 2. Time series of length change, force development and power during
674
simulations (3Hz with 10% duty stimulation starting at 37.5%) for the three
675
conditions tested. The period of stimulation is indicated by the shaded grey
676
region. Total MTU (muscle-tendon unit) length change is different for young and
677
old MTUs (A and B) because resting MTU length differed in the two age groups
678
(54mm for young vs. 44.6mm for old MTU when measured with the ankle and
679
knee at 90°). During strain-matched simulations when the starting length and
680
strain amplitudes are the same (A and B), the old MTU develops high passive
681
forces prior to activation. During force-matched simulations when initial passive
682
force and total maximum force are similar (A and C), old MTU develops
683
significantly less power and store less energy in series elastic elements. CE is
684
the contractile element and SEE is the series elastic element.
685
by 10.220.32.247 on March 2, 2017
http://jap.physiology.org/
Figure 3. Muscle-tendon unit (MTU) and contractile element (CE) work loops
687
from simulations of MTU at 3Hz with 10% duty stimulation starting at 37.5% of
688
the cycle (with respect to the beginning of shortening). When young and old
689
MTUs are cycled under the same conditions (A, B) old MTUs start at a higher
690
passive force and, when stimulated, contract nearly isometrically performing less
691
positive work than young muscles (CE). However, if the initial passive force and
692
the maximum total force is matched between young and old MTUs, old MTUs are
693
stretched by only 12% of their resting length and the muscle starts contracting at
694
1.0L0 compared to 1.1L0 of the young CE. Bolded regions of the work loops
695
represent periods of active force production.
696
697
Figure 4. Contributions of passive (SEE) and active (CE) elements to total force
698
and work production, under each of the three simulation conditions. A) When old
699
MTUs were cycled with the same conditions as young MTUs the peak total force
700
doubled due to a large increase in passive force and a reduction in active muscle
701
force. When old MTUs were allowed to begin cycling at shorter lengths and with
702
smaller strain excursions, both the absolute and relative passive and active peak
703
force patterns resembled that of young MTUs. B) In a young MTUs, CE and SEE
704
both contribute 50% of the work in a work loop. The relative values are similar in
705
old MTUs cycled under the same conditions, but the absolute value of work is
706
more than doubled. However, when the peak muscle force is kept at realistic
707
values for old MTUs (initial muscle length at 1L0 and 12% MTU strain) the whole
708
by 10.220.32.247 on March 2, 2017
http://jap.physiology.org/
MTU performs less than a third of the work that a young MTU does under
709
physiological conditions.
710
711
Figure 5. Operating range of young and old muscles under three simulation
712
conditions, mapped on experimentally derived force-length and force-velocity
713
curves: I. Young; II. Old, strain-matched conditions; III. Old, force-matched
714
conditions. Data are shown only for the active portion of the cycle. A) Young and
715
old muscle acting the same strain stretch-shorten conditions (muscle Linitial=1.1L0,
716
25% MTU strain) operate on the descending limb of the force-length curve.
717
However, old muscle acting under conditions that match that MTU passive force
718
produced during stretching operate on the plateau, nearer to L0. B) Young
719
muscle operates over a broader range of velocities than old muscle under either
720
strain-matched or force-matched condition.
721
722
by 10.220.32.247 on March 2, 2017
http://jap.physiology.org/
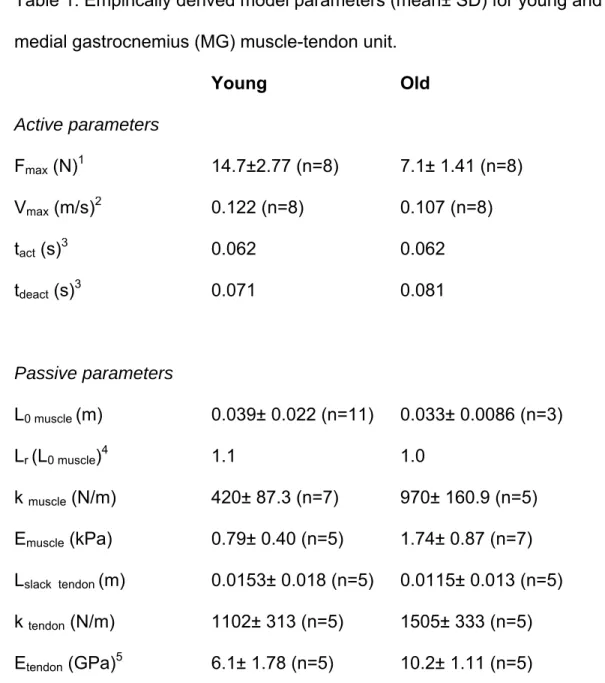
Table 1. Empirically derived model parameters (mean± SD) for young and old rat
medial gastrocnemius (MG) muscle-tendon unit.
Young Old
Active parameters
Fmax (N)1 14.7±2.77 (n=8) 7.1± 1.41 (n=8)
Vmax (m/s)2 0.122 (n=8) 0.107 (n=8)
tact (s)3 0.062 0.062
tdeact (s)3 0.071 0.081
Passive parameters
L0 muscle (m) 0.039± 0.022 (n=11) 0.033± 0.0086 (n=3)
Lr (L0 muscle)4 1.1 1.0
k muscle (N/m) 420± 87.3 (n=7) 970± 160.9 (n=5)
Emuscle (kPa) 0.79± 0.40 (n=5) 1.74± 0.87 (n=7)
Lslack tendon (m) 0.0153± 0.018 (n=5) 0.0115± 0.013 (n=5)
k tendon (N/m) 1102± 313 (n=5) 1505± 333 (n=5)
Etendon (GPa)5 6.1± 1.78 (n=5) 10.2± 1.11 (n=5)
1 Mean peak isometric stress multiplied by mean
triceps surae cross-sectional area and corrected
for the MG proportion of complex. (see Methods)
2 Value was estimated by fitting a single curve to the compiled data for each age group.
3 Selected to match the force rise (t
act) and force decay (tdeact) of a representative in situ tetanic
contraction at L0.
4 Length at which muscle develops passive force.
5 Calculated for 5% strain and 5Hz cycling
by 10.220.32.247 on March 2, 2017
http://jap.physiology.org/
F/F
max
F/F
max
0.4
0.0 0.2 0.6 0.8 1.0
0.4
0.0 0.2 0.6 0.8 1.0
0.4
0.0 0.2 0.6 0.8 1.0
Time (s) 0.4
0.0 0.2 0.6 0.8 1.0
Time (s)
B. A.
YOUNG
expt. (Fmax=12.04 N)
model (Fmax=14.7 N)
OLD
expt. (Fmax=8.76 N)
model (Fmax=7.1 N)
Figure 1 Danos et al.
full width
by 10.220.32.247 on March 2, 2017
http://jap.physiology.org/
Figure 2 Danos et al.
full width SEE CE MTU SEE CE MTU SEE CE MTU SEE CE MTU SEE CE MTU SEE CE MTU Active Passive Total Active Passive Total Active Passive Total
C. OLD
B. OLD
A. YOUNG
0 0.3 0.25 0.2 0.15 0.1 0.05 0 0.35 15 10 5 0.3 0.25 0.2 0.15 0.1 0.05 0 0.35 0 15 10 5 0.3 0.25 0.2 0.15 0.1 0.05 0 0.35 0 15 10 5 Time (s) 0.3 0.25 0.2 0.15 0.1 0.05 0 0.35 -1 1 0 0.5 -0.5 Time (s) 0.3 0.25 0.2 0.15 0.1 0.05 0 0.35 -1 1 0 0.5 -0.5 Time (s) 0.3 0.25 0.2 0.15 0.1 0.05 0 0.35 -1 1 0 0.5 -0.5 0.3 0.25 0.2 0.15 0.1 0.05 0 0.35 0 15 10 5 0 0.3 0.25 0.2 0.15 0.1 0.05 0 0.35 15 10 5 Power (W) F orce (N) ¨ Length (mm) 0 0.3 0.25 0.2 0.15 0.1 0.05 0 0.35 15 10 5 force-matched strain-matched
by 10.220.32.247 on March 2, 2017
http://jap.physiology.org/
MTU CE MTU
CE MTU
strain-matched C. Old
B. Old A. Young
12
10
8
6
4
2
0
14 6 8 10 12 4
2 0
Length (mm)
Force (N)
12
10
8
6
4
2
0
14 6 8 10 12 4
2 0
Length (mm)
Force (N)
Figure 3 Danos et al.
full width
CE
force-matched
12
10
8
6
4
2
0
14 6 8 10 12 4
2 0
Length (mm)
Force (N)
by 10.220.32.247 on March 2, 2017
http://jap.physiology.org/
Figure 4 Danos et al.
full width
0 0.01 0.02 0.03 0.04 0.05 0.06 0.07 0.08
Work (J)
passive active passive
active
12
10
8
6 4
2 0
Force (N)
B. A.
Old
47%
force-matched strain-
matched
Old
20%
force-matched strain-
matched
Young
45%
Old
45%
Old 44% Young
50%
by 10.220.32.247 on March 2, 2017
http://jap.physiology.org/
F/F
max
1.5
0 0.5 1.0
F/F
max
V/Vmax
1.0 0.5
0.0 -0.5
-1.0
L/L0
1.0
0.4
1.4 1.2
1.0 0.8
0.6 0.8
III II
I
III II I
old young
old young
Figure 5 Danos et al.
full width B. A.
by 10.220.32.247 on March 2, 2017
http://jap.physiology.org/